Cities with the Most Immigrants from Korea in Massachusetts
RELATED REPORTS & OPTIONS
Korea
Massachusetts
Compare Cities
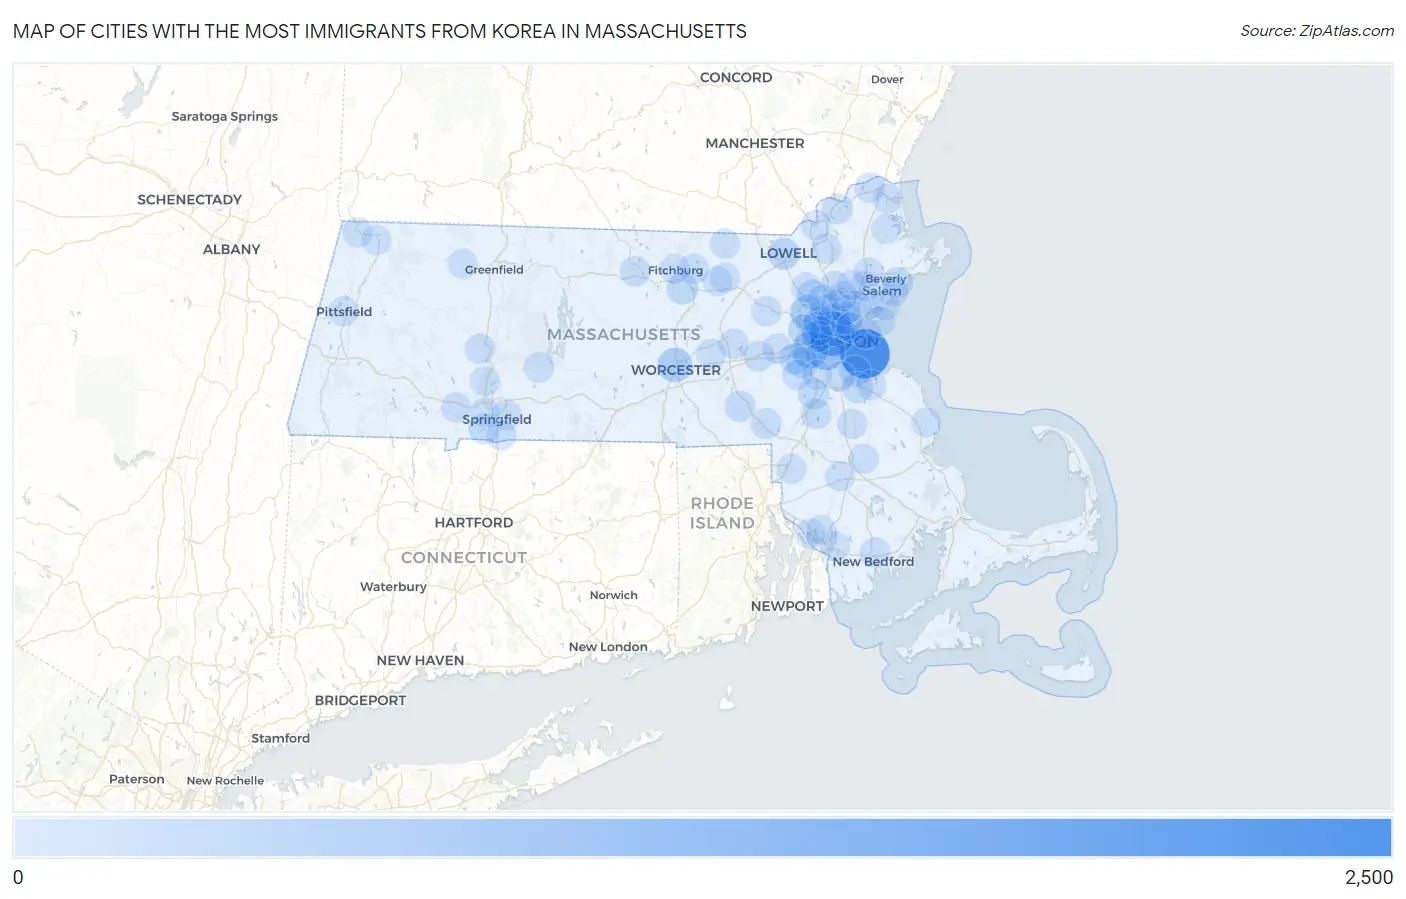
Map of Cities with the Most Immigrants from Korea in Massachusetts
0
2,500
Cities with the Most Immigrants from Korea in Massachusetts
| City | Korea | vs State | vs National | |
| 1. | Boston | 2,406 | 17,613(13.66%)#1 | 1,034,299(0.23%)#45 |
| 2. | Cambridge | 1,746 | 17,613(9.91%)#2 | 1,034,299(0.17%)#69 |
| 3. | Brookline | 952 | 17,613(5.41%)#3 | 1,034,299(0.09%)#153 |
| 4. | Newton | 788 | 17,613(4.47%)#4 | 1,034,299(0.08%)#195 |
| 5. | Lexington | 555 | 17,613(3.15%)#5 | 1,034,299(0.05%)#283 |
| 6. | Worcester | 535 | 17,613(3.04%)#6 | 1,034,299(0.05%)#296 |
| 7. | Somerville | 535 | 17,613(3.04%)#7 | 1,034,299(0.05%)#297 |
| 8. | Belmont | 408 | 17,613(2.32%)#8 | 1,034,299(0.04%)#387 |
| 9. | Arlington | 327 | 17,613(1.86%)#9 | 1,034,299(0.03%)#464 |
| 10. | Medford | 325 | 17,613(1.85%)#10 | 1,034,299(0.03%)#466 |
| 11. | Amherst | 288 | 17,613(1.64%)#11 | 1,034,299(0.03%)#528 |
| 12. | Lowell | 241 | 17,613(1.37%)#12 | 1,034,299(0.02%)#621 |
| 13. | Watertown Town | 210 | 17,613(1.19%)#13 | 1,034,299(0.02%)#714 |
| 14. | Leominster | 198 | 17,613(1.12%)#14 | 1,034,299(0.02%)#752 |
| 15. | Waltham | 196 | 17,613(1.11%)#15 | 1,034,299(0.02%)#759 |
| 16. | Malden | 170 | 17,613(0.97%)#16 | 1,034,299(0.02%)#845 |
| 17. | Quincy | 164 | 17,613(0.93%)#17 | 1,034,299(0.02%)#874 |
| 18. | Needham | 160 | 17,613(0.91%)#18 | 1,034,299(0.02%)#886 |
| 19. | Norwood | 159 | 17,613(0.90%)#19 | 1,034,299(0.02%)#890 |
| 20. | Wellesley | 148 | 17,613(0.84%)#20 | 1,034,299(0.01%)#949 |
| 21. | Burlington | 148 | 17,613(0.84%)#21 | 1,034,299(0.01%)#950 |
| 22. | Braintree Town | 134 | 17,613(0.76%)#22 | 1,034,299(0.01%)#1,019 |
| 23. | Beverly | 127 | 17,613(0.72%)#23 | 1,034,299(0.01%)#1,052 |
| 24. | Agawam Town | 121 | 17,613(0.69%)#24 | 1,034,299(0.01%)#1,102 |
| 25. | Milford | 117 | 17,613(0.66%)#25 | 1,034,299(0.01%)#1,130 |
| 26. | Lynn | 95 | 17,613(0.54%)#26 | 1,034,299(0.01%)#1,297 |
| 27. | Andover | 94 | 17,613(0.53%)#27 | 1,034,299(0.01%)#1,311 |
| 28. | Franklin Town | 93 | 17,613(0.53%)#28 | 1,034,299(0.01%)#1,315 |
| 29. | Haverhill | 86 | 17,613(0.49%)#29 | 1,034,299(0.01%)#1,383 |
| 30. | Winchester | 85 | 17,613(0.48%)#30 | 1,034,299(0.01%)#1,393 |
| 31. | Woburn | 79 | 17,613(0.45%)#31 | 1,034,299(0.01%)#1,464 |
| 32. | Sharon | 77 | 17,613(0.44%)#32 | 1,034,299(0.01%)#1,503 |
| 33. | Gardner | 75 | 17,613(0.43%)#33 | 1,034,299(0.01%)#1,516 |
| 34. | Stoneham | 72 | 17,613(0.41%)#34 | 1,034,299(0.01%)#1,559 |
| 35. | Everett | 71 | 17,613(0.40%)#35 | 1,034,299(0.01%)#1,570 |
| 36. | Reading | 69 | 17,613(0.39%)#36 | 1,034,299(0.01%)#1,602 |
| 37. | North Attleborough | 67 | 17,613(0.38%)#37 | 1,034,299(0.01%)#1,629 |
| 38. | Framingham | 65 | 17,613(0.37%)#38 | 1,034,299(0.01%)#1,658 |
| 39. | Peabody | 55 | 17,613(0.31%)#39 | 1,034,299(0.01%)#1,816 |
| 40. | Saugus | 55 | 17,613(0.31%)#40 | 1,034,299(0.01%)#1,822 |
| 41. | Northampton | 54 | 17,613(0.31%)#41 | 1,034,299(0.01%)#1,843 |
| 42. | Belchertown | 44 | 17,613(0.25%)#42 | 1,034,299(0.00%)#2,078 |
| 43. | Amesbury Town | 40 | 17,613(0.23%)#43 | 1,034,299(0.00%)#2,174 |
| 44. | Weymouth Town | 38 | 17,613(0.22%)#44 | 1,034,299(0.00%)#2,216 |
| 45. | Brockton | 34 | 17,613(0.19%)#45 | 1,034,299(0.00%)#2,340 |
| 46. | Cochituate | 34 | 17,613(0.19%)#46 | 1,034,299(0.00%)#2,369 |
| 47. | Methuen Town | 33 | 17,613(0.19%)#47 | 1,034,299(0.00%)#2,385 |
| 48. | Marlborough | 31 | 17,613(0.18%)#48 | 1,034,299(0.00%)#2,464 |
| 49. | Melrose | 31 | 17,613(0.18%)#49 | 1,034,299(0.00%)#2,469 |
| 50. | New Bedford | 30 | 17,613(0.17%)#50 | 1,034,299(0.00%)#2,503 |
| 51. | Lunenburg | 28 | 17,613(0.16%)#51 | 1,034,299(0.00%)#2,640 |
| 52. | Pepperell | 27 | 17,613(0.15%)#52 | 1,034,299(0.00%)#2,685 |
| 53. | Springfield | 26 | 17,613(0.15%)#53 | 1,034,299(0.00%)#2,688 |
| 54. | Danvers | 26 | 17,613(0.15%)#54 | 1,034,299(0.00%)#2,700 |
| 55. | West Concord | 26 | 17,613(0.15%)#55 | 1,034,299(0.00%)#2,726 |
| 56. | Longmeadow | 25 | 17,613(0.14%)#56 | 1,034,299(0.00%)#2,759 |
| 57. | Dover | 25 | 17,613(0.14%)#57 | 1,034,299(0.00%)#2,785 |
| 58. | Chelsea | 24 | 17,613(0.14%)#58 | 1,034,299(0.00%)#2,794 |
| 59. | Milton | 23 | 17,613(0.13%)#59 | 1,034,299(0.00%)#2,855 |
| 60. | Westfield | 22 | 17,613(0.12%)#60 | 1,034,299(0.00%)#2,905 |
| 61. | Wakefield | 22 | 17,613(0.12%)#61 | 1,034,299(0.00%)#2,909 |
| 62. | Northborough | 21 | 17,613(0.12%)#62 | 1,034,299(0.00%)#3,011 |
| 63. | Salem | 20 | 17,613(0.11%)#63 | 1,034,299(0.00%)#3,036 |
| 64. | Pittsfield | 20 | 17,613(0.11%)#64 | 1,034,299(0.00%)#3,037 |
| 65. | Holyoke | 20 | 17,613(0.11%)#65 | 1,034,299(0.00%)#3,038 |
| 66. | Williamstown | 19 | 17,613(0.11%)#66 | 1,034,299(0.00%)#3,155 |
| 67. | West Springfield Town | 17 | 17,613(0.10%)#67 | 1,034,299(0.00%)#3,258 |
| 68. | Winthrop Town | 17 | 17,613(0.10%)#68 | 1,034,299(0.00%)#3,264 |
| 69. | Fitchburg | 16 | 17,613(0.09%)#69 | 1,034,299(0.00%)#3,327 |
| 70. | Attleboro | 15 | 17,613(0.09%)#70 | 1,034,299(0.00%)#3,411 |
| 71. | Ayer | 15 | 17,613(0.09%)#71 | 1,034,299(0.00%)#3,470 |
| 72. | Lynnfield | 14 | 17,613(0.08%)#72 | 1,034,299(0.00%)#3,523 |
| 73. | Swampscott | 13 | 17,613(0.07%)#73 | 1,034,299(0.00%)#3,622 |
| 74. | Taunton | 12 | 17,613(0.07%)#74 | 1,034,299(0.00%)#3,699 |
| 75. | Bridgewater Town | 12 | 17,613(0.07%)#75 | 1,034,299(0.00%)#3,709 |
| 76. | Dedham | 12 | 17,613(0.07%)#76 | 1,034,299(0.00%)#3,713 |
| 77. | Ocean Grove | 12 | 17,613(0.07%)#77 | 1,034,299(0.00%)#3,801 |
| 78. | Newburyport | 11 | 17,613(0.06%)#78 | 1,034,299(0.00%)#3,847 |
| 79. | Rowley | 10 | 17,613(0.06%)#79 | 1,034,299(0.00%)#4,029 |
| 80. | North Adams | 9 | 17,613(0.05%)#80 | 1,034,299(0.00%)#4,082 |
| 81. | Pinehurst | 9 | 17,613(0.05%)#81 | 1,034,299(0.00%)#4,113 |
| 82. | Nahant | 8 | 17,613(0.05%)#82 | 1,034,299(0.00%)#4,258 |
| 83. | Somerset | 7 | 17,613(0.04%)#83 | 1,034,299(0.00%)#4,325 |
| 84. | Fall River | 6 | 17,613(0.03%)#84 | 1,034,299(0.00%)#4,437 |
| 85. | Devens | 5 | 17,613(0.03%)#85 | 1,034,299(0.00%)#4,671 |
| 86. | Shelburne Falls | 4 | 17,613(0.02%)#86 | 1,034,299(0.00%)#4,804 |
| 87. | Marshfield | 1 | 17,613(0.01%)#87 | 1,034,299(0.00%)#5,238 |
Common Questions
What are the Top 10 Cities with the Most Immigrants from Korea in Massachusetts?
Top 10 Cities with the Most Immigrants from Korea in Massachusetts are:
What city has the Most Immigrants from Korea in Massachusetts?
Boston has the Most Immigrants from Korea in Massachusetts with 2,406.
What is the Total Immigrants from Korea in the State of Massachusetts?
Total Immigrants from Korea in Massachusetts is 17,613.
What is the Total Immigrants from Korea in the United States?
Total Immigrants from Korea in the United States is 1,034,299.