East Brookfield, MA
East Brookfield Map
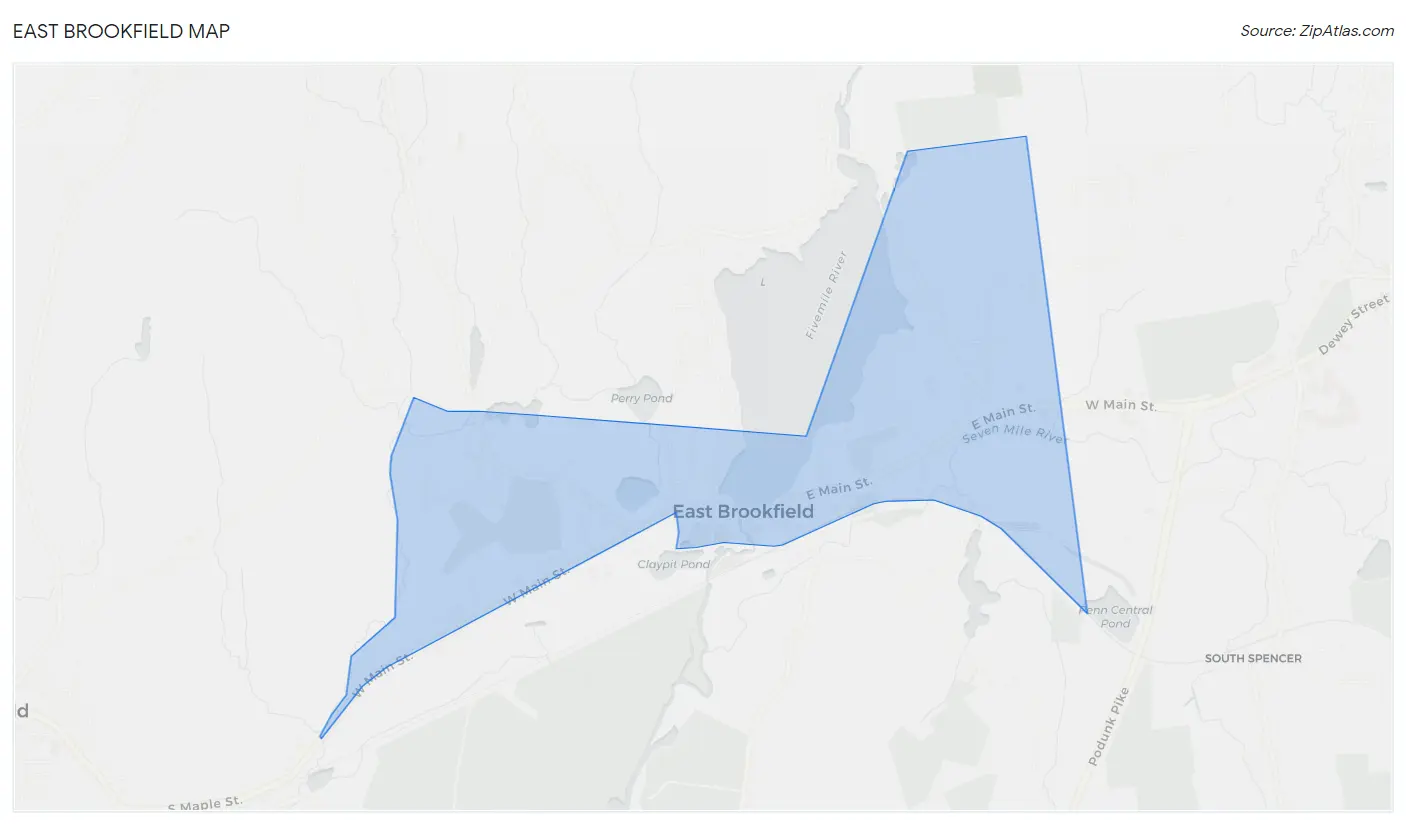
East Brookfield Overview
1,345
TOTAL POPULATION
711
MALE POPULATION
634
FEMALE POPULATION
112.15
MALES / 100 FEMALES
89.17
FEMALES / 100 MALES
58.1
MEDIAN AGE
2.6
AVG FAMILY SIZE
2.4
AVG HOUSEHOLD SIZE
$44,055
PER CAPITA INCOME
$97,750
AVG FAMILY INCOME
$76,406
AVG HOUSEHOLD INCOME
4.4%
WAGE / INCOME GAP [ % ]
95.6¢/ $1
WAGE / INCOME GAP [ $ ]
0.35
INEQUALITY / GINI INDEX
750
LABOR FORCE [ PEOPLE ]
63.9%
PERCENT IN LABOR FORCE
1.3%
UNEMPLOYMENT RATE
East Brookfield Zip Codes
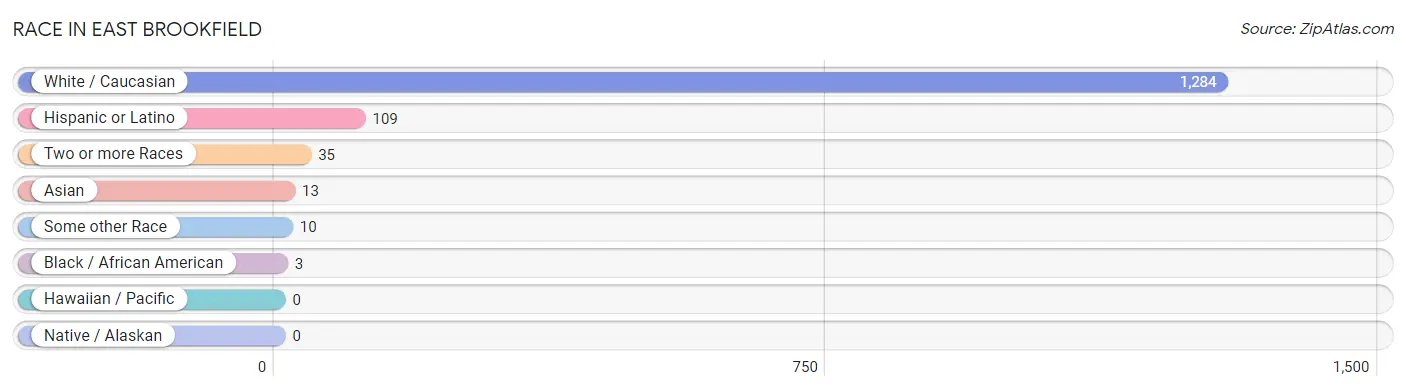
Race in East Brookfield
The most populous races in East Brookfield are White / Caucasian (1,284 | 95.5%), Hispanic or Latino (109 | 8.1%), and Two or more Races (35 | 2.6%).
| Race | # Population | % Population |
| Asian | 13 | 1.0% |
| Black / African American | 3 | 0.2% |
| Hawaiian / Pacific | 0 | 0.0% |
| Hispanic or Latino | 109 | 8.1% |
| Native / Alaskan | 0 | 0.0% |
| White / Caucasian | 1,284 | 95.5% |
| Two or more Races | 35 | 2.6% |
| Some other Race | 10 | 0.7% |
| Total | 1,345 | 100.0% |
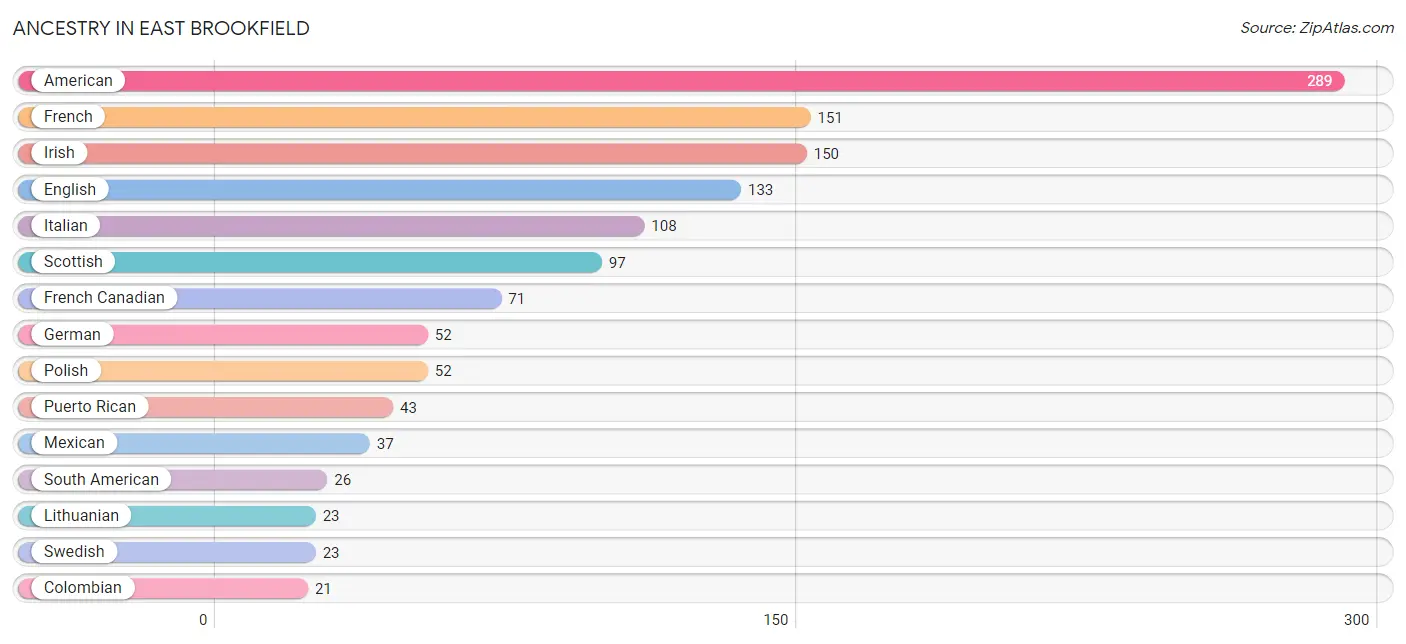
Ancestry in East Brookfield
The most populous ancestries reported in East Brookfield are American (289 | 21.5%), French (151 | 11.2%), Irish (150 | 11.2%), English (133 | 9.9%), and Italian (108 | 8.0%), together accounting for 61.8% of all East Brookfield residents.
| Ancestry | # Population | % Population |
| African | 3 | 0.2% |
| American | 289 | 21.5% |
| Central American | 3 | 0.2% |
| Colombian | 21 | 1.6% |
| Dutch | 3 | 0.2% |
| Ecuadorian | 5 | 0.4% |
| English | 133 | 9.9% |
| Finnish | 17 | 1.3% |
| French | 151 | 11.2% |
| French Canadian | 71 | 5.3% |
| German | 52 | 3.9% |
| Ghanaian | 6 | 0.4% |
| Guatemalan | 3 | 0.2% |
| Indian (Asian) | 13 | 1.0% |
| Irish | 150 | 11.2% |
| Italian | 108 | 8.0% |
| Lithuanian | 23 | 1.7% |
| Mexican | 37 | 2.8% |
| Northern European | 1 | 0.1% |
| Norwegian | 9 | 0.7% |
| Polish | 52 | 3.9% |
| Portuguese | 16 | 1.2% |
| Puerto Rican | 43 | 3.2% |
| Russian | 14 | 1.0% |
| Scotch-Irish | 3 | 0.2% |
| Scottish | 97 | 7.2% |
| South American | 26 | 1.9% |
| Subsaharan African | 6 | 0.4% |
| Swedish | 23 | 1.7% | View All 29 Rows |
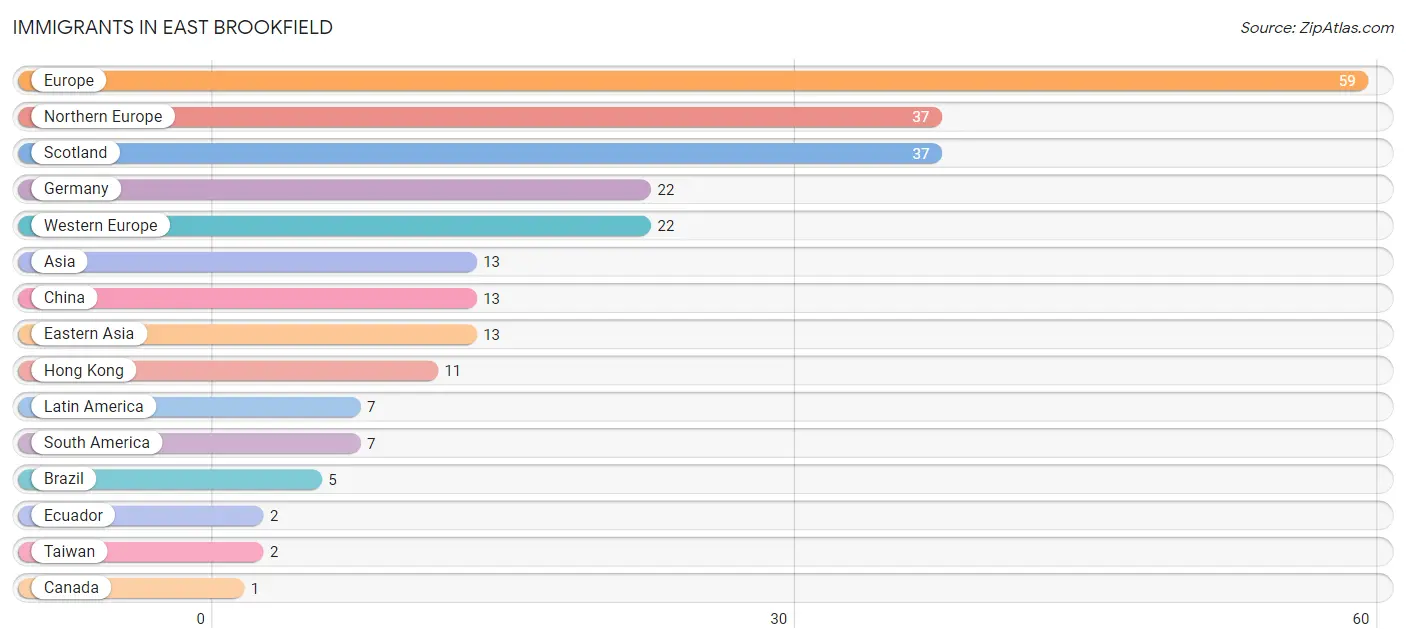
Immigrants in East Brookfield
The most numerous immigrant groups reported in East Brookfield came from Europe (59 | 4.4%), Northern Europe (37 | 2.8%), Scotland (37 | 2.8%), Germany (22 | 1.6%), and Western Europe (22 | 1.6%), together accounting for 13.2% of all East Brookfield residents.
| Immigration Origin | # Population | % Population |
| Asia | 13 | 1.0% |
| Brazil | 5 | 0.4% |
| Canada | 1 | 0.1% |
| China | 13 | 1.0% |
| Eastern Asia | 13 | 1.0% |
| Ecuador | 2 | 0.2% |
| Europe | 59 | 4.4% |
| Germany | 22 | 1.6% |
| Hong Kong | 11 | 0.8% |
| Latin America | 7 | 0.5% |
| Northern Europe | 37 | 2.8% |
| Scotland | 37 | 2.8% |
| South America | 7 | 0.5% |
| Taiwan | 2 | 0.2% |
| Western Europe | 22 | 1.6% | View All 15 Rows |
Sex and Age in East Brookfield
Sex and Age in East Brookfield
The most populous age groups in East Brookfield are 60 to 64 Years (116 | 16.3%) for men and 60 to 64 Years (76 | 12.0%) for women.
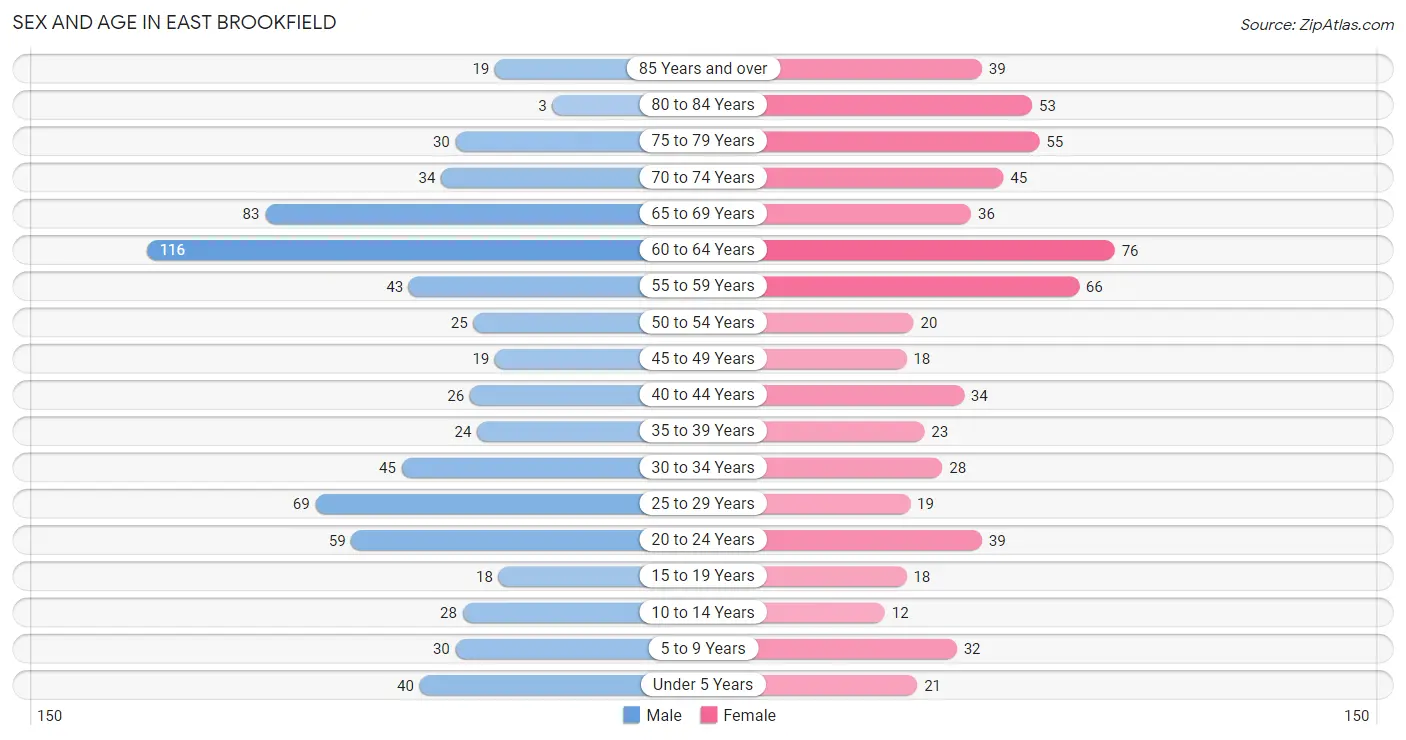
| Age Bracket | Male | Female |
| Under 5 Years | 40 (5.6%) | 21 (3.3%) |
| 5 to 9 Years | 30 (4.2%) | 32 (5.1%) |
| 10 to 14 Years | 28 (3.9%) | 12 (1.9%) |
| 15 to 19 Years | 18 (2.5%) | 18 (2.8%) |
| 20 to 24 Years | 59 (8.3%) | 39 (6.1%) |
| 25 to 29 Years | 69 (9.7%) | 19 (3.0%) |
| 30 to 34 Years | 45 (6.3%) | 28 (4.4%) |
| 35 to 39 Years | 24 (3.4%) | 23 (3.6%) |
| 40 to 44 Years | 26 (3.7%) | 34 (5.4%) |
| 45 to 49 Years | 19 (2.7%) | 18 (2.8%) |
| 50 to 54 Years | 25 (3.5%) | 20 (3.2%) |
| 55 to 59 Years | 43 (6.0%) | 66 (10.4%) |
| 60 to 64 Years | 116 (16.3%) | 76 (12.0%) |
| 65 to 69 Years | 83 (11.7%) | 36 (5.7%) |
| 70 to 74 Years | 34 (4.8%) | 45 (7.1%) |
| 75 to 79 Years | 30 (4.2%) | 55 (8.7%) |
| 80 to 84 Years | 3 (0.4%) | 53 (8.4%) |
| 85 Years and over | 19 (2.7%) | 39 (6.1%) |
| Total | 711 (100.0%) | 634 (100.0%) |
Families and Households in East Brookfield
Median Family Size in East Brookfield
The median family size in East Brookfield is 2.64 persons per family, with married-couple families (295 | 70.2%) accounting for the largest median family size of 2.82 persons per family. On the other hand, single male/father families (90 | 21.4%) represent the smallest median family size with 2.04 persons per family.
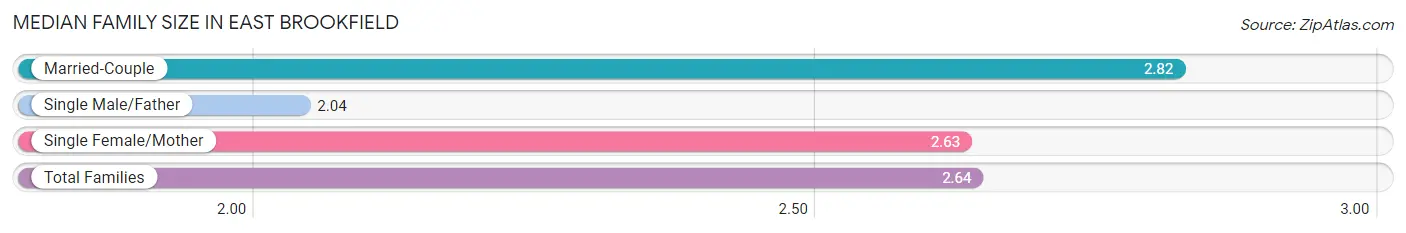
| Family Type | # Families | Family Size |
| Married-Couple | 295 (70.2%) | 2.82 |
| Single Male/Father | 90 (21.4%) | 2.04 |
| Single Female/Mother | 35 (8.3%) | 2.63 |
| Total Families | 420 (100.0%) | 2.64 |
Median Household Size in East Brookfield
The median household size in East Brookfield is 2.39 persons per household, with single female/mother households (35 | 6.2%) accounting for the largest median household size of 2.89 persons per household. non-family households (142 | 25.3%) represent the smallest median household size with 1.51 persons per household.
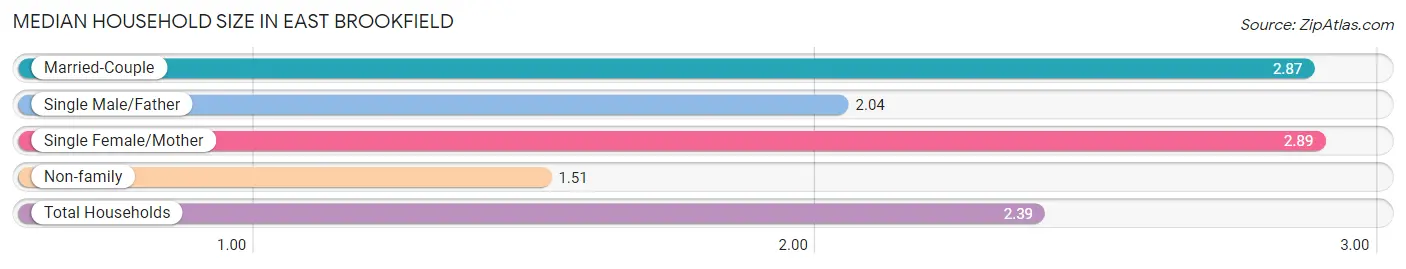
| Household Type | # Households | Household Size |
| Married-Couple | 295 (52.5%) | 2.87 |
| Single Male/Father | 90 (16.0%) | 2.04 |
| Single Female/Mother | 35 (6.2%) | 2.89 |
| Non-family | 142 (25.3%) | 1.51 |
| Total Households | 562 (100.0%) | 2.39 |
Household Size by Marriage Status in East Brookfield
Out of a total of 562 households in East Brookfield, 420 (74.7%) are family households, while 142 (25.3%) are nonfamily households. The most numerous type of family households are 2-person households, comprising 262, and the most common type of nonfamily households are 1-person households, comprising 94.
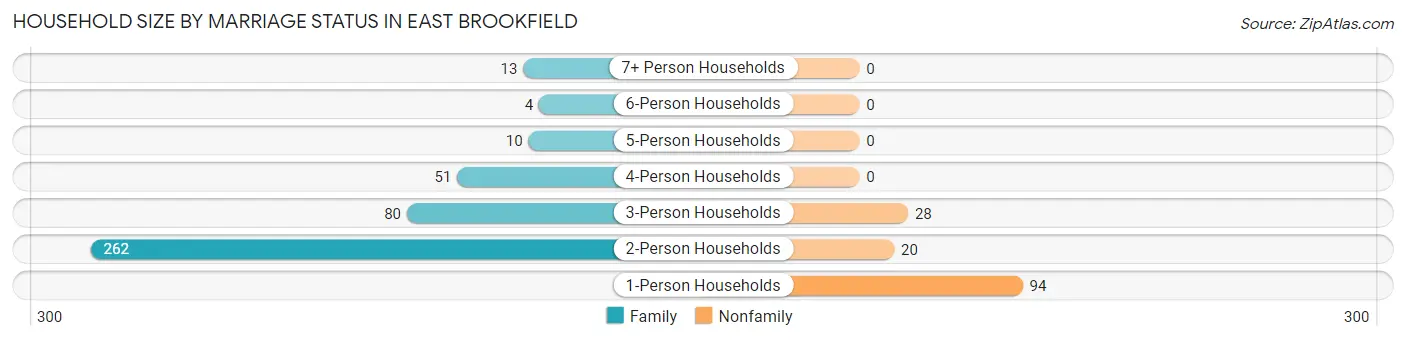
| Household Size | Family Households | Nonfamily Households |
| 1-Person Households | - | 94 (16.7%) |
| 2-Person Households | 262 (46.6%) | 20 (3.6%) |
| 3-Person Households | 80 (14.2%) | 28 (5.0%) |
| 4-Person Households | 51 (9.1%) | 0 (0.0%) |
| 5-Person Households | 10 (1.8%) | 0 (0.0%) |
| 6-Person Households | 4 (0.7%) | 0 (0.0%) |
| 7+ Person Households | 13 (2.3%) | 0 (0.0%) |
| Total | 420 (74.7%) | 142 (25.3%) |
Female Fertility in East Brookfield
Fertility by Age in East Brookfield
Average fertility rate in East Brookfield is 61.0 births per 1,000 women. Women in the age bracket of 20 to 34 years have the highest fertility rate with 128.0 births per 1,000 women. Women in the age bracket of 20 to 34 years acount for 100.0% of all women with births.
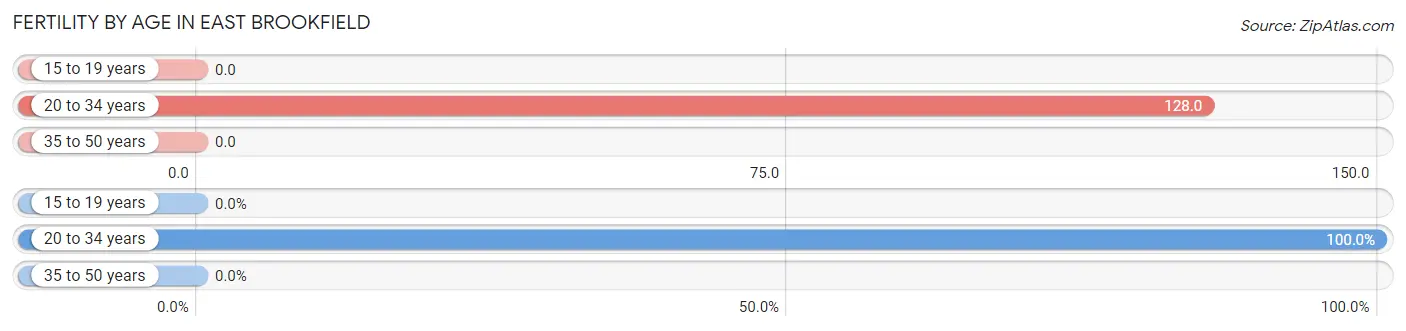
| Age Bracket | Women with Births | Births / 1,000 Women |
| 15 to 19 years | 0 (0.0%) | 0.0 |
| 20 to 34 years | 11 (100.0%) | 128.0 |
| 35 to 50 years | 0 (0.0%) | 0.0 |
| Total | 11 (100.0%) | 61.0 |
Fertility by Age by Marriage Status in East Brookfield
45.5% of women with births (11) in East Brookfield are married. The highest percentage of unmarried women with births falls into 20 to 34 years age bracket with 54.5% of them unmarried at the time of birth, while the lowest percentage of unmarried women with births belong to 20 to 34 years age bracket with 54.5% of them unmarried.
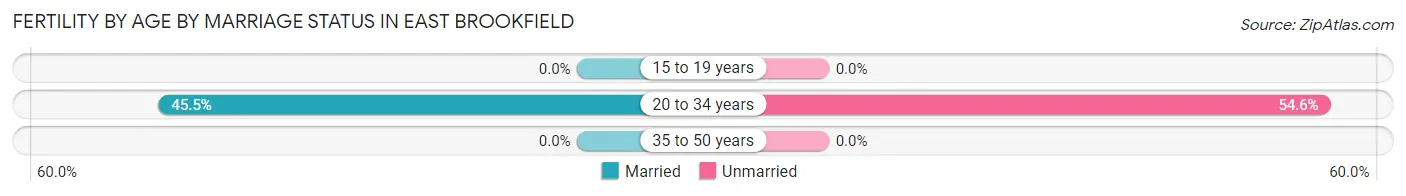
| Age Bracket | Married | Unmarried |
| 15 to 19 years | 0 (0.0%) | 0 (0.0%) |
| 20 to 34 years | 5 (45.5%) | 6 (54.5%) |
| 35 to 50 years | 0 (0.0%) | 0 (0.0%) |
| Total | 5 (45.5%) | 6 (54.5%) |
Fertility by Education in East Brookfield
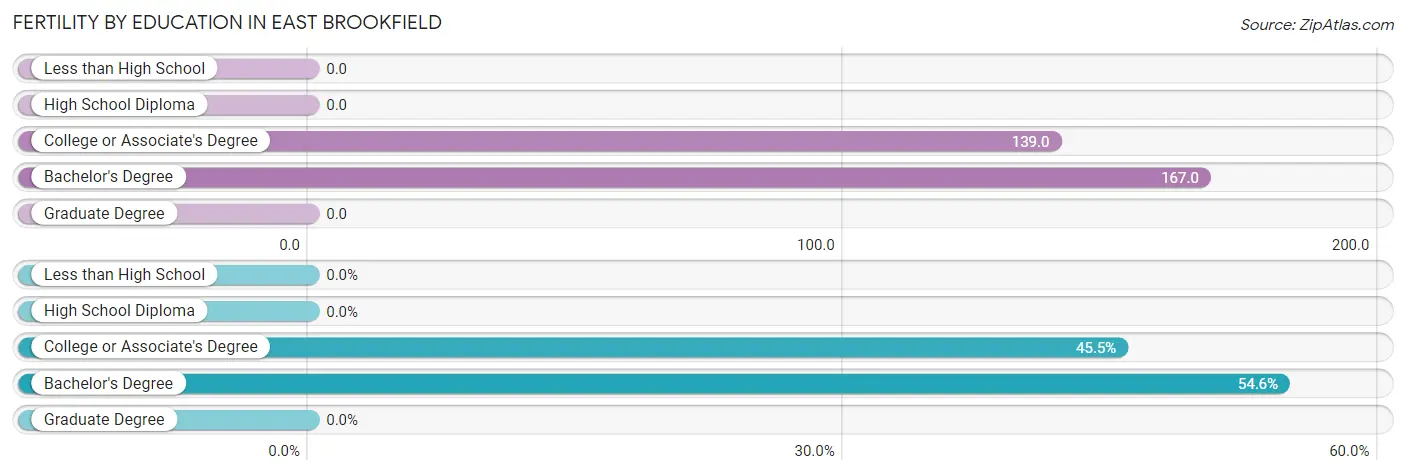
| Educational Attainment | Women with Births | Births / 1,000 Women |
| Less than High School | 0 (0.0%) | 0.0 |
| High School Diploma | 0 (0.0%) | 0.0 |
| College or Associate's Degree | 5 (45.5%) | 139.0 |
| Bachelor's Degree | 6 (54.5%) | 167.0 |
| Graduate Degree | 0 (0.0%) | 0.0 |
| Total | 11 (100.0%) | 61.0 |
Fertility by Education by Marriage Status in East Brookfield
54.5% of women with births in East Brookfield are unmarried. Women with the educational attainment of college or associate's degree are most likely to be married with 100.0% of them married at childbirth, while women with the educational attainment of bachelor's degree are least likely to be married with 100.0% of them unmarried at childbirth.
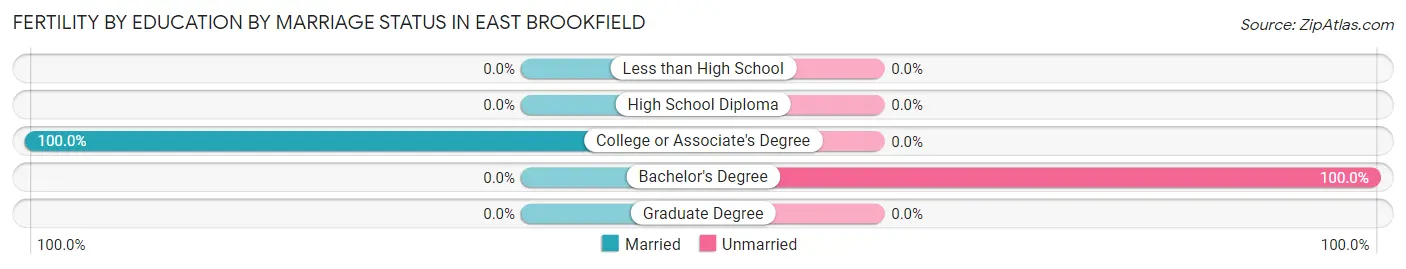
| Educational Attainment | Married | Unmarried |
| Less than High School | 0 (0.0%) | 0 (0.0%) |
| High School Diploma | 0 (0.0%) | 0 (0.0%) |
| College or Associate's Degree | 5 (100.0%) | 0 (0.0%) |
| Bachelor's Degree | 0 (0.0%) | 6 (100.0%) |
| Graduate Degree | 0 (0.0%) | 0 (0.0%) |
| Total | 5 (45.5%) | 6 (54.5%) |
Income in East Brookfield
Income Overview in East Brookfield
Per Capita Income in East Brookfield is $44,055, while median incomes of families and households are $97,750 and $76,406 respectively.
| Characteristic | Number | Measure |
| Per Capita Income | 1,345 | $44,055 |
| Median Family Income | 420 | $97,750 |
| Mean Family Income | 420 | $117,937 |
| Median Household Income | 562 | $76,406 |
| Mean Household Income | 562 | $106,808 |
| Income Deficit | 420 | $0 |
| Wage / Income Gap (%) | 1,345 | 4.41% |
| Wage / Income Gap ($) | 1,345 | 95.59¢ per $1 |
| Gini / Inequality Index | 1,345 | 0.35 |
Earnings by Sex in East Brookfield
Average Earnings in East Brookfield are $51,621, $51,377 for men and $53,750 for women, a difference of 4.4%.
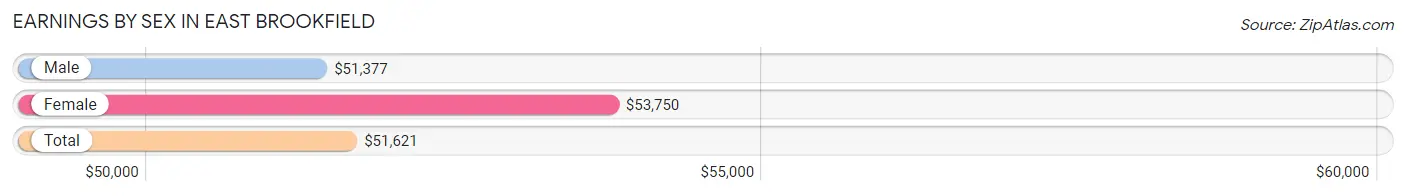
| Sex | Number | Average Earnings |
| Male | 453 (59.1%) | $51,377 |
| Female | 313 (40.9%) | $53,750 |
| Total | 766 (100.0%) | $51,621 |
Earnings by Sex by Income Bracket in East Brookfield
The most common earnings brackets in East Brookfield are $50,000 to $54,999 for men (79 | 17.4%) and $55,000 to $64,999 for women (71 | 22.7%).
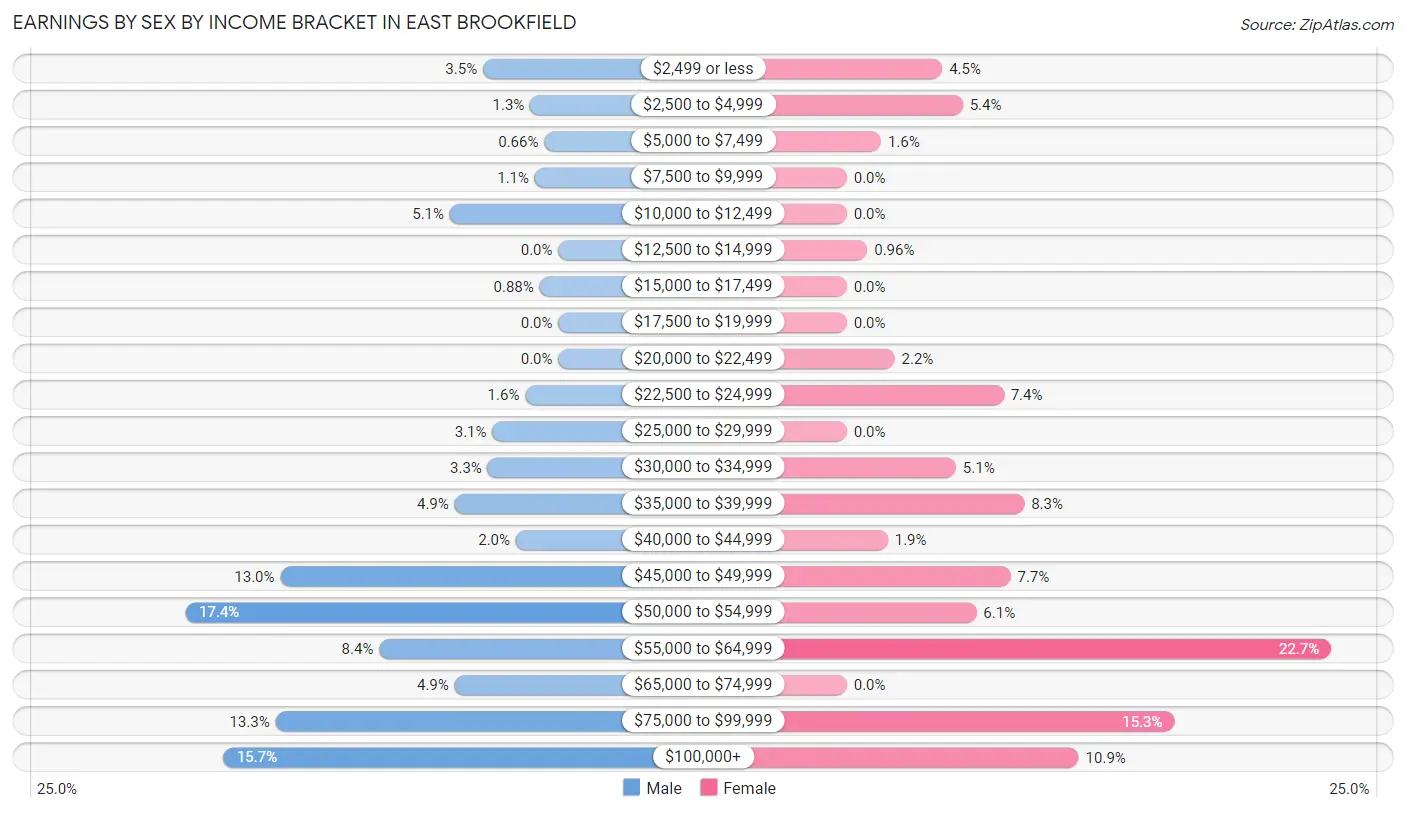
| Income | Male | Female |
| $2,499 or less | 16 (3.5%) | 14 (4.5%) |
| $2,500 to $4,999 | 6 (1.3%) | 17 (5.4%) |
| $5,000 to $7,499 | 3 (0.7%) | 5 (1.6%) |
| $7,500 to $9,999 | 5 (1.1%) | 0 (0.0%) |
| $10,000 to $12,499 | 23 (5.1%) | 0 (0.0%) |
| $12,500 to $14,999 | 0 (0.0%) | 3 (1.0%) |
| $15,000 to $17,499 | 4 (0.9%) | 0 (0.0%) |
| $17,500 to $19,999 | 0 (0.0%) | 0 (0.0%) |
| $20,000 to $22,499 | 0 (0.0%) | 7 (2.2%) |
| $22,500 to $24,999 | 7 (1.5%) | 23 (7.3%) |
| $25,000 to $29,999 | 14 (3.1%) | 0 (0.0%) |
| $30,000 to $34,999 | 15 (3.3%) | 16 (5.1%) |
| $35,000 to $39,999 | 22 (4.9%) | 26 (8.3%) |
| $40,000 to $44,999 | 9 (2.0%) | 6 (1.9%) |
| $45,000 to $49,999 | 59 (13.0%) | 24 (7.7%) |
| $50,000 to $54,999 | 79 (17.4%) | 19 (6.1%) |
| $55,000 to $64,999 | 38 (8.4%) | 71 (22.7%) |
| $65,000 to $74,999 | 22 (4.9%) | 0 (0.0%) |
| $75,000 to $99,999 | 60 (13.3%) | 48 (15.3%) |
| $100,000+ | 71 (15.7%) | 34 (10.9%) |
| Total | 453 (100.0%) | 313 (100.0%) |
Earnings by Sex by Educational Attainment in East Brookfield
Average earnings in East Brookfield are $52,389 for men and $57,368 for women, a difference of 8.7%. Men with an educational attainment of graduate degree enjoy the highest average annual earnings of $91,458, while those with college or associate's degree education earn the least with $38,750. Women with an educational attainment of graduate degree earn the most with the average annual earnings of $100,500, while those with high school diploma education have the smallest earnings of $39,118.
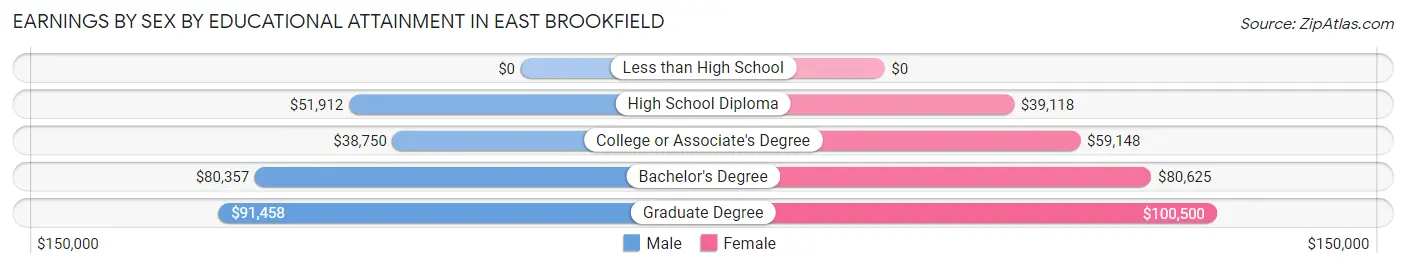
| Educational Attainment | Male Income | Female Income |
| Less than High School | - | - |
| High School Diploma | $51,912 | $39,118 |
| College or Associate's Degree | $38,750 | $59,148 |
| Bachelor's Degree | $80,357 | $80,625 |
| Graduate Degree | $91,458 | $100,500 |
| Total | $52,389 | $57,368 |
Family Income in East Brookfield
Family Income Brackets in East Brookfield
According to the East Brookfield family income data, there are 120 families falling into the $50,000 to $74,999 income range, which is the most common income bracket and makes up 28.6% of all families.
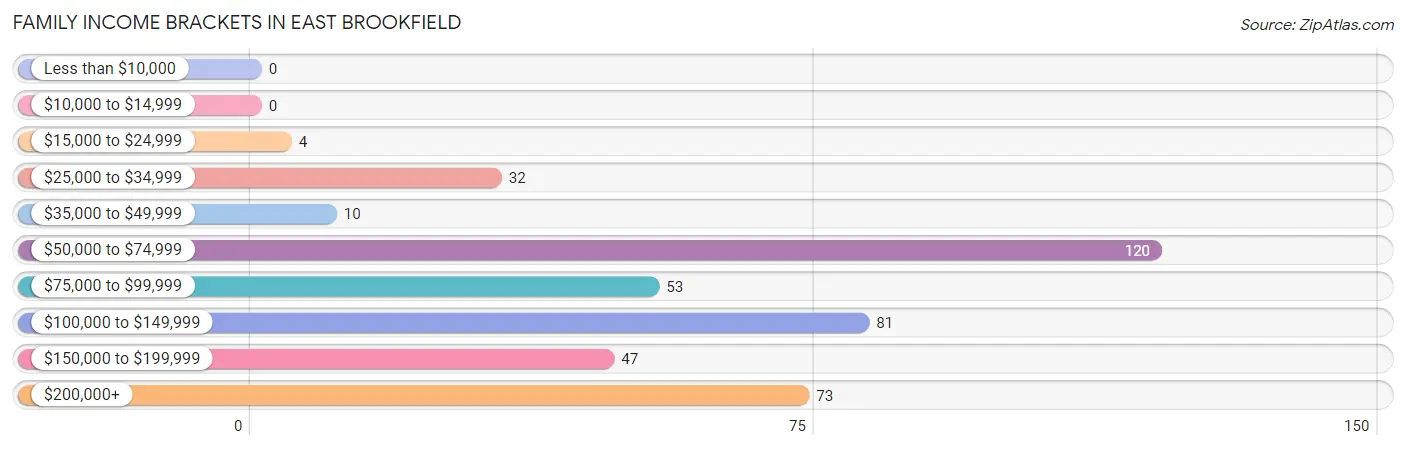
| Income Bracket | # Families | % Families |
| Less than $10,000 | 0 | 0.0% |
| $10,000 to $14,999 | 0 | 0.0% |
| $15,000 to $24,999 | 4 | 1.0% |
| $25,000 to $34,999 | 32 | 7.6% |
| $35,000 to $49,999 | 10 | 2.4% |
| $50,000 to $74,999 | 120 | 28.6% |
| $75,000 to $99,999 | 53 | 12.6% |
| $100,000 to $149,999 | 81 | 19.3% |
| $150,000 to $199,999 | 47 | 11.2% |
| $200,000+ | 73 | 17.4% |
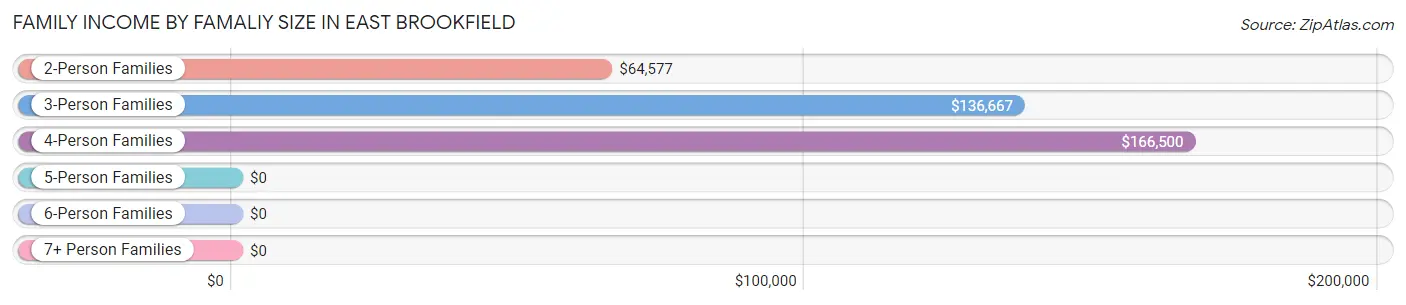
Family Income by Famaliy Size in East Brookfield
4-person families (36 | 8.6%) account for the highest median family income in East Brookfield with $166,500 per family, while 3-person families (92 | 21.9%) have the highest median income of $45,556 per family member.
| Income Bracket | # Families | Median Income |
| 2-Person Families | 265 (63.1%) | $64,577 |
| 3-Person Families | 92 (21.9%) | $136,667 |
| 4-Person Families | 36 (8.6%) | $166,500 |
| 5-Person Families | 10 (2.4%) | $0 |
| 6-Person Families | 14 (3.3%) | $0 |
| 7+ Person Families | 3 (0.7%) | $0 |
| Total | 420 (100.0%) | $97,750 |
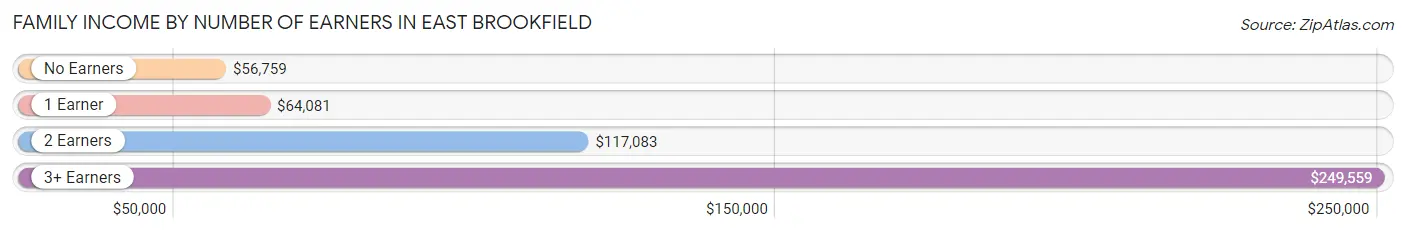
Family Income by Number of Earners in East Brookfield
The median family income in East Brookfield is $97,750, with families comprising 3+ earners (52) having the highest median family income of $249,559, while families with no earners (76) have the lowest median family income of $56,759, accounting for 12.4% and 18.1% of families, respectively.
| Number of Earners | # Families | Median Income |
| No Earners | 76 (18.1%) | $56,759 |
| 1 Earner | 120 (28.6%) | $64,081 |
| 2 Earners | 172 (40.9%) | $117,083 |
| 3+ Earners | 52 (12.4%) | $249,559 |
| Total | 420 (100.0%) | $97,750 |
Household Income in East Brookfield
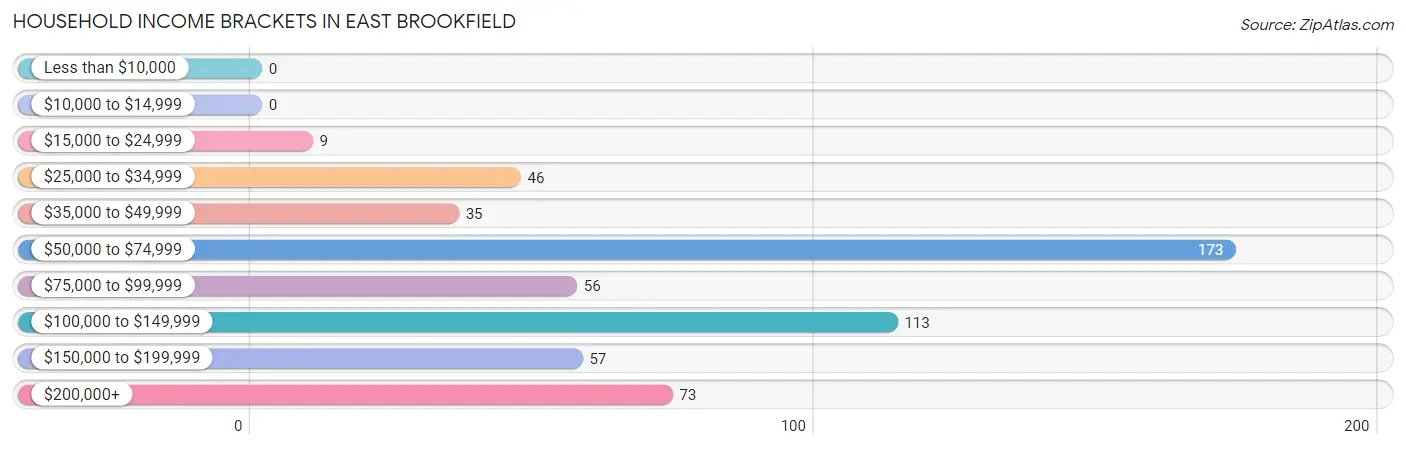
Household Income Brackets in East Brookfield
With 173 households falling in the category, the $50,000 to $74,999 income range is the most frequent in East Brookfield, accounting for 30.8% of all households.
| Income Bracket | # Households | % Households |
| Less than $10,000 | 0 | 0.0% |
| $10,000 to $14,999 | 0 | 0.0% |
| $15,000 to $24,999 | 9 | 1.6% |
| $25,000 to $34,999 | 46 | 8.2% |
| $35,000 to $49,999 | 35 | 6.2% |
| $50,000 to $74,999 | 173 | 30.8% |
| $75,000 to $99,999 | 56 | 10.0% |
| $100,000 to $149,999 | 113 | 20.1% |
| $150,000 to $199,999 | 57 | 10.1% |
| $200,000+ | 73 | 13.0% |
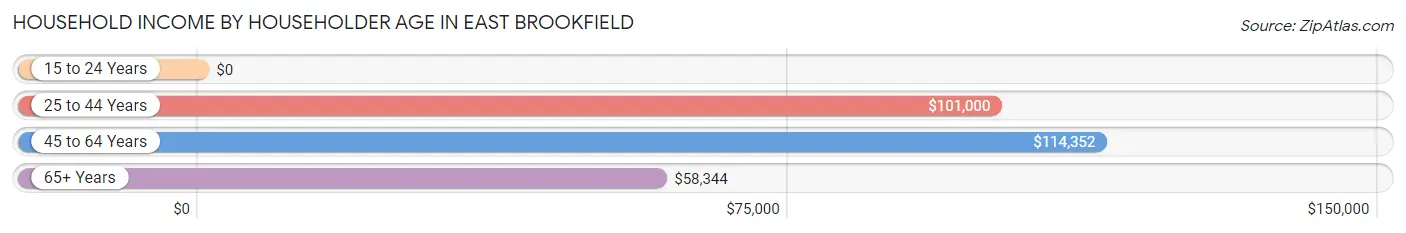
Household Income by Householder Age in East Brookfield
The median household income in East Brookfield is $76,406, with the highest median household income of $114,352 found in the 45 to 64 years age bracket for the primary householder. A total of 228 households (40.6%) fall into this category. Meanwhile, the 15 to 24 years age bracket for the primary householder has the lowest median household income of $0, with 25 households (4.4%) in this group.
| Income Bracket | # Households | Median Income |
| 15 to 24 Years | 25 (4.4%) | $0 |
| 25 to 44 Years | 102 (18.1%) | $101,000 |
| 45 to 64 Years | 228 (40.6%) | $114,352 |
| 65+ Years | 207 (36.8%) | $58,344 |
| Total | 562 (100.0%) | $76,406 |
Poverty in East Brookfield
Income Below Poverty by Sex and Age in East Brookfield
With 4.5% poverty level for males and 4.3% for females among the residents of East Brookfield, 5 year old males and 16 and 17 year old females are the most vulnerable to poverty, with 5 males (100.0%) and 9 females (60.0%) in their respective age groups living below the poverty level.
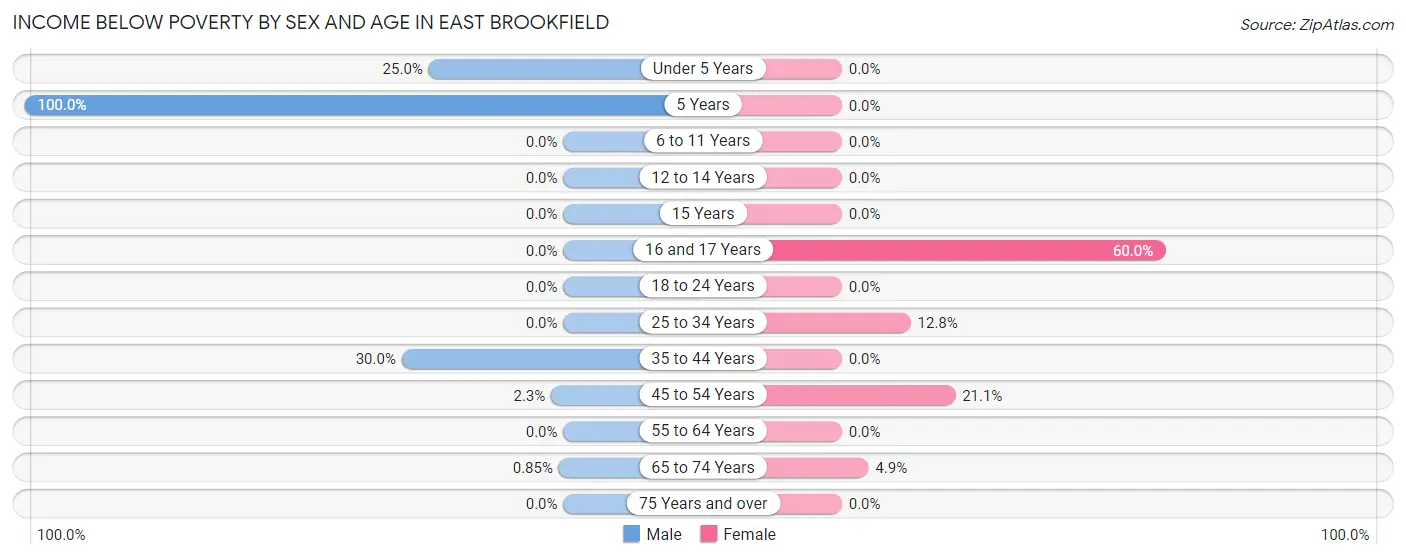
| Age Bracket | Male | Female |
| Under 5 Years | 10 (25.0%) | 0 (0.0%) |
| 5 Years | 5 (100.0%) | 0 (0.0%) |
| 6 to 11 Years | 0 (0.0%) | 0 (0.0%) |
| 12 to 14 Years | 0 (0.0%) | 0 (0.0%) |
| 15 Years | 0 (0.0%) | 0 (0.0%) |
| 16 and 17 Years | 0 (0.0%) | 9 (60.0%) |
| 18 to 24 Years | 0 (0.0%) | 0 (0.0%) |
| 25 to 34 Years | 0 (0.0%) | 6 (12.8%) |
| 35 to 44 Years | 15 (30.0%) | 0 (0.0%) |
| 45 to 54 Years | 1 (2.3%) | 8 (21.0%) |
| 55 to 64 Years | 0 (0.0%) | 0 (0.0%) |
| 65 to 74 Years | 1 (0.9%) | 4 (4.9%) |
| 75 Years and over | 0 (0.0%) | 0 (0.0%) |
| Total | 32 (4.5%) | 27 (4.3%) |
Income Above Poverty by Sex and Age in East Brookfield
According to the poverty statistics in East Brookfield, males aged 6 to 11 years and females aged under 5 years are the age groups that are most secure financially, with 100.0% of males and 100.0% of females in these age groups living above the poverty line.
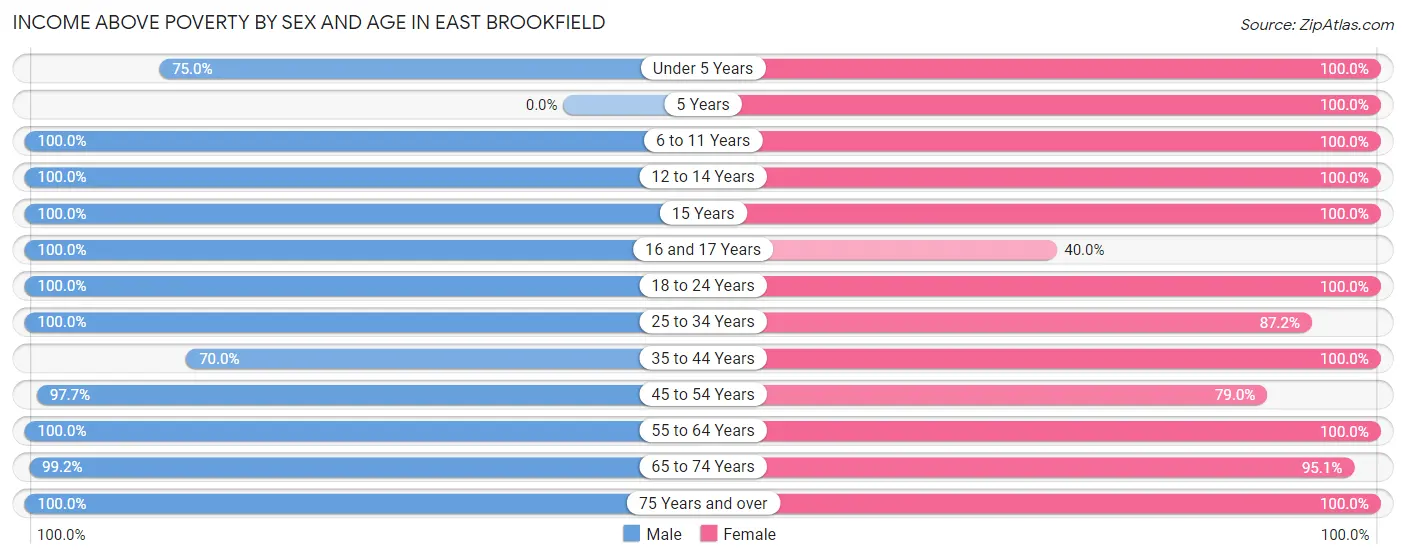
| Age Bracket | Male | Female |
| Under 5 Years | 30 (75.0%) | 21 (100.0%) |
| 5 Years | 0 (0.0%) | 6 (100.0%) |
| 6 to 11 Years | 42 (100.0%) | 26 (100.0%) |
| 12 to 14 Years | 11 (100.0%) | 9 (100.0%) |
| 15 Years | 5 (100.0%) | 3 (100.0%) |
| 16 and 17 Years | 3 (100.0%) | 6 (40.0%) |
| 18 to 24 Years | 69 (100.0%) | 39 (100.0%) |
| 25 to 34 Years | 114 (100.0%) | 41 (87.2%) |
| 35 to 44 Years | 35 (70.0%) | 57 (100.0%) |
| 45 to 54 Years | 43 (97.7%) | 30 (78.9%) |
| 55 to 64 Years | 159 (100.0%) | 142 (100.0%) |
| 65 to 74 Years | 116 (99.2%) | 77 (95.1%) |
| 75 Years and over | 52 (100.0%) | 147 (100.0%) |
| Total | 679 (95.5%) | 604 (95.7%) |
Income Below Poverty Among Married-Couple Families in East Brookfield
The poverty statistics for married-couple families in East Brookfield show that 2.0% or 6 of the total 295 families live below the poverty line. Families with 3 or 4 children have the highest poverty rate of 18.5%, comprising of 5 families. On the other hand, families with 1 or 2 children have the lowest poverty rate of 0.0%, which includes 0 families.
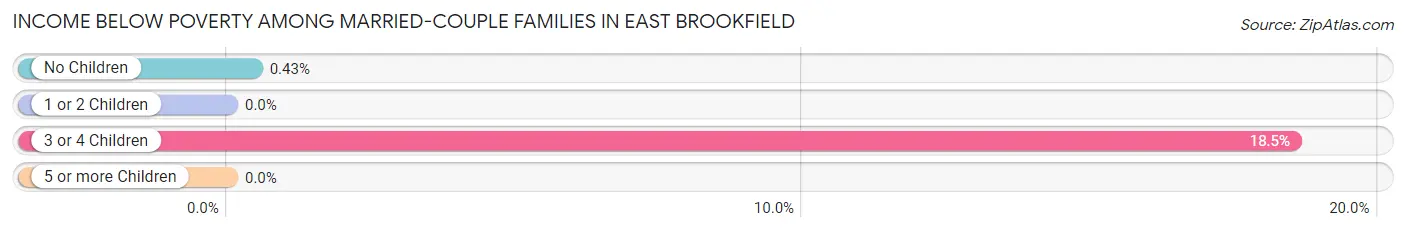
| Children | Above Poverty | Below Poverty |
| No Children | 229 (99.6%) | 1 (0.4%) |
| 1 or 2 Children | 38 (100.0%) | 0 (0.0%) |
| 3 or 4 Children | 22 (81.5%) | 5 (18.5%) |
| 5 or more Children | 0 (0.0%) | 0 (0.0%) |
| Total | 289 (98.0%) | 6 (2.0%) |
Income Below Poverty Among Single-Parent Households in East Brookfield
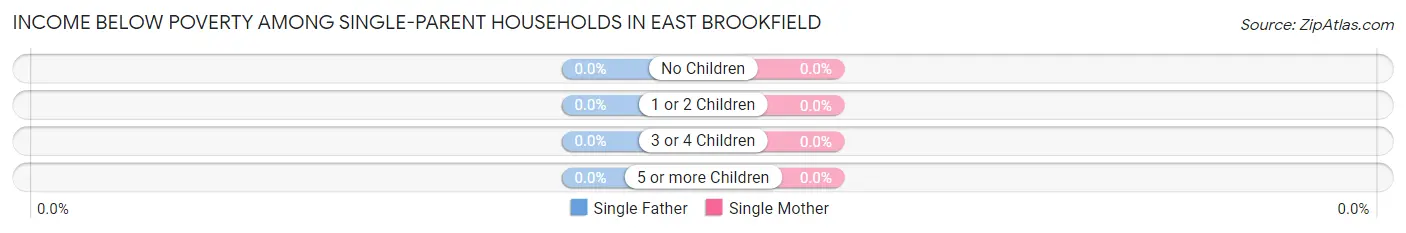
| Children | Single Father | Single Mother |
| No Children | 0 (0.0%) | 0 (0.0%) |
| 1 or 2 Children | 0 (0.0%) | 0 (0.0%) |
| 3 or 4 Children | 0 (0.0%) | 0 (0.0%) |
| 5 or more Children | 0 (0.0%) | 0 (0.0%) |
| Total | 0 (0.0%) | 0 (0.0%) |
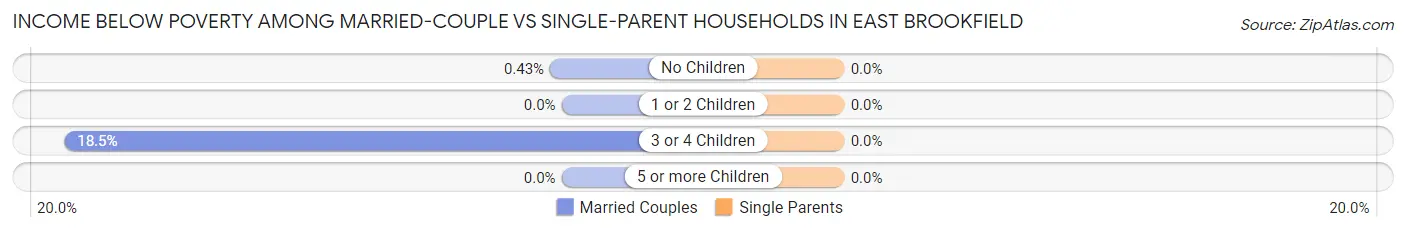
Income Below Poverty Among Married-Couple vs Single-Parent Households in East Brookfield
| Children | Married-Couple Families | Single-Parent Households |
| No Children | 1 (0.4%) | 0 (0.0%) |
| 1 or 2 Children | 0 (0.0%) | 0 (0.0%) |
| 3 or 4 Children | 5 (18.5%) | 0 (0.0%) |
| 5 or more Children | 0 (0.0%) | 0 (0.0%) |
| Total | 6 (2.0%) | 0 (0.0%) |
Employment Characteristics in East Brookfield
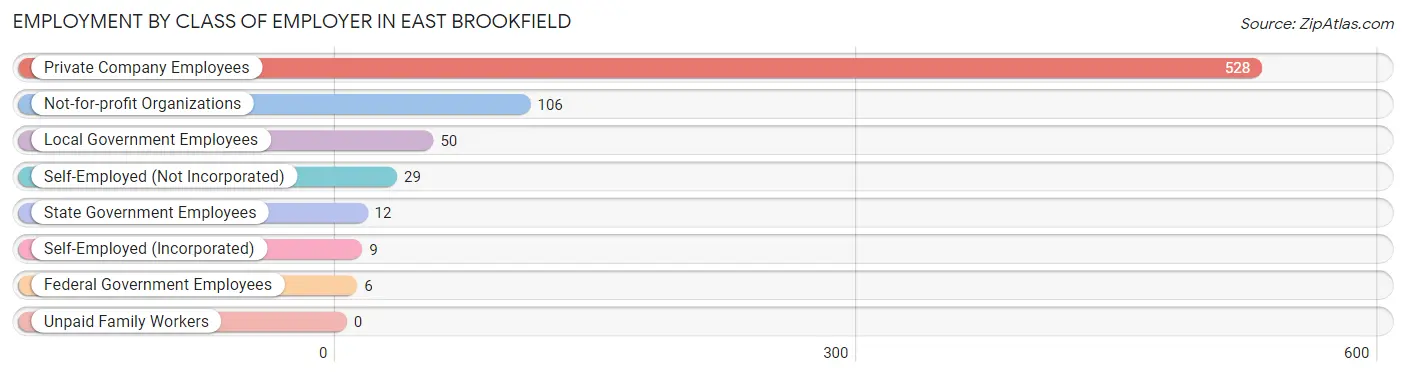
Employment by Class of Employer in East Brookfield
Among the 740 employed individuals in East Brookfield, private company employees (528 | 71.4%), not-for-profit organizations (106 | 14.3%), and local government employees (50 | 6.8%) make up the most common classes of employment.
| Employer Class | # Employees | % Employees |
| Private Company Employees | 528 | 71.4% |
| Self-Employed (Incorporated) | 9 | 1.2% |
| Self-Employed (Not Incorporated) | 29 | 3.9% |
| Not-for-profit Organizations | 106 | 14.3% |
| Local Government Employees | 50 | 6.8% |
| State Government Employees | 12 | 1.6% |
| Federal Government Employees | 6 | 0.8% |
| Unpaid Family Workers | 0 | 0.0% |
| Total | 740 | 100.0% |
Employment Status by Age in East Brookfield
According to the labor force statistics for East Brookfield, out of the total population over 16 years of age (1,174), 63.9% or 750 individuals are in the labor force, with 1.3% or 10 of them unemployed. The age group with the highest labor force participation rate is 35 to 44 years, with 100.0% or 107 individuals in the labor force. Within the labor force, the 35 to 44 years age range has the highest percentage of unemployed individuals, with 9.3% or 10 of them being unemployed.
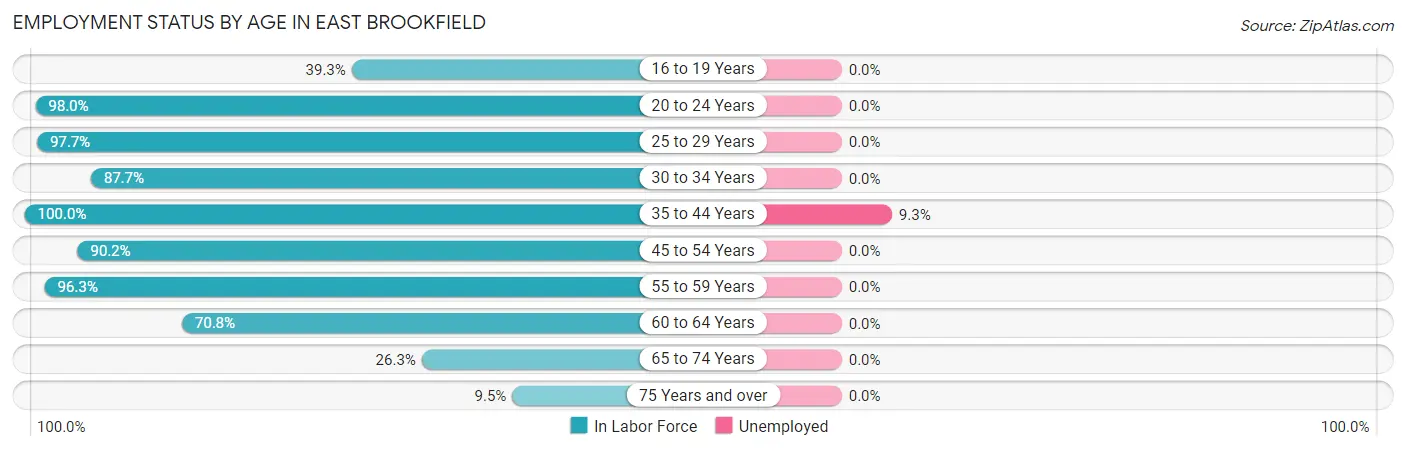
| Age Bracket | In Labor Force | Unemployed |
| 16 to 19 Years | 11 (39.3%) | 0 (0.0%) |
| 20 to 24 Years | 96 (98.0%) | 0 (0.0%) |
| 25 to 29 Years | 86 (97.7%) | 0 (0.0%) |
| 30 to 34 Years | 64 (87.7%) | 0 (0.0%) |
| 35 to 44 Years | 107 (100.0%) | 10 (9.3%) |
| 45 to 54 Years | 74 (90.2%) | 0 (0.0%) |
| 55 to 59 Years | 105 (96.3%) | 0 (0.0%) |
| 60 to 64 Years | 136 (70.8%) | 0 (0.0%) |
| 65 to 74 Years | 52 (26.3%) | 0 (0.0%) |
| 75 Years and over | 19 (9.5%) | 0 (0.0%) |
| Total | 750 (63.9%) | 10 (1.3%) |
Employment Status by Educational Attainment in East Brookfield
According to labor force statistics for East Brookfield, 87.9% of individuals (572) out of the total population between 25 and 64 years of age (651) are in the labor force, with 1.7% or 10 of them being unemployed. The group with the highest labor force participation rate are those with the educational attainment of less than high school, with 100.0% or 5 individuals in the labor force. Within the labor force, individuals with high school diploma education have the highest percentage of unemployment, with 4.7% or 10 of them being unemployed.
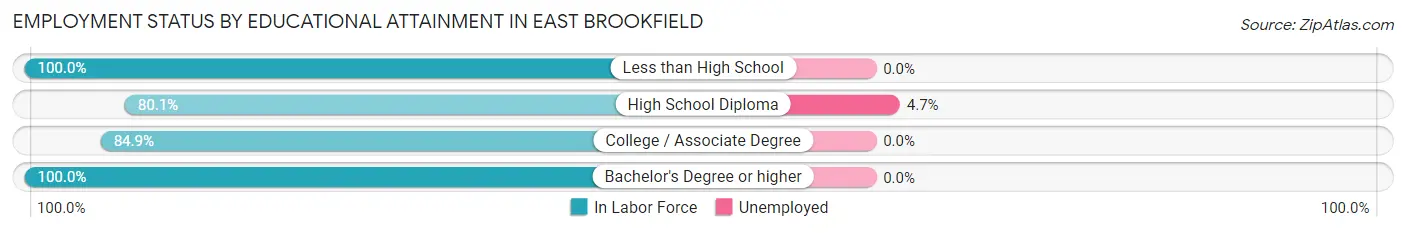
| Educational Attainment | In Labor Force | Unemployed |
| Less than High School | 5 (100.0%) | 0 (0.0%) |
| High School Diploma | 214 (80.1%) | 13 (4.7%) |
| College / Associate Degree | 146 (84.9%) | 0 (0.0%) |
| Bachelor's Degree or higher | 207 (100.0%) | 0 (0.0%) |
| Total | 572 (87.9%) | 11 (1.7%) |
Employment Occupations by Sex in East Brookfield
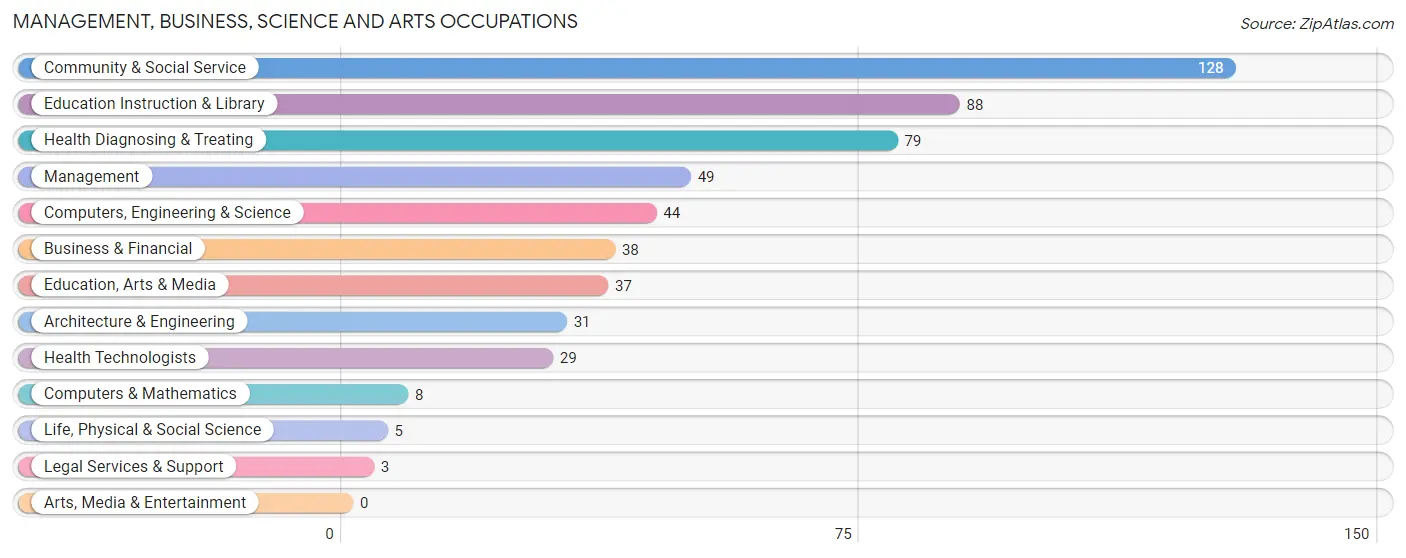
Management, Business, Science and Arts Occupations
The most common Management, Business, Science and Arts occupations in East Brookfield are Community & Social Service (128 | 17.3%), Education Instruction & Library (88 | 11.9%), Health Diagnosing & Treating (79 | 10.7%), Management (49 | 6.6%), and Computers, Engineering & Science (44 | 5.9%).
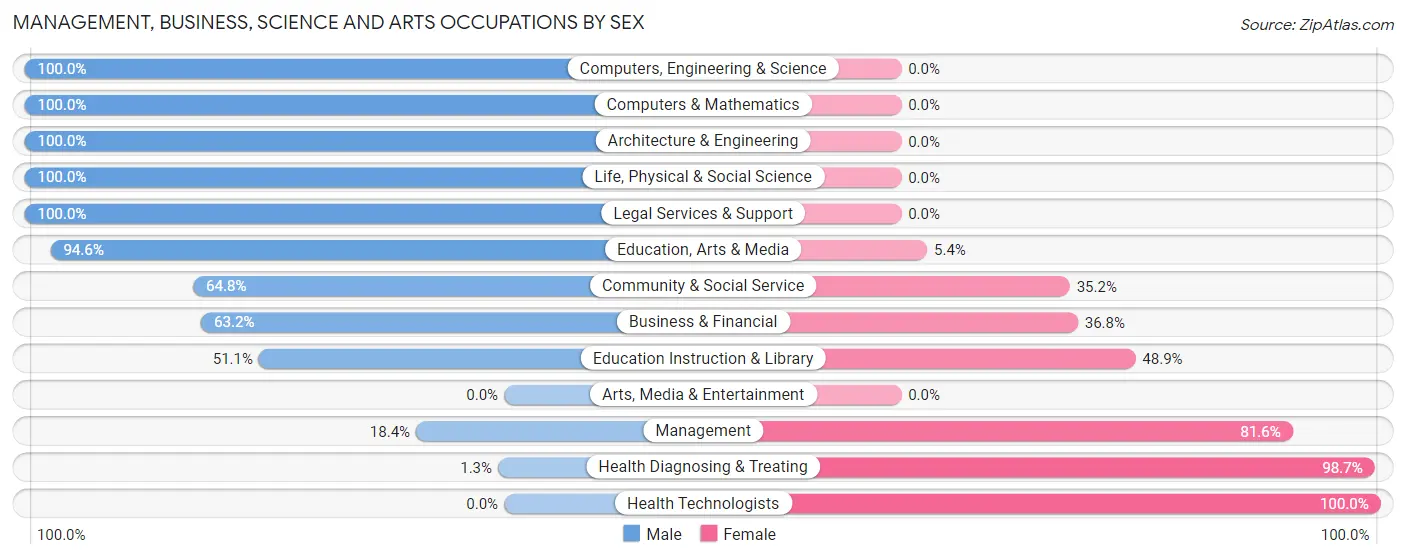
Management, Business, Science and Arts Occupations by Sex
Within the Management, Business, Science and Arts occupations in East Brookfield, the most male-oriented occupations are Computers, Engineering & Science (100.0%), Computers & Mathematics (100.0%), and Architecture & Engineering (100.0%), while the most female-oriented occupations are Health Technologists (100.0%), Health Diagnosing & Treating (98.7%), and Management (81.6%).
| Occupation | Male | Female |
| Management | 9 (18.4%) | 40 (81.6%) |
| Business & Financial | 24 (63.2%) | 14 (36.8%) |
| Computers, Engineering & Science | 44 (100.0%) | 0 (0.0%) |
| Computers & Mathematics | 8 (100.0%) | 0 (0.0%) |
| Architecture & Engineering | 31 (100.0%) | 0 (0.0%) |
| Life, Physical & Social Science | 5 (100.0%) | 0 (0.0%) |
| Community & Social Service | 83 (64.8%) | 45 (35.2%) |
| Education, Arts & Media | 35 (94.6%) | 2 (5.4%) |
| Legal Services & Support | 3 (100.0%) | 0 (0.0%) |
| Education Instruction & Library | 45 (51.1%) | 43 (48.9%) |
| Arts, Media & Entertainment | 0 (0.0%) | 0 (0.0%) |
| Health Diagnosing & Treating | 1 (1.3%) | 78 (98.7%) |
| Health Technologists | 0 (0.0%) | 29 (100.0%) |
| Total (Category) | 161 (47.6%) | 177 (52.4%) |
| Total (Overall) | 453 (61.2%) | 287 (38.8%) |
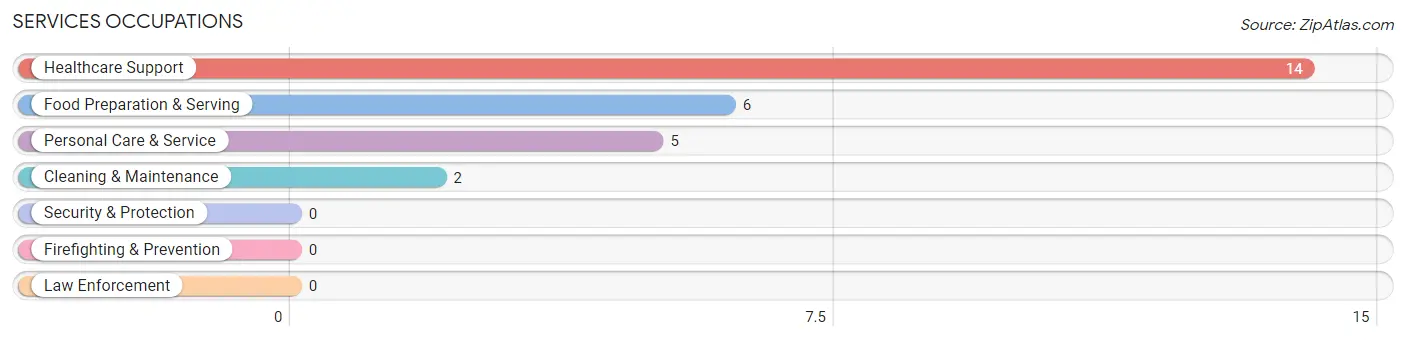
Services Occupations
The most common Services occupations in East Brookfield are Healthcare Support (14 | 1.9%), Food Preparation & Serving (6 | 0.8%), Personal Care & Service (5 | 0.7%), and Cleaning & Maintenance (2 | 0.3%).
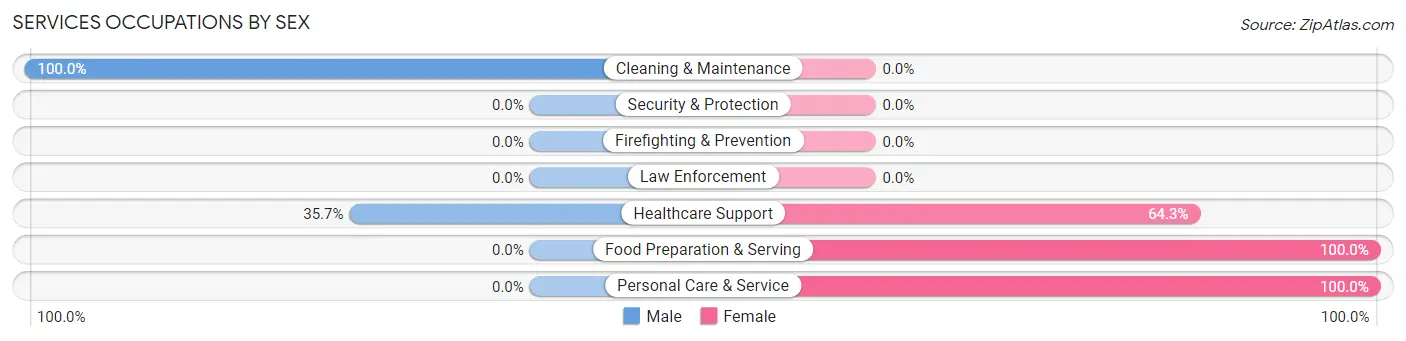
Services Occupations by Sex
Within the Services occupations in East Brookfield, the most male-oriented occupations are Cleaning & Maintenance (100.0%), and Healthcare Support (35.7%), while the most female-oriented occupations are Food Preparation & Serving (100.0%), Personal Care & Service (100.0%), and Healthcare Support (64.3%).
| Occupation | Male | Female |
| Healthcare Support | 5 (35.7%) | 9 (64.3%) |
| Security & Protection | 0 (0.0%) | 0 (0.0%) |
| Firefighting & Prevention | 0 (0.0%) | 0 (0.0%) |
| Law Enforcement | 0 (0.0%) | 0 (0.0%) |
| Food Preparation & Serving | 0 (0.0%) | 6 (100.0%) |
| Cleaning & Maintenance | 2 (100.0%) | 0 (0.0%) |
| Personal Care & Service | 0 (0.0%) | 5 (100.0%) |
| Total (Category) | 7 (25.9%) | 20 (74.1%) |
| Total (Overall) | 453 (61.2%) | 287 (38.8%) |
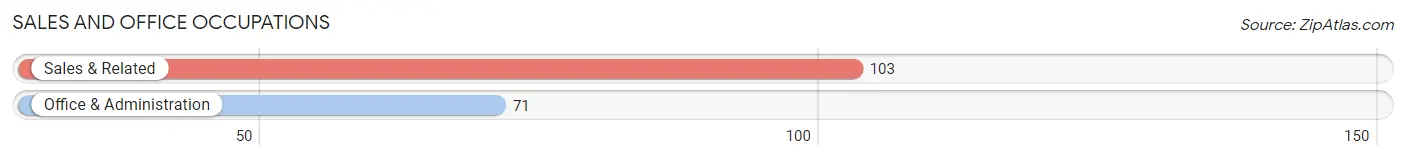
Sales and Office Occupations
The most common Sales and Office occupations in East Brookfield are Sales & Related (103 | 13.9%), and Office & Administration (71 | 9.6%).
Sales and Office Occupations by Sex
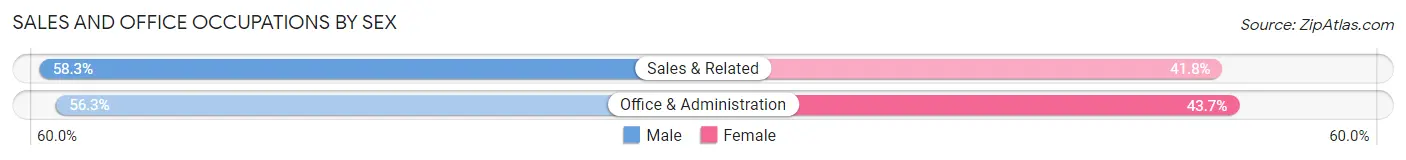
| Occupation | Male | Female |
| Sales & Related | 60 (58.3%) | 43 (41.7%) |
| Office & Administration | 40 (56.3%) | 31 (43.7%) |
| Total (Category) | 100 (57.5%) | 74 (42.5%) |
| Total (Overall) | 453 (61.2%) | 287 (38.8%) |
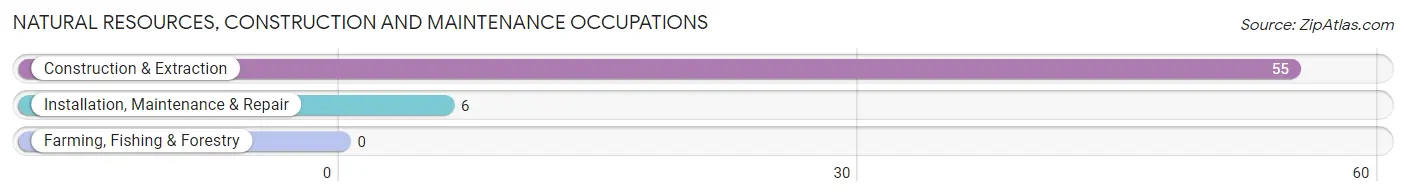
Natural Resources, Construction and Maintenance Occupations
The most common Natural Resources, Construction and Maintenance occupations in East Brookfield are Construction & Extraction (55 | 7.4%), and Installation, Maintenance & Repair (6 | 0.8%).
Natural Resources, Construction and Maintenance Occupations by Sex
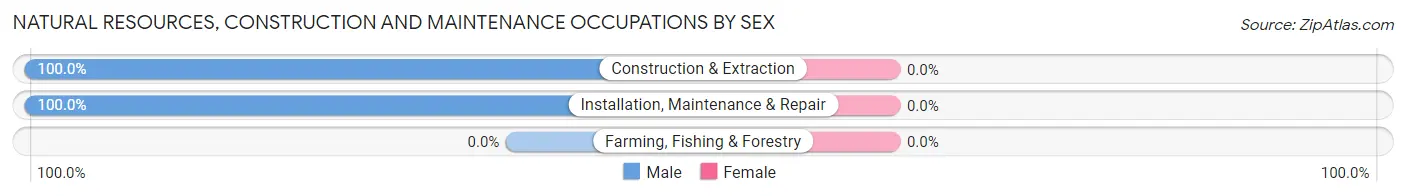
| Occupation | Male | Female |
| Farming, Fishing & Forestry | 0 (0.0%) | 0 (0.0%) |
| Construction & Extraction | 55 (100.0%) | 0 (0.0%) |
| Installation, Maintenance & Repair | 6 (100.0%) | 0 (0.0%) |
| Total (Category) | 61 (100.0%) | 0 (0.0%) |
| Total (Overall) | 453 (61.2%) | 287 (38.8%) |
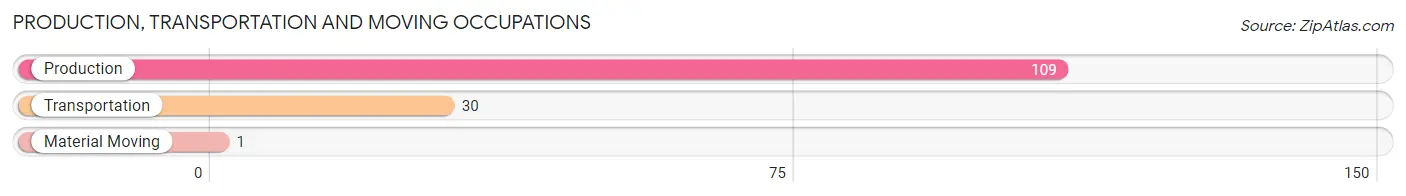
Production, Transportation and Moving Occupations
The most common Production, Transportation and Moving occupations in East Brookfield are Production (109 | 14.7%), Transportation (30 | 4.1%), and Material Moving (1 | 0.1%).
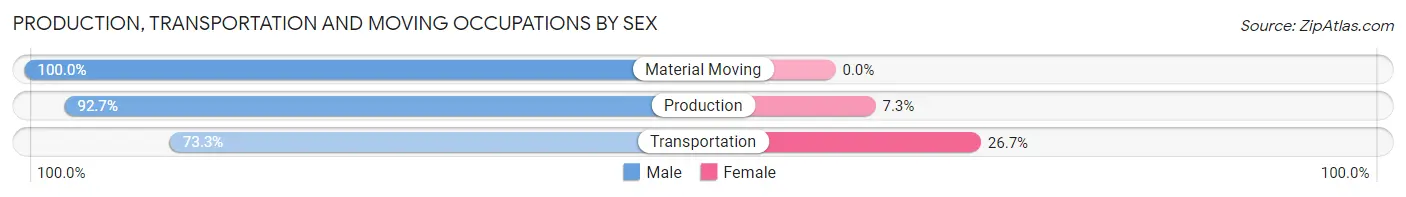
Production, Transportation and Moving Occupations by Sex
| Occupation | Male | Female |
| Production | 101 (92.7%) | 8 (7.3%) |
| Transportation | 22 (73.3%) | 8 (26.7%) |
| Material Moving | 1 (100.0%) | 0 (0.0%) |
| Total (Category) | 124 (88.6%) | 16 (11.4%) |
| Total (Overall) | 453 (61.2%) | 287 (38.8%) |
Employment Industries by Sex in East Brookfield
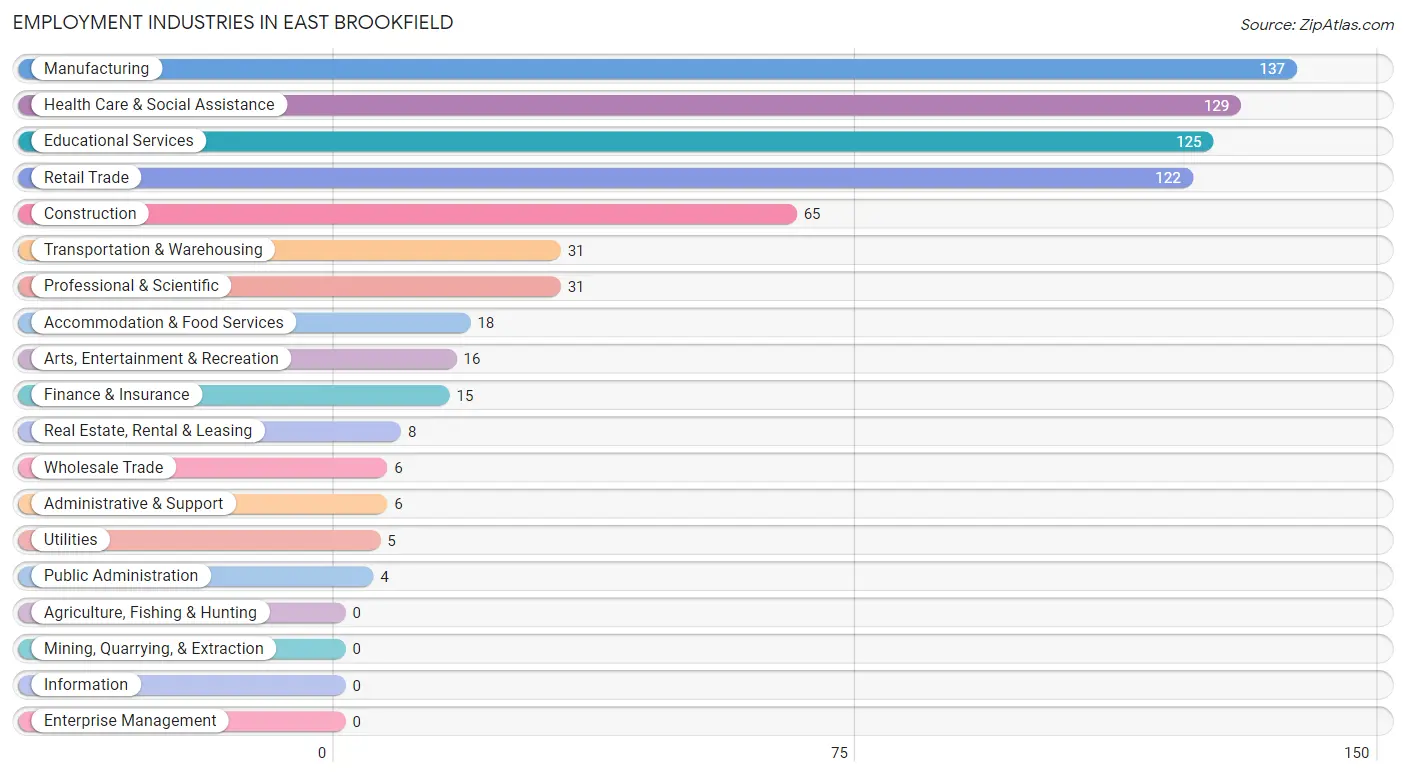
Employment Industries in East Brookfield
The major employment industries in East Brookfield include Manufacturing (137 | 18.5%), Health Care & Social Assistance (129 | 17.4%), Educational Services (125 | 16.9%), Retail Trade (122 | 16.5%), and Construction (65 | 8.8%).
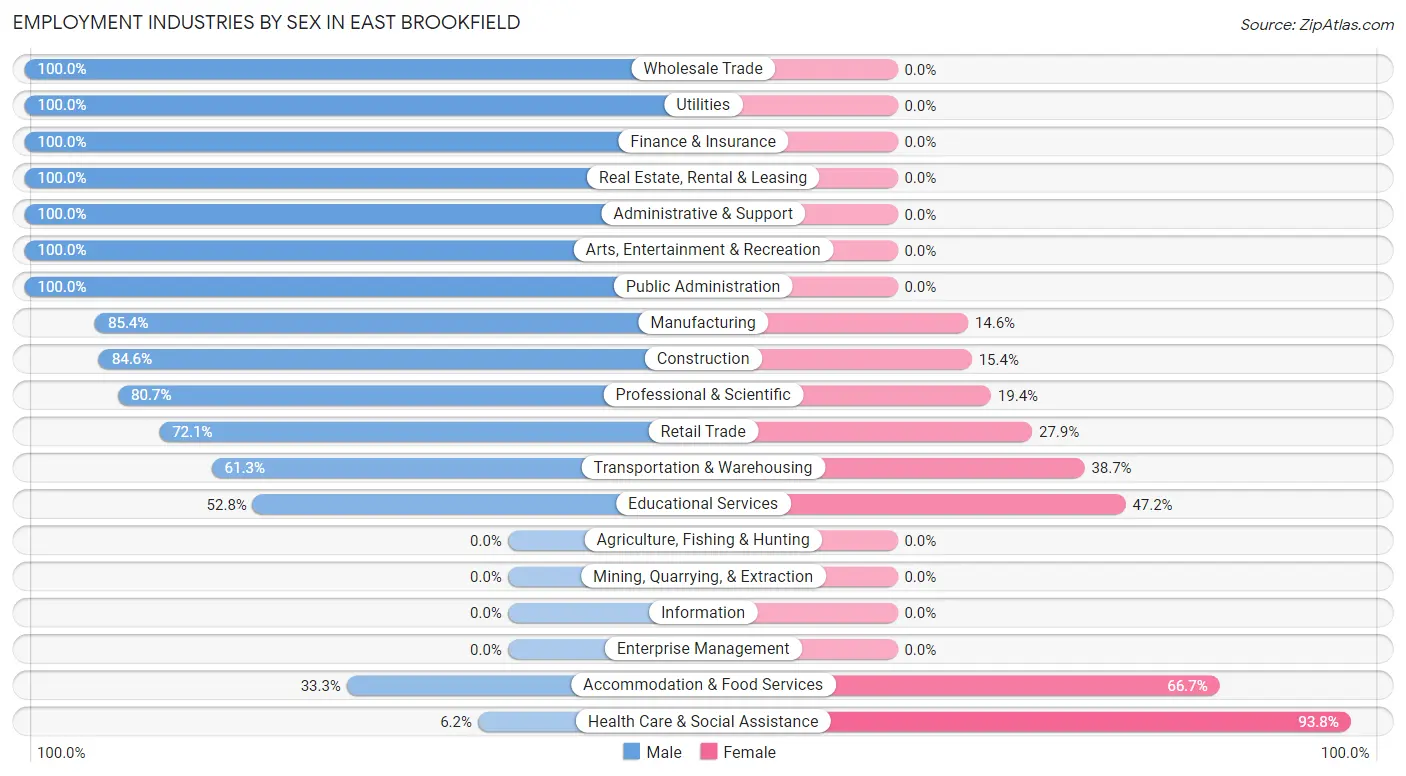
Employment Industries by Sex in East Brookfield
The East Brookfield industries that see more men than women are Wholesale Trade (100.0%), Utilities (100.0%), and Finance & Insurance (100.0%), whereas the industries that tend to have a higher number of women are Health Care & Social Assistance (93.8%), Accommodation & Food Services (66.7%), and Educational Services (47.2%).
| Industry | Male | Female |
| Agriculture, Fishing & Hunting | 0 (0.0%) | 0 (0.0%) |
| Mining, Quarrying, & Extraction | 0 (0.0%) | 0 (0.0%) |
| Construction | 55 (84.6%) | 10 (15.4%) |
| Manufacturing | 117 (85.4%) | 20 (14.6%) |
| Wholesale Trade | 6 (100.0%) | 0 (0.0%) |
| Retail Trade | 88 (72.1%) | 34 (27.9%) |
| Transportation & Warehousing | 19 (61.3%) | 12 (38.7%) |
| Utilities | 5 (100.0%) | 0 (0.0%) |
| Information | 0 (0.0%) | 0 (0.0%) |
| Finance & Insurance | 15 (100.0%) | 0 (0.0%) |
| Real Estate, Rental & Leasing | 8 (100.0%) | 0 (0.0%) |
| Professional & Scientific | 25 (80.6%) | 6 (19.4%) |
| Enterprise Management | 0 (0.0%) | 0 (0.0%) |
| Administrative & Support | 6 (100.0%) | 0 (0.0%) |
| Educational Services | 66 (52.8%) | 59 (47.2%) |
| Health Care & Social Assistance | 8 (6.2%) | 121 (93.8%) |
| Arts, Entertainment & Recreation | 16 (100.0%) | 0 (0.0%) |
| Accommodation & Food Services | 6 (33.3%) | 12 (66.7%) |
| Public Administration | 4 (100.0%) | 0 (0.0%) |
| Total | 453 (61.2%) | 287 (38.8%) |
Education in East Brookfield
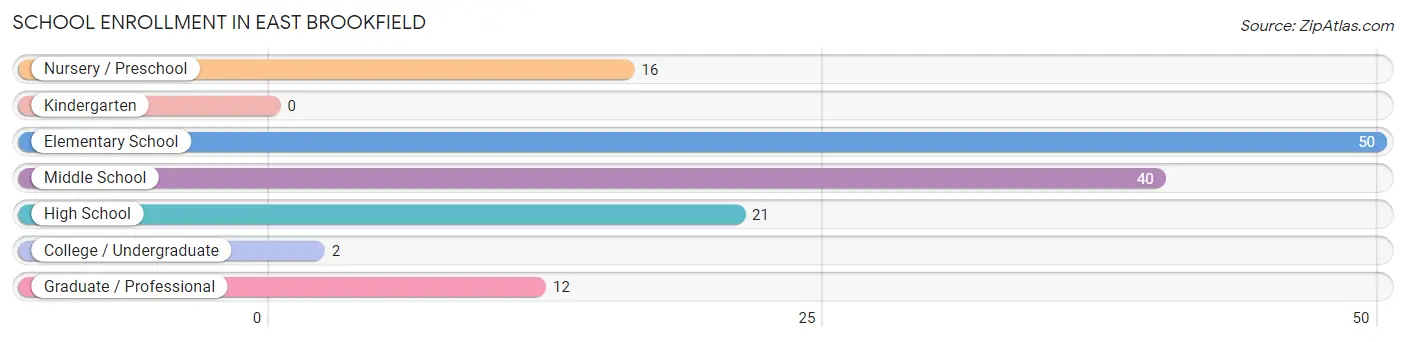
School Enrollment in East Brookfield
The most common levels of schooling among the 141 students in East Brookfield are elementary school (50 | 35.5%), middle school (40 | 28.4%), and high school (21 | 14.9%).
| School Level | # Students | % Students |
| Nursery / Preschool | 16 | 11.4% |
| Kindergarten | 0 | 0.0% |
| Elementary School | 50 | 35.5% |
| Middle School | 40 | 28.4% |
| High School | 21 | 14.9% |
| College / Undergraduate | 2 | 1.4% |
| Graduate / Professional | 12 | 8.5% |
| Total | 141 | 100.0% |
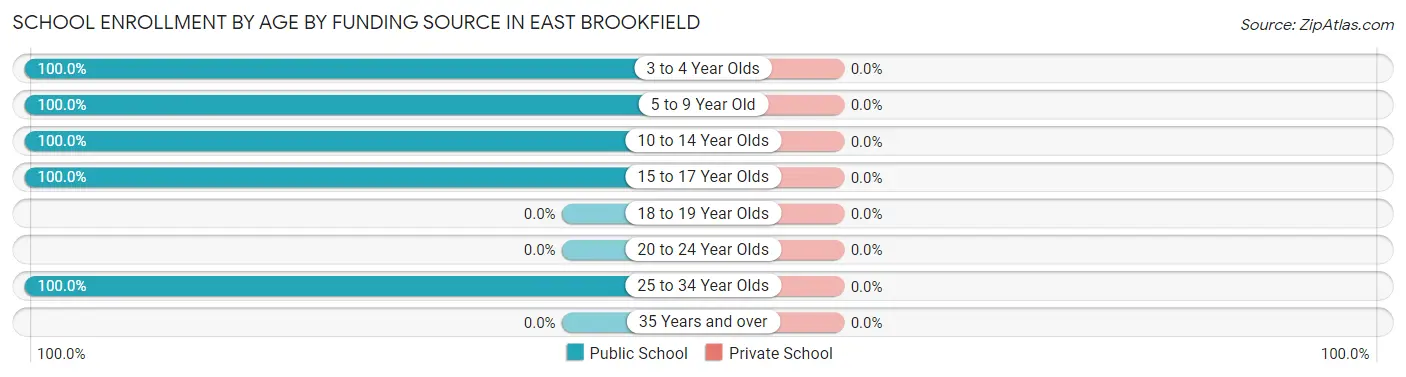
School Enrollment by Age by Funding Source in East Brookfield
| Age Bracket | Public School | Private School |
| 3 to 4 Year Olds | 11 (100.0%) | 0 (0.0%) |
| 5 to 9 Year Old | 50 (100.0%) | 0 (0.0%) |
| 10 to 14 Year Olds | 40 (100.0%) | 0 (0.0%) |
| 15 to 17 Year Olds | 26 (100.0%) | 0 (0.0%) |
| 18 to 19 Year Olds | 0 (0.0%) | 0 (0.0%) |
| 20 to 24 Year Olds | 0 (0.0%) | 0 (0.0%) |
| 25 to 34 Year Olds | 14 (100.0%) | 0 (0.0%) |
| 35 Years and over | 0 (0.0%) | 0 (0.0%) |
| Total | 141 (100.0%) | 0 (0.0%) |
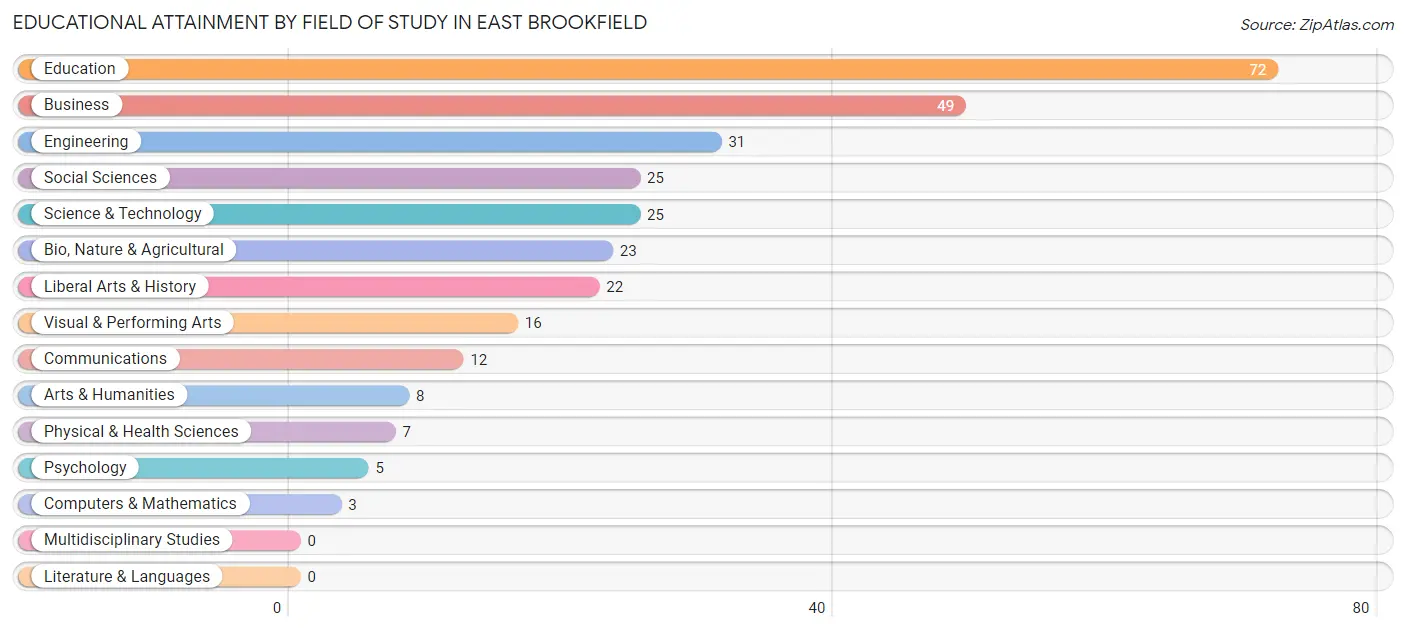
Educational Attainment by Field of Study in East Brookfield
Education (72 | 24.2%), business (49 | 16.4%), engineering (31 | 10.4%), social sciences (25 | 8.4%), and science & technology (25 | 8.4%) are the most common fields of study among 298 individuals in East Brookfield who have obtained a bachelor's degree or higher.
| Field of Study | # Graduates | % Graduates |
| Computers & Mathematics | 3 | 1.0% |
| Bio, Nature & Agricultural | 23 | 7.7% |
| Physical & Health Sciences | 7 | 2.4% |
| Psychology | 5 | 1.7% |
| Social Sciences | 25 | 8.4% |
| Engineering | 31 | 10.4% |
| Multidisciplinary Studies | 0 | 0.0% |
| Science & Technology | 25 | 8.4% |
| Business | 49 | 16.4% |
| Education | 72 | 24.2% |
| Literature & Languages | 0 | 0.0% |
| Liberal Arts & History | 22 | 7.4% |
| Visual & Performing Arts | 16 | 5.4% |
| Communications | 12 | 4.0% |
| Arts & Humanities | 8 | 2.7% |
| Total | 298 | 100.0% |
Transportation & Commute in East Brookfield
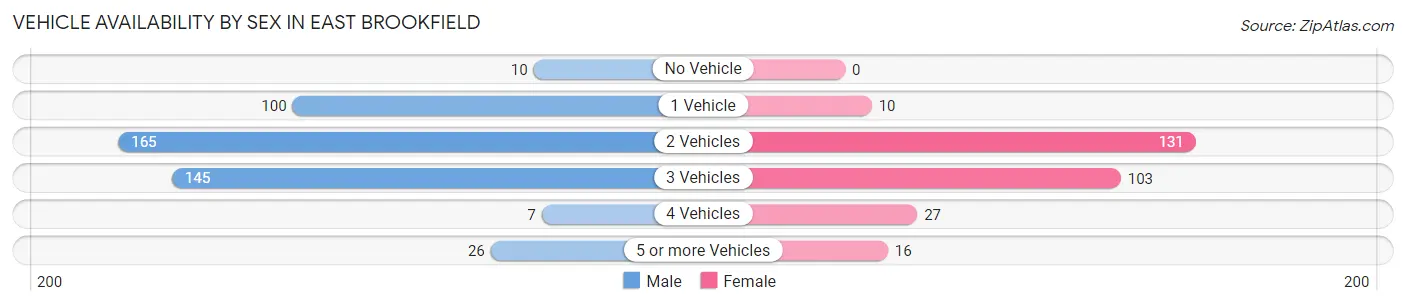
Vehicle Availability by Sex in East Brookfield
The most prevalent vehicle ownership categories in East Brookfield are males with 2 vehicles (165, accounting for 36.4%) and females with 2 vehicles (131, making up 57.5%).
| Vehicles Available | Male | Female |
| No Vehicle | 10 (2.2%) | 0 (0.0%) |
| 1 Vehicle | 100 (22.1%) | 10 (3.5%) |
| 2 Vehicles | 165 (36.4%) | 131 (45.6%) |
| 3 Vehicles | 145 (32.0%) | 103 (35.9%) |
| 4 Vehicles | 7 (1.5%) | 27 (9.4%) |
| 5 or more Vehicles | 26 (5.7%) | 16 (5.6%) |
| Total | 453 (100.0%) | 287 (100.0%) |
Commute Time in East Brookfield
The most frequently occuring commute durations in East Brookfield are 60 to 89 minutes (147 commuters, 21.1%), 45 to 59 minutes (119 commuters, 17.1%), and 30 to 34 minutes (103 commuters, 14.8%).
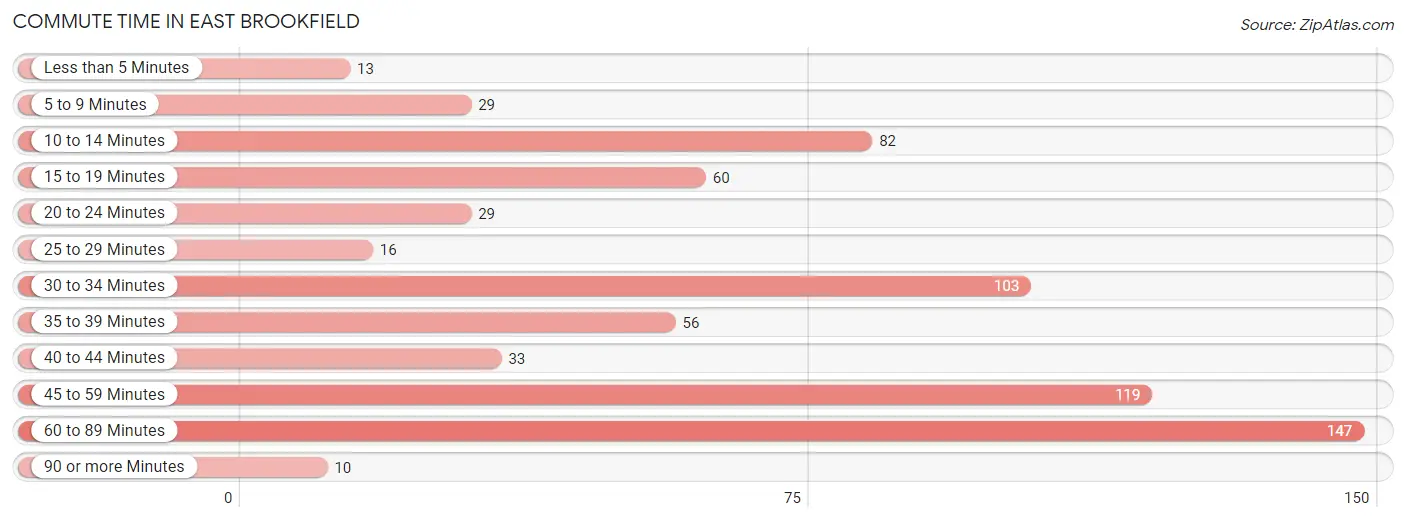
| Commute Time | # Commuters | % Commuters |
| Less than 5 Minutes | 13 | 1.9% |
| 5 to 9 Minutes | 29 | 4.2% |
| 10 to 14 Minutes | 82 | 11.8% |
| 15 to 19 Minutes | 60 | 8.6% |
| 20 to 24 Minutes | 29 | 4.2% |
| 25 to 29 Minutes | 16 | 2.3% |
| 30 to 34 Minutes | 103 | 14.8% |
| 35 to 39 Minutes | 56 | 8.0% |
| 40 to 44 Minutes | 33 | 4.7% |
| 45 to 59 Minutes | 119 | 17.1% |
| 60 to 89 Minutes | 147 | 21.1% |
| 90 or more Minutes | 10 | 1.4% |
Commute Time by Sex in East Brookfield
The most common commute times in East Brookfield are 60 to 89 minutes (105 commuters, 24.0%) for males and 35 to 39 minutes (53 commuters, 20.5%) for females.
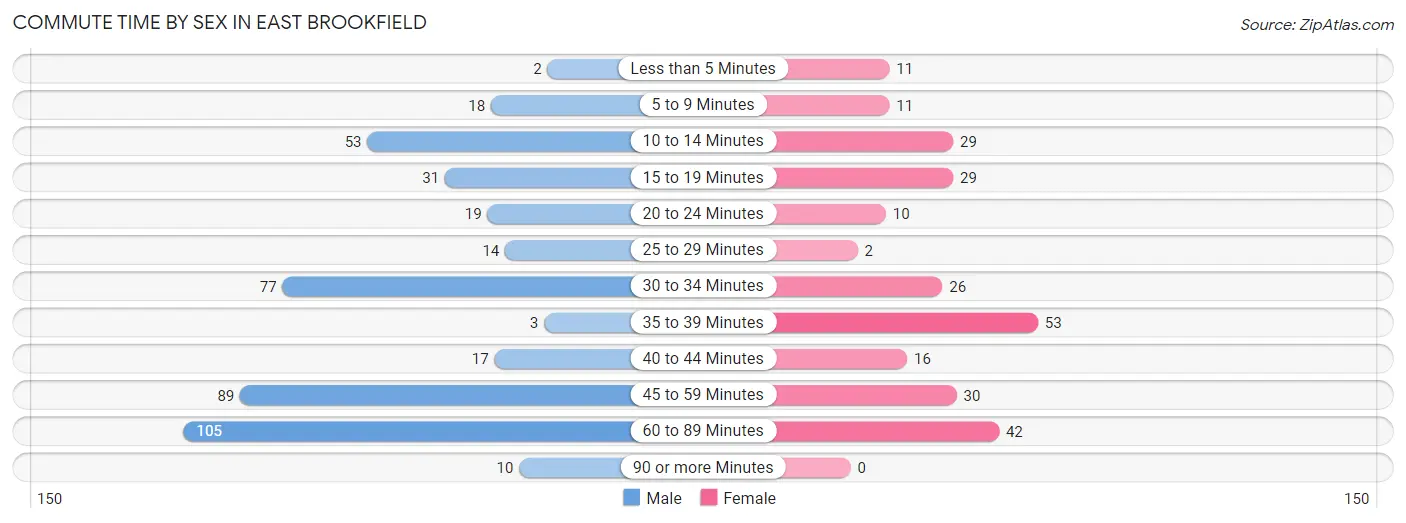
| Commute Time | Male | Female |
| Less than 5 Minutes | 2 (0.5%) | 11 (4.3%) |
| 5 to 9 Minutes | 18 (4.1%) | 11 (4.3%) |
| 10 to 14 Minutes | 53 (12.1%) | 29 (11.2%) |
| 15 to 19 Minutes | 31 (7.1%) | 29 (11.2%) |
| 20 to 24 Minutes | 19 (4.3%) | 10 (3.9%) |
| 25 to 29 Minutes | 14 (3.2%) | 2 (0.8%) |
| 30 to 34 Minutes | 77 (17.6%) | 26 (10.0%) |
| 35 to 39 Minutes | 3 (0.7%) | 53 (20.5%) |
| 40 to 44 Minutes | 17 (3.9%) | 16 (6.2%) |
| 45 to 59 Minutes | 89 (20.3%) | 30 (11.6%) |
| 60 to 89 Minutes | 105 (24.0%) | 42 (16.2%) |
| 90 or more Minutes | 10 (2.3%) | 0 (0.0%) |
Time of Departure to Work by Sex in East Brookfield
The most frequent times of departure to work in East Brookfield are 6:00 AM to 6:29 AM (115, 26.3%) for males and 8:00 AM to 8:29 AM (76, 29.3%) for females.
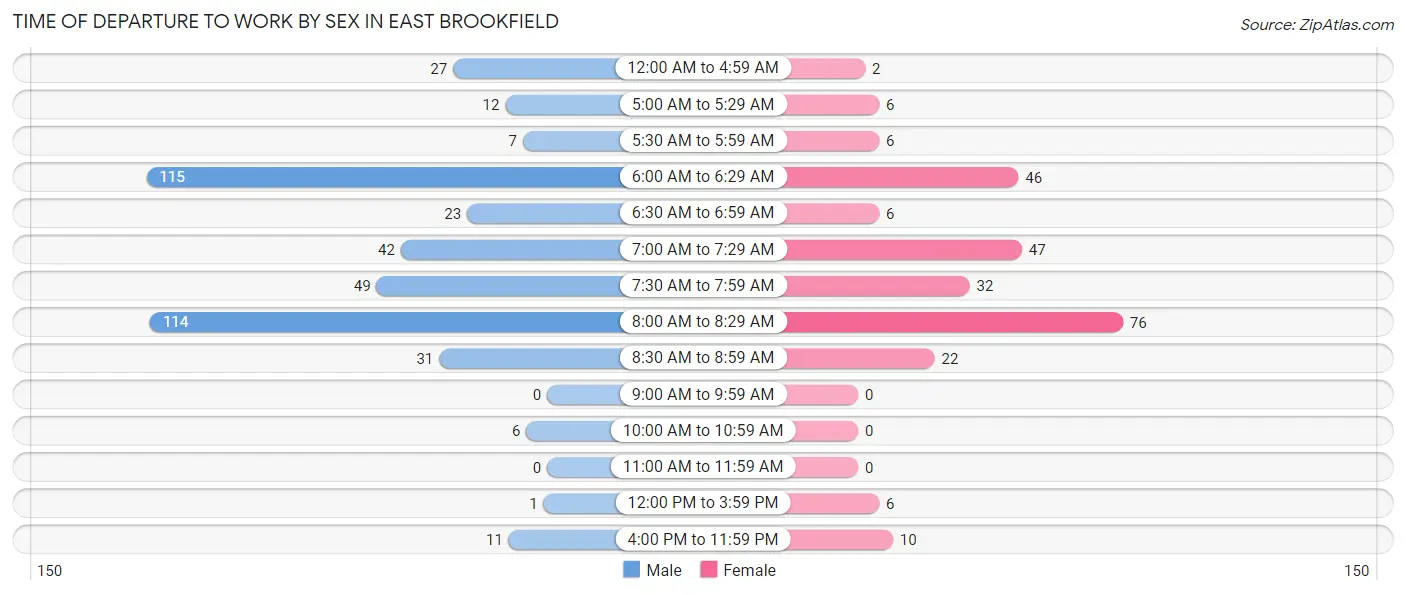
| Time of Departure | Male | Female |
| 12:00 AM to 4:59 AM | 27 (6.2%) | 2 (0.8%) |
| 5:00 AM to 5:29 AM | 12 (2.7%) | 6 (2.3%) |
| 5:30 AM to 5:59 AM | 7 (1.6%) | 6 (2.3%) |
| 6:00 AM to 6:29 AM | 115 (26.3%) | 46 (17.8%) |
| 6:30 AM to 6:59 AM | 23 (5.2%) | 6 (2.3%) |
| 7:00 AM to 7:29 AM | 42 (9.6%) | 47 (18.1%) |
| 7:30 AM to 7:59 AM | 49 (11.2%) | 32 (12.4%) |
| 8:00 AM to 8:29 AM | 114 (26.0%) | 76 (29.3%) |
| 8:30 AM to 8:59 AM | 31 (7.1%) | 22 (8.5%) |
| 9:00 AM to 9:59 AM | 0 (0.0%) | 0 (0.0%) |
| 10:00 AM to 10:59 AM | 6 (1.4%) | 0 (0.0%) |
| 11:00 AM to 11:59 AM | 0 (0.0%) | 0 (0.0%) |
| 12:00 PM to 3:59 PM | 1 (0.2%) | 6 (2.3%) |
| 4:00 PM to 11:59 PM | 11 (2.5%) | 10 (3.9%) |
| Total | 438 (100.0%) | 259 (100.0%) |
Housing Occupancy in East Brookfield
Occupancy by Ownership in East Brookfield
Of the total 562 dwellings in East Brookfield, owner-occupied units account for 421 (74.9%), while renter-occupied units make up 141 (25.1%).
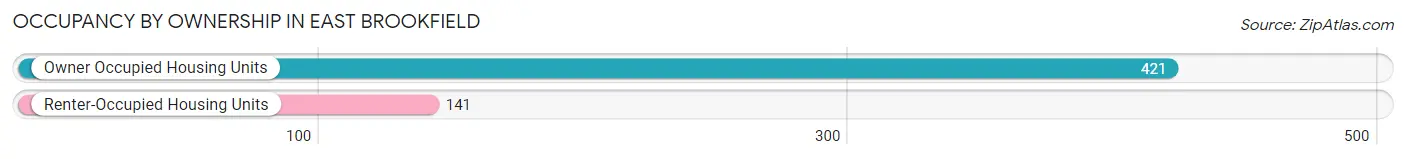
| Occupancy | # Housing Units | % Housing Units |
| Owner Occupied Housing Units | 421 | 74.9% |
| Renter-Occupied Housing Units | 141 | 25.1% |
| Total Occupied Housing Units | 562 | 100.0% |
Occupancy by Household Size in East Brookfield
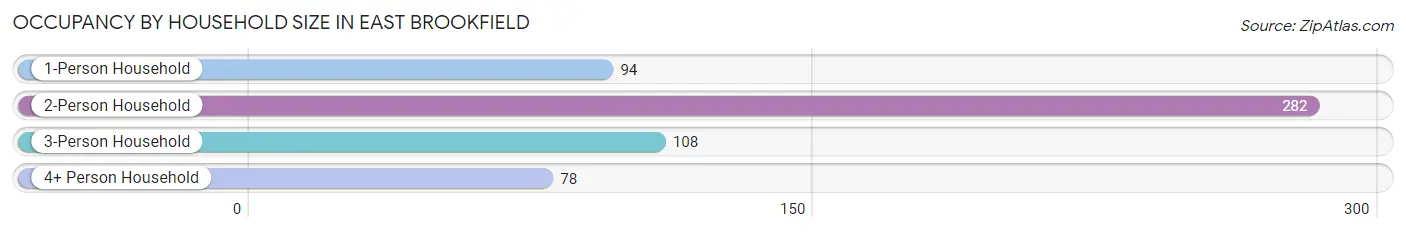
| Household Size | # Housing Units | % Housing Units |
| 1-Person Household | 94 | 16.7% |
| 2-Person Household | 282 | 50.2% |
| 3-Person Household | 108 | 19.2% |
| 4+ Person Household | 78 | 13.9% |
| Total Housing Units | 562 | 100.0% |
Occupancy by Ownership by Household Size in East Brookfield
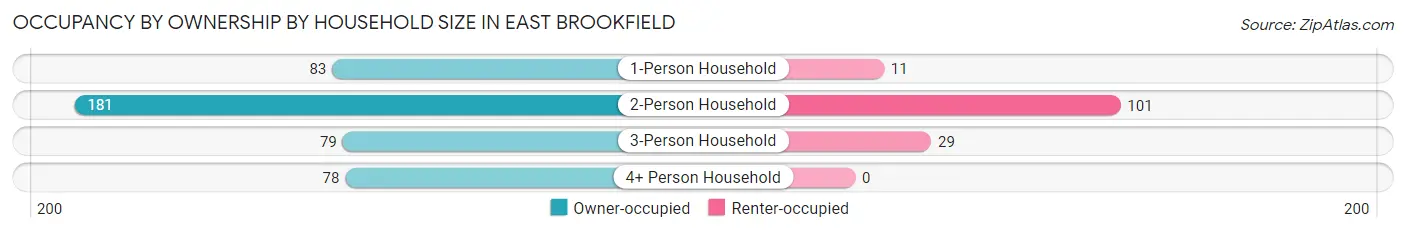
| Household Size | Owner-occupied | Renter-occupied |
| 1-Person Household | 83 (88.3%) | 11 (11.7%) |
| 2-Person Household | 181 (64.2%) | 101 (35.8%) |
| 3-Person Household | 79 (73.2%) | 29 (26.9%) |
| 4+ Person Household | 78 (100.0%) | 0 (0.0%) |
| Total Housing Units | 421 (74.9%) | 141 (25.1%) |
Occupancy by Educational Attainment in East Brookfield
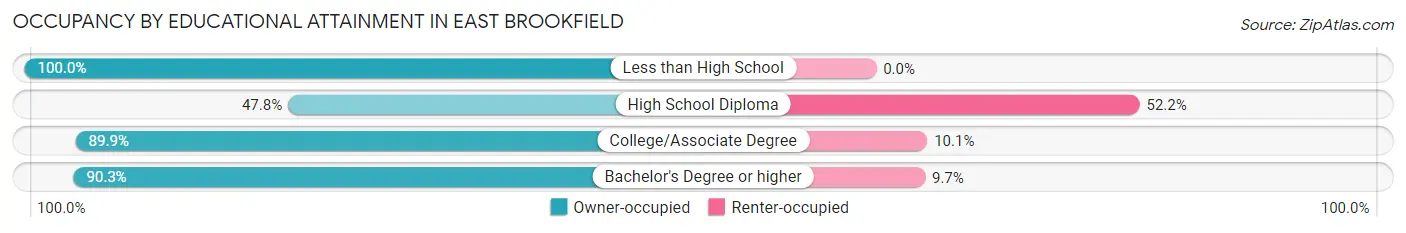
| Household Size | Owner-occupied | Renter-occupied |
| Less than High School | 5 (100.0%) | 0 (0.0%) |
| High School Diploma | 97 (47.8%) | 106 (52.2%) |
| College/Associate Degree | 142 (89.9%) | 16 (10.1%) |
| Bachelor's Degree or higher | 177 (90.3%) | 19 (9.7%) |
Occupancy by Age of Householder in East Brookfield
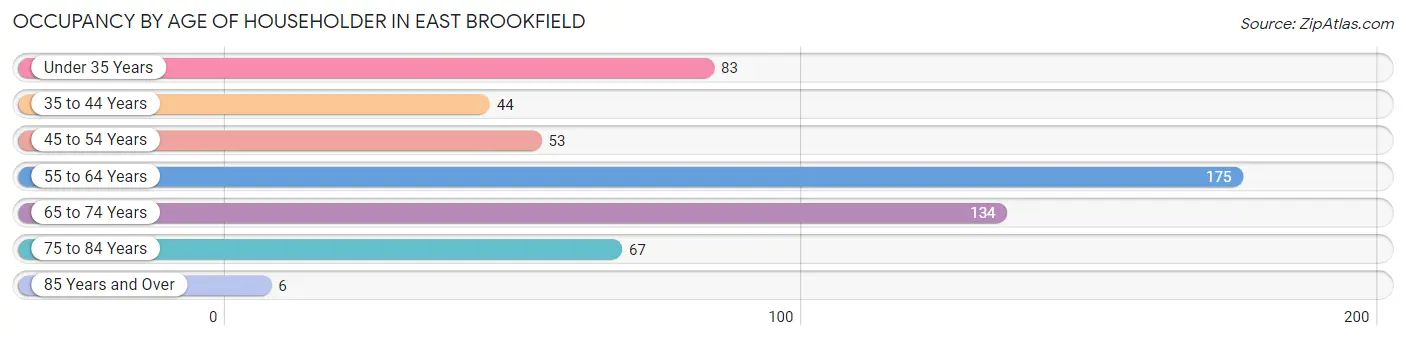
| Age Bracket | # Households | % Households |
| Under 35 Years | 83 | 14.8% |
| 35 to 44 Years | 44 | 7.8% |
| 45 to 54 Years | 53 | 9.4% |
| 55 to 64 Years | 175 | 31.1% |
| 65 to 74 Years | 134 | 23.8% |
| 75 to 84 Years | 67 | 11.9% |
| 85 Years and Over | 6 | 1.1% |
| Total | 562 | 100.0% |
Housing Finances in East Brookfield
Median Income by Occupancy in East Brookfield
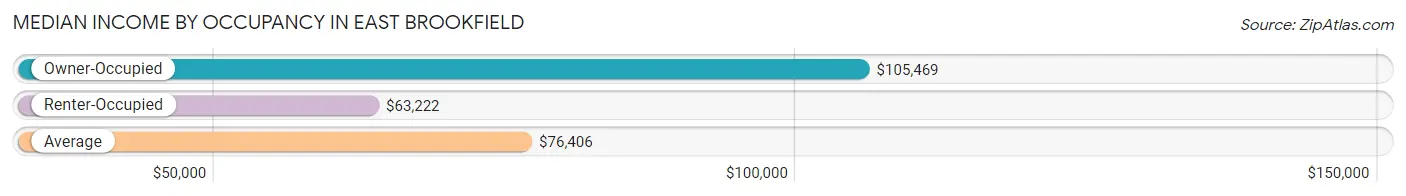
| Occupancy Type | # Households | Median Income |
| Owner-Occupied | 421 (74.9%) | $105,469 |
| Renter-Occupied | 141 (25.1%) | $63,222 |
| Average | 562 (100.0%) | $76,406 |
Occupancy by Householder Income Bracket in East Brookfield
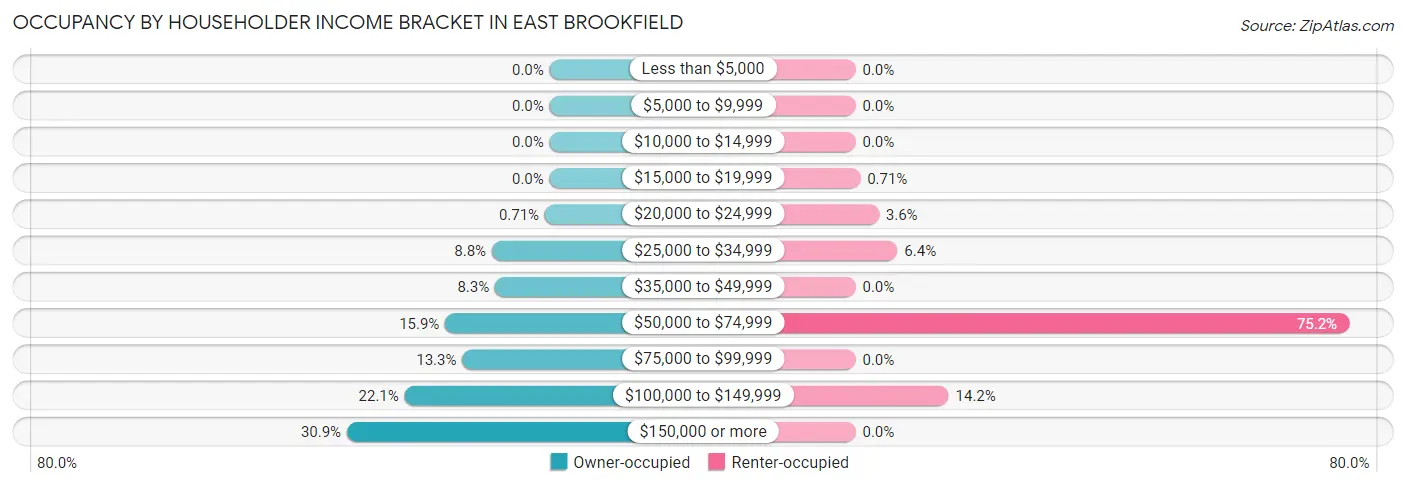
| Income Bracket | Owner-occupied | Renter-occupied |
| Less than $5,000 | 0 (0.0%) | 0 (0.0%) |
| $5,000 to $9,999 | 0 (0.0%) | 0 (0.0%) |
| $10,000 to $14,999 | 0 (0.0%) | 0 (0.0%) |
| $15,000 to $19,999 | 0 (0.0%) | 1 (0.7%) |
| $20,000 to $24,999 | 3 (0.7%) | 5 (3.5%) |
| $25,000 to $34,999 | 37 (8.8%) | 9 (6.4%) |
| $35,000 to $49,999 | 35 (8.3%) | 0 (0.0%) |
| $50,000 to $74,999 | 67 (15.9%) | 106 (75.2%) |
| $75,000 to $99,999 | 56 (13.3%) | 0 (0.0%) |
| $100,000 to $149,999 | 93 (22.1%) | 20 (14.2%) |
| $150,000 or more | 130 (30.9%) | 0 (0.0%) |
| Total | 421 (100.0%) | 141 (100.0%) |
Monthly Housing Cost Tiers in East Brookfield
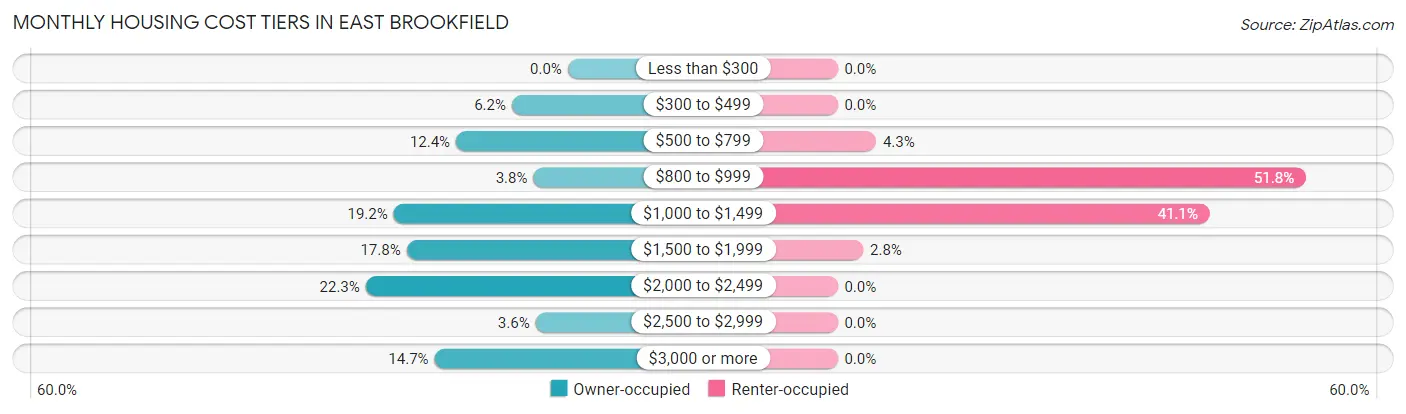
| Monthly Cost | Owner-occupied | Renter-occupied |
| Less than $300 | 0 (0.0%) | 0 (0.0%) |
| $300 to $499 | 26 (6.2%) | 0 (0.0%) |
| $500 to $799 | 52 (12.3%) | 6 (4.3%) |
| $800 to $999 | 16 (3.8%) | 73 (51.8%) |
| $1,000 to $1,499 | 81 (19.2%) | 58 (41.1%) |
| $1,500 to $1,999 | 75 (17.8%) | 4 (2.8%) |
| $2,000 to $2,499 | 94 (22.3%) | 0 (0.0%) |
| $2,500 to $2,999 | 15 (3.6%) | 0 (0.0%) |
| $3,000 or more | 62 (14.7%) | 0 (0.0%) |
| Total | 421 (100.0%) | 141 (100.0%) |
Physical Housing Characteristics in East Brookfield
Housing Structures in East Brookfield
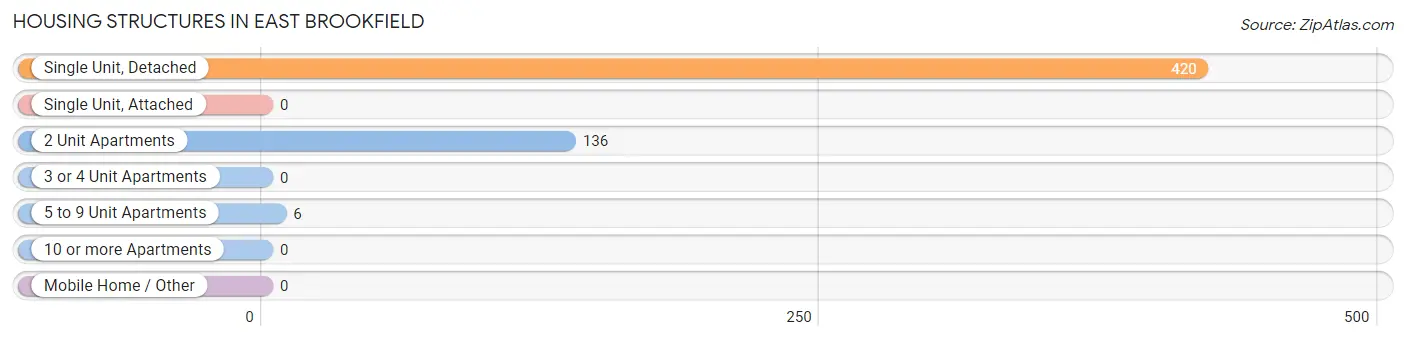
| Structure Type | # Housing Units | % Housing Units |
| Single Unit, Detached | 420 | 74.7% |
| Single Unit, Attached | 0 | 0.0% |
| 2 Unit Apartments | 136 | 24.2% |
| 3 or 4 Unit Apartments | 0 | 0.0% |
| 5 to 9 Unit Apartments | 6 | 1.1% |
| 10 or more Apartments | 0 | 0.0% |
| Mobile Home / Other | 0 | 0.0% |
| Total | 562 | 100.0% |
Housing Structures by Occupancy in East Brookfield
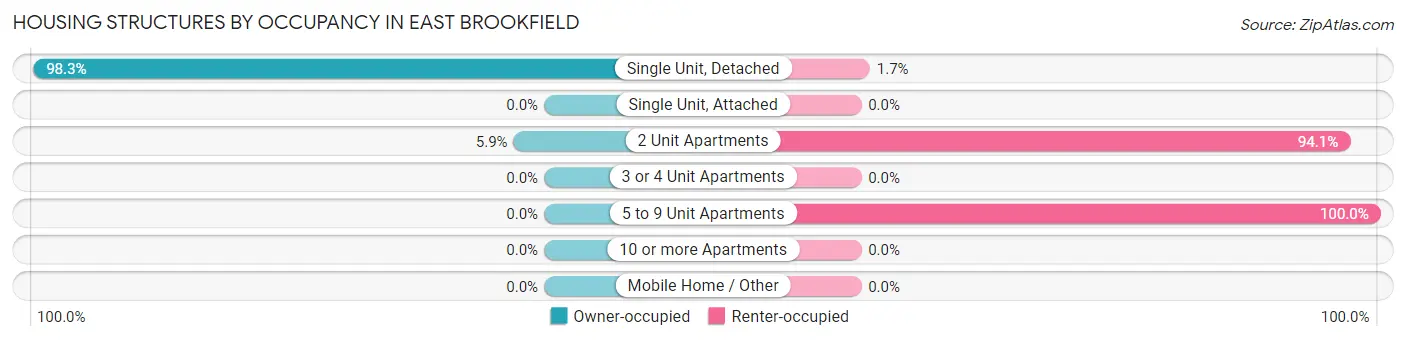
| Structure Type | Owner-occupied | Renter-occupied |
| Single Unit, Detached | 413 (98.3%) | 7 (1.7%) |
| Single Unit, Attached | 0 (0.0%) | 0 (0.0%) |
| 2 Unit Apartments | 8 (5.9%) | 128 (94.1%) |
| 3 or 4 Unit Apartments | 0 (0.0%) | 0 (0.0%) |
| 5 to 9 Unit Apartments | 0 (0.0%) | 6 (100.0%) |
| 10 or more Apartments | 0 (0.0%) | 0 (0.0%) |
| Mobile Home / Other | 0 (0.0%) | 0 (0.0%) |
| Total | 421 (74.9%) | 141 (25.1%) |
Housing Structures by Number of Rooms in East Brookfield
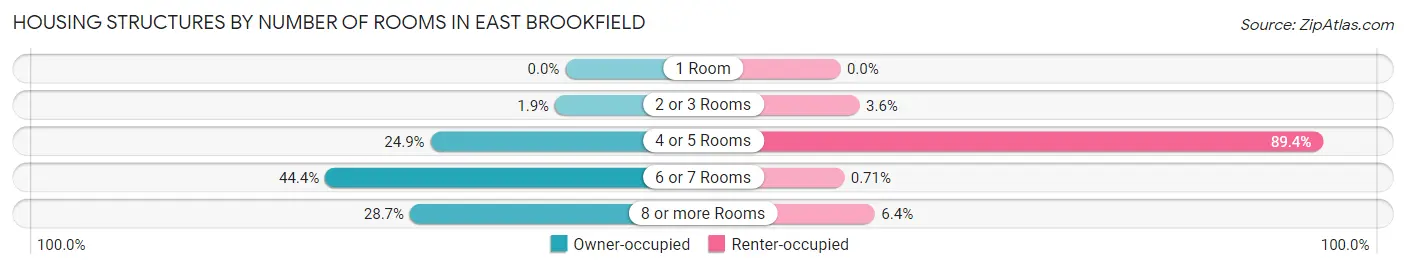
| Number of Rooms | Owner-occupied | Renter-occupied |
| 1 Room | 0 (0.0%) | 0 (0.0%) |
| 2 or 3 Rooms | 8 (1.9%) | 5 (3.5%) |
| 4 or 5 Rooms | 105 (24.9%) | 126 (89.4%) |
| 6 or 7 Rooms | 187 (44.4%) | 1 (0.7%) |
| 8 or more Rooms | 121 (28.7%) | 9 (6.4%) |
| Total | 421 (100.0%) | 141 (100.0%) |
Housing Structure by Heating Type in East Brookfield
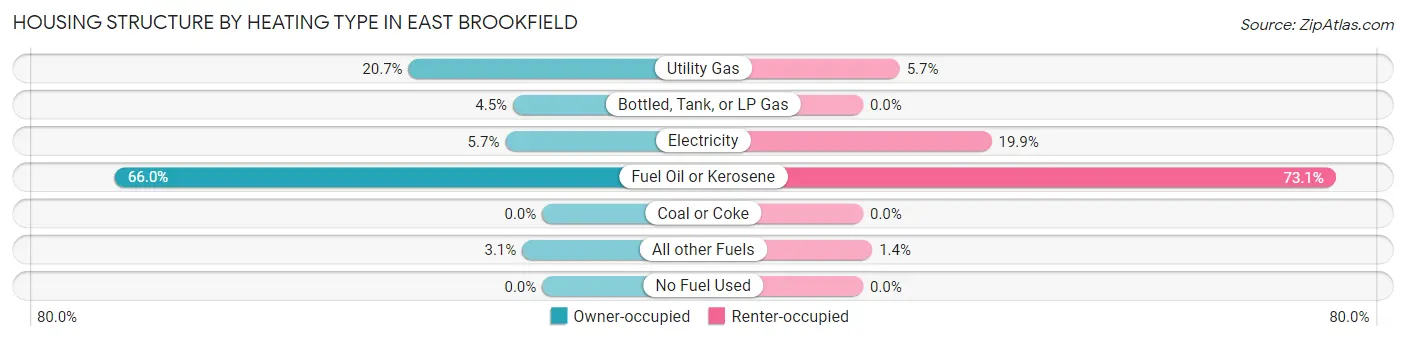
| Heating Type | Owner-occupied | Renter-occupied |
| Utility Gas | 87 (20.7%) | 8 (5.7%) |
| Bottled, Tank, or LP Gas | 19 (4.5%) | 0 (0.0%) |
| Electricity | 24 (5.7%) | 28 (19.9%) |
| Fuel Oil or Kerosene | 278 (66.0%) | 103 (73.1%) |
| Coal or Coke | 0 (0.0%) | 0 (0.0%) |
| All other Fuels | 13 (3.1%) | 2 (1.4%) |
| No Fuel Used | 0 (0.0%) | 0 (0.0%) |
| Total | 421 (100.0%) | 141 (100.0%) |
Household Vehicle Usage in East Brookfield
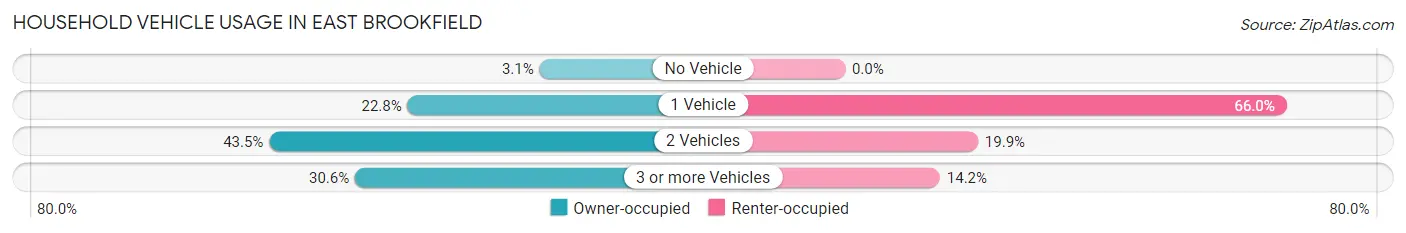
| Vehicles per Household | Owner-occupied | Renter-occupied |
| No Vehicle | 13 (3.1%) | 0 (0.0%) |
| 1 Vehicle | 96 (22.8%) | 93 (66.0%) |
| 2 Vehicles | 183 (43.5%) | 28 (19.9%) |
| 3 or more Vehicles | 129 (30.6%) | 20 (14.2%) |
| Total | 421 (100.0%) | 141 (100.0%) |
Real Estate & Mortgages in East Brookfield
Real Estate and Mortgage Overview in East Brookfield
| Characteristic | Without Mortgage | With Mortgage |
| Housing Units | 154 | 267 |
| Median Property Value | $324,100 | $342,200 |
| Median Household Income | $58,813 | $112 |
| Monthly Housing Costs | $788 | $62 |
| Real Estate Taxes | $4,862 | $0 |
Property Value by Mortgage Status in East Brookfield
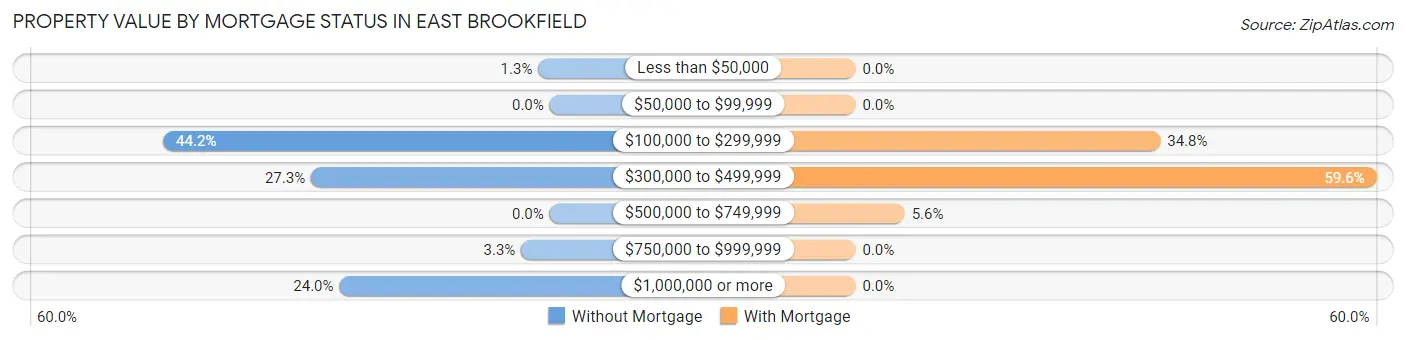
| Property Value | Without Mortgage | With Mortgage |
| Less than $50,000 | 2 (1.3%) | 0 (0.0%) |
| $50,000 to $99,999 | 0 (0.0%) | 0 (0.0%) |
| $100,000 to $299,999 | 68 (44.2%) | 93 (34.8%) |
| $300,000 to $499,999 | 42 (27.3%) | 159 (59.6%) |
| $500,000 to $749,999 | 0 (0.0%) | 15 (5.6%) |
| $750,000 to $999,999 | 5 (3.3%) | 0 (0.0%) |
| $1,000,000 or more | 37 (24.0%) | 0 (0.0%) |
| Total | 154 (100.0%) | 267 (100.0%) |
Household Income by Mortgage Status in East Brookfield
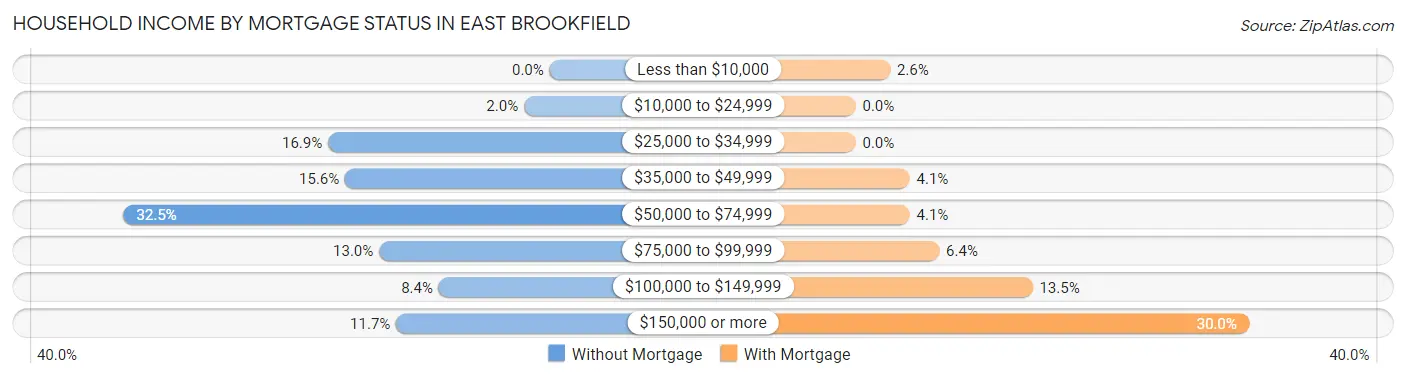
| Household Income | Without Mortgage | With Mortgage |
| Less than $10,000 | 0 (0.0%) | 7 (2.6%) |
| $10,000 to $24,999 | 3 (1.9%) | 0 (0.0%) |
| $25,000 to $34,999 | 26 (16.9%) | 0 (0.0%) |
| $35,000 to $49,999 | 24 (15.6%) | 11 (4.1%) |
| $50,000 to $74,999 | 50 (32.5%) | 11 (4.1%) |
| $75,000 to $99,999 | 20 (13.0%) | 17 (6.4%) |
| $100,000 to $149,999 | 13 (8.4%) | 36 (13.5%) |
| $150,000 or more | 18 (11.7%) | 80 (30.0%) |
| Total | 154 (100.0%) | 267 (100.0%) |
Property Value to Household Income Ratio in East Brookfield
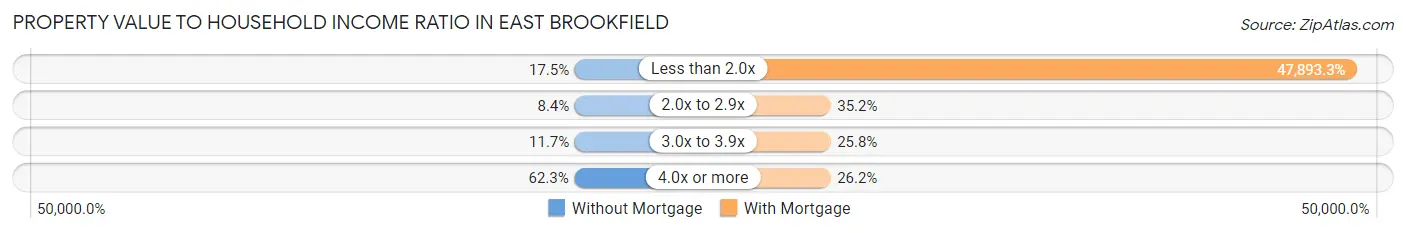
| Value-to-Income Ratio | Without Mortgage | With Mortgage |
| Less than 2.0x | 27 (17.5%) | 127,875 (47,893.3%) |
| 2.0x to 2.9x | 13 (8.4%) | 94 (35.2%) |
| 3.0x to 3.9x | 18 (11.7%) | 69 (25.8%) |
| 4.0x or more | 96 (62.3%) | 70 (26.2%) |
| Total | 154 (100.0%) | 267 (100.0%) |
Real Estate Taxes by Mortgage Status in East Brookfield
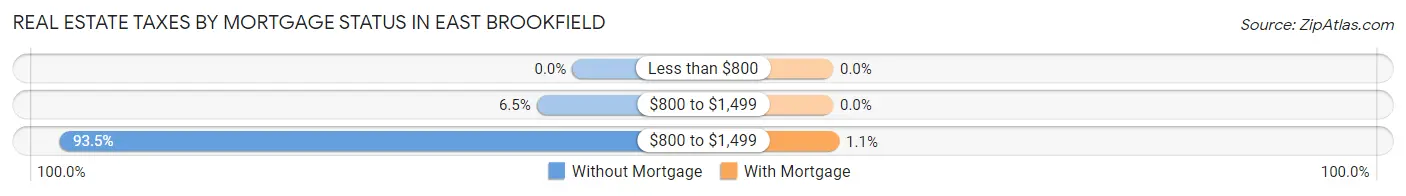
| Property Taxes | Without Mortgage | With Mortgage |
| Less than $800 | 0 (0.0%) | 0 (0.0%) |
| $800 to $1,499 | 10 (6.5%) | 0 (0.0%) |
| $800 to $1,499 | 144 (93.5%) | 3 (1.1%) |
| Total | 154 (100.0%) | 267 (100.0%) |
Health & Disability in East Brookfield
Health Insurance Coverage by Age in East Brookfield
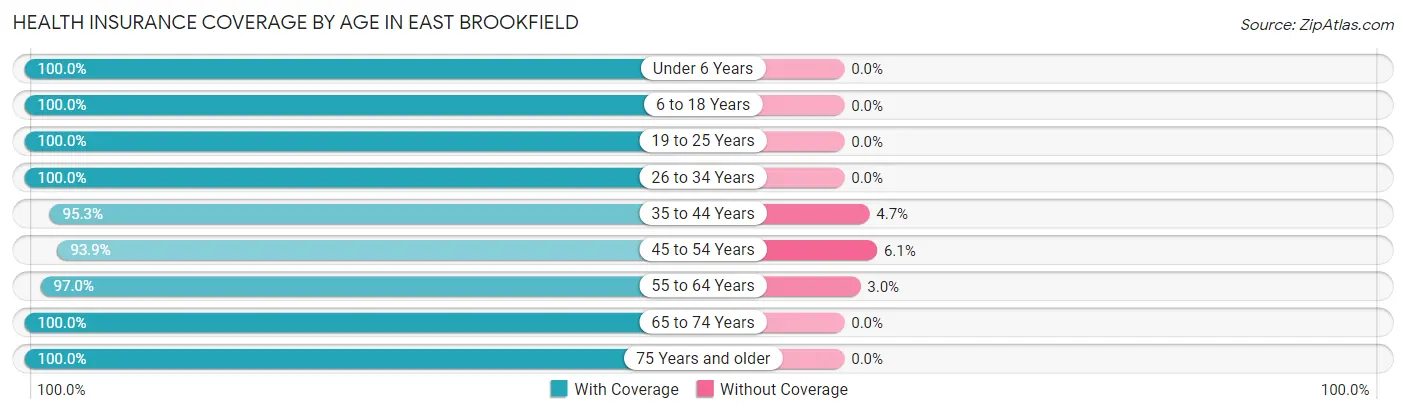
| Age Bracket | With Coverage | Without Coverage |
| Under 6 Years | 72 (100.0%) | 0 (0.0%) |
| 6 to 18 Years | 122 (100.0%) | 0 (0.0%) |
| 19 to 25 Years | 103 (100.0%) | 0 (0.0%) |
| 26 to 34 Years | 161 (100.0%) | 0 (0.0%) |
| 35 to 44 Years | 102 (95.3%) | 5 (4.7%) |
| 45 to 54 Years | 77 (93.9%) | 5 (6.1%) |
| 55 to 64 Years | 292 (97.0%) | 9 (3.0%) |
| 65 to 74 Years | 198 (100.0%) | 0 (0.0%) |
| 75 Years and older | 199 (100.0%) | 0 (0.0%) |
| Total | 1,326 (98.6%) | 19 (1.4%) |
Health Insurance Coverage by Citizenship Status in East Brookfield
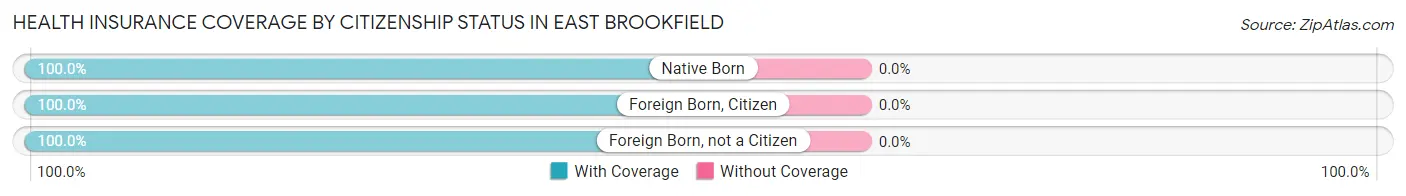
| Citizenship Status | With Coverage | Without Coverage |
| Native Born | 72 (100.0%) | 0 (0.0%) |
| Foreign Born, Citizen | 122 (100.0%) | 0 (0.0%) |
| Foreign Born, not a Citizen | 103 (100.0%) | 0 (0.0%) |
Health Insurance Coverage by Household Income in East Brookfield
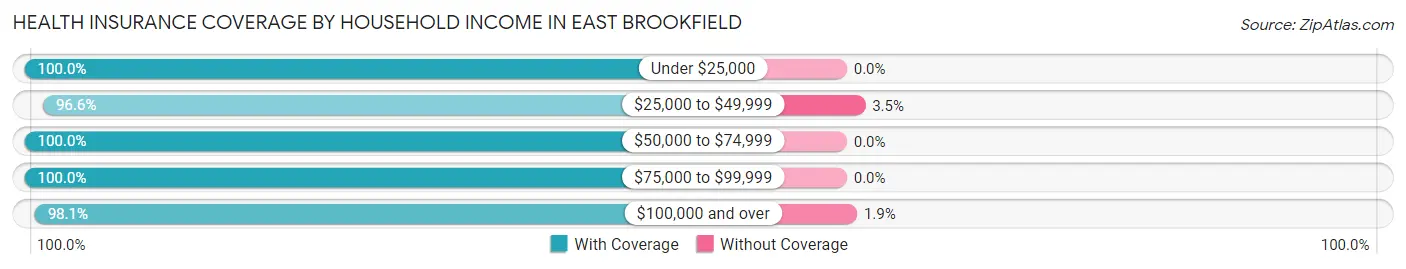
| Household Income | With Coverage | Without Coverage |
| Under $25,000 | 14 (100.0%) | 0 (0.0%) |
| $25,000 to $49,999 | 140 (96.6%) | 5 (3.5%) |
| $50,000 to $74,999 | 297 (100.0%) | 0 (0.0%) |
| $75,000 to $99,999 | 153 (100.0%) | 0 (0.0%) |
| $100,000 and over | 722 (98.1%) | 14 (1.9%) |
Public vs Private Health Insurance Coverage by Age in East Brookfield
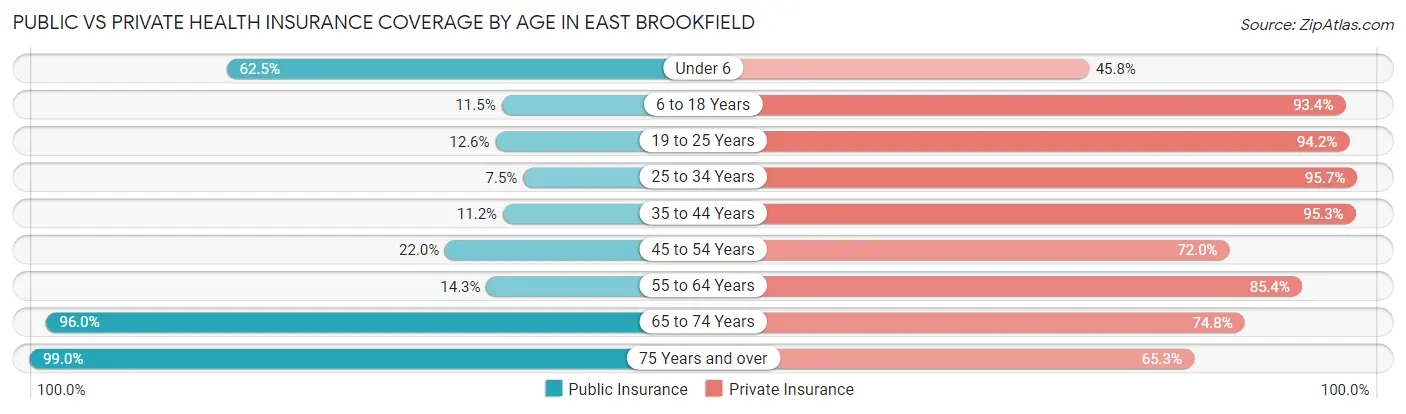
| Age Bracket | Public Insurance | Private Insurance |
| Under 6 | 45 (62.5%) | 33 (45.8%) |
| 6 to 18 Years | 14 (11.5%) | 114 (93.4%) |
| 19 to 25 Years | 13 (12.6%) | 97 (94.2%) |
| 25 to 34 Years | 12 (7.4%) | 154 (95.7%) |
| 35 to 44 Years | 12 (11.2%) | 102 (95.3%) |
| 45 to 54 Years | 18 (22.0%) | 59 (72.0%) |
| 55 to 64 Years | 43 (14.3%) | 257 (85.4%) |
| 65 to 74 Years | 190 (96.0%) | 148 (74.8%) |
| 75 Years and over | 197 (99.0%) | 130 (65.3%) |
| Total | 544 (40.5%) | 1,094 (81.3%) |
Disability Status by Sex by Age in East Brookfield
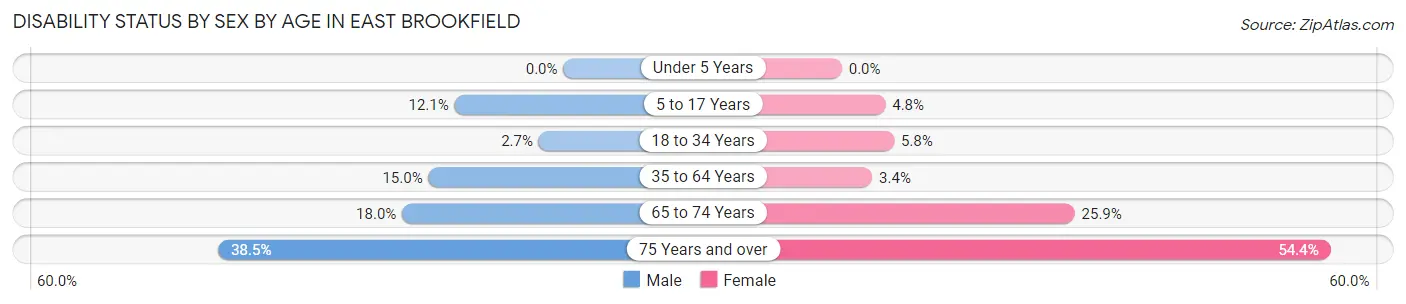
| Age Bracket | Male | Female |
| Under 5 Years | 0 (0.0%) | 0 (0.0%) |
| 5 to 17 Years | 8 (12.1%) | 3 (4.8%) |
| 18 to 34 Years | 5 (2.7%) | 5 (5.8%) |
| 35 to 64 Years | 38 (15.0%) | 8 (3.4%) |
| 65 to 74 Years | 21 (17.9%) | 21 (25.9%) |
| 75 Years and over | 20 (38.5%) | 80 (54.4%) |
Disability Class by Sex by Age in East Brookfield
Disability Class: Hearing Difficulty
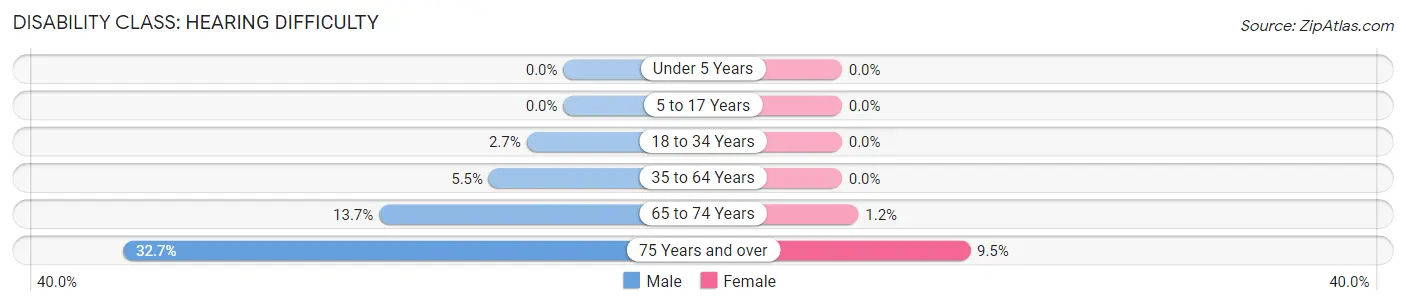
| Age Bracket | Male | Female |
| Under 5 Years | 0 (0.0%) | 0 (0.0%) |
| 5 to 17 Years | 0 (0.0%) | 0 (0.0%) |
| 18 to 34 Years | 5 (2.7%) | 0 (0.0%) |
| 35 to 64 Years | 14 (5.5%) | 0 (0.0%) |
| 65 to 74 Years | 16 (13.7%) | 1 (1.2%) |
| 75 Years and over | 17 (32.7%) | 14 (9.5%) |
Disability Class: Vision Difficulty
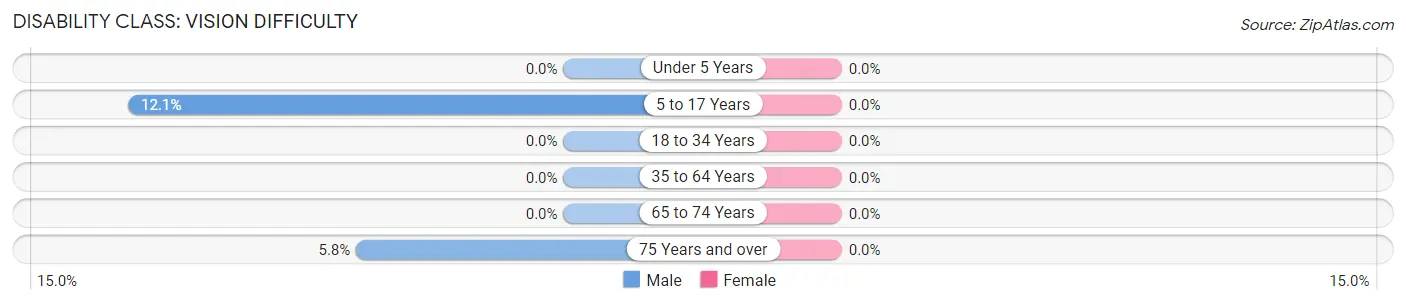
| Age Bracket | Male | Female |
| Under 5 Years | 0 (0.0%) | 0 (0.0%) |
| 5 to 17 Years | 8 (12.1%) | 0 (0.0%) |
| 18 to 34 Years | 0 (0.0%) | 0 (0.0%) |
| 35 to 64 Years | 0 (0.0%) | 0 (0.0%) |
| 65 to 74 Years | 0 (0.0%) | 0 (0.0%) |
| 75 Years and over | 3 (5.8%) | 0 (0.0%) |
Disability Class: Cognitive Difficulty
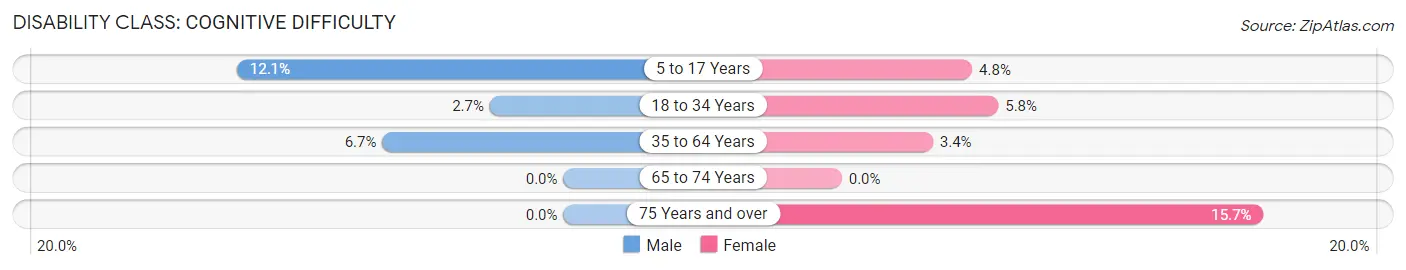
| Age Bracket | Male | Female |
| 5 to 17 Years | 8 (12.1%) | 3 (4.8%) |
| 18 to 34 Years | 5 (2.7%) | 5 (5.8%) |
| 35 to 64 Years | 17 (6.7%) | 8 (3.4%) |
| 65 to 74 Years | 0 (0.0%) | 0 (0.0%) |
| 75 Years and over | 0 (0.0%) | 23 (15.7%) |
Disability Class: Ambulatory Difficulty
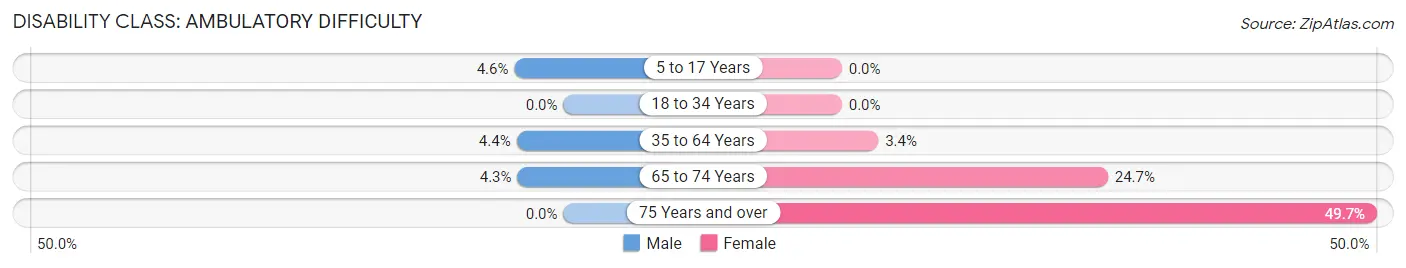
| Age Bracket | Male | Female |
| 5 to 17 Years | 3 (4.5%) | 0 (0.0%) |
| 18 to 34 Years | 0 (0.0%) | 0 (0.0%) |
| 35 to 64 Years | 11 (4.3%) | 8 (3.4%) |
| 65 to 74 Years | 5 (4.3%) | 20 (24.7%) |
| 75 Years and over | 0 (0.0%) | 73 (49.7%) |
Disability Class: Self-Care Difficulty
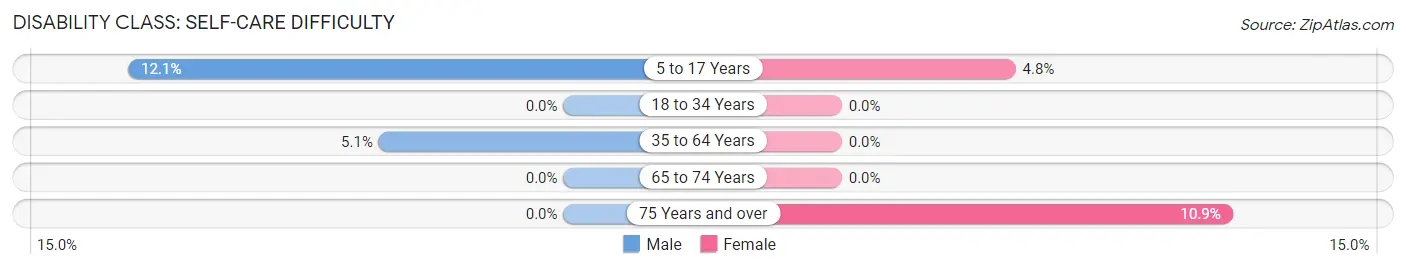
| Age Bracket | Male | Female |
| 5 to 17 Years | 8 (12.1%) | 3 (4.8%) |
| 18 to 34 Years | 0 (0.0%) | 0 (0.0%) |
| 35 to 64 Years | 13 (5.1%) | 0 (0.0%) |
| 65 to 74 Years | 0 (0.0%) | 0 (0.0%) |
| 75 Years and over | 0 (0.0%) | 16 (10.9%) |
Technology Access in East Brookfield
Computing Device Access in East Brookfield
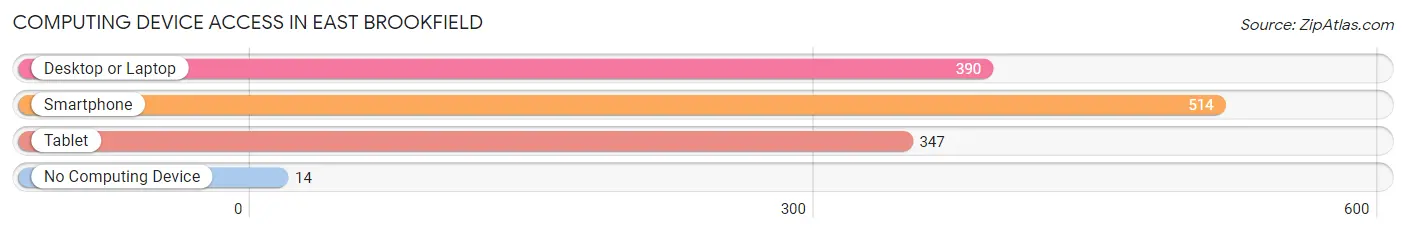
| Device Type | # Households | % Households |
| Desktop or Laptop | 390 | 69.4% |
| Smartphone | 514 | 91.5% |
| Tablet | 347 | 61.7% |
| No Computing Device | 14 | 2.5% |
| Total | 562 | 100.0% |
Internet Access in East Brookfield
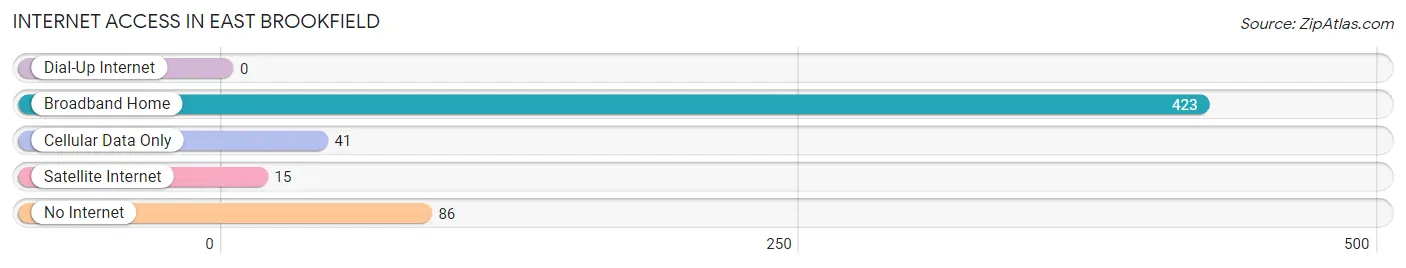
| Internet Type | # Households | % Households |
| Dial-Up Internet | 0 | 0.0% |
| Broadband Home | 423 | 75.3% |
| Cellular Data Only | 41 | 7.3% |
| Satellite Internet | 15 | 2.7% |
| No Internet | 86 | 15.3% |
| Total | 562 | 100.0% |
East Brookfield Summary
History
The town of East Brookfield, Massachusetts is located in Worcester County, approximately 25 miles west of the city of Worcester. The town was first settled in 1664 and was officially incorporated in 1718. The town was originally part of the Quaboag Plantation, which was a large tract of land granted to settlers from the Massachusetts Bay Colony. The town was named after the brook that ran through it, which was named after the town of Brookfield, England.
The town was primarily an agricultural community for much of its history, with the main crops being corn, potatoes, and hay. The town also had a thriving lumber industry, with several sawmills located along the banks of the Quaboag River. The town was also home to several small manufacturing businesses, including a paper mill, a grist mill, and a tannery.
In the late 19th century, the town began to experience a period of growth and development. The railroad arrived in 1875, connecting East Brookfield to the larger cities of Worcester and Boston. This allowed for increased trade and commerce, and the town began to attract new businesses and industries. The town also became a popular summer resort destination, with several large hotels and resorts being built in the area.
Geography
East Brookfield is located in central Massachusetts, in Worcester County. The town is bordered by the towns of North Brookfield to the north, West Brookfield to the west, Spencer to the south, and Warren to the east. The town is situated on the Quaboag River, which runs through the center of town.
The town has a total area of 16.2 square miles, of which 15.9 square miles is land and 0.3 square miles is water. The highest point in the town is the summit of East Hill, which has an elevation of 845 feet. The town is located in the Quaboag Hills region of Massachusetts, which is characterized by rolling hills and valleys.
Economy
East Brookfield has a diverse economy, with a mix of manufacturing, retail, and service industries. The town is home to several large manufacturing companies, including a paper mill, a plastics factory, and a metal fabrication plant. The town also has a thriving retail sector, with several small businesses located in the downtown area.
The town is also home to several service-based businesses, including a hospital, a nursing home, and several medical offices. The town is also home to several educational institutions, including a community college and a vocational school.
Demographics
As of the 2010 census, the town of East Brookfield had a population of 4,719. The racial makeup of the town was 94.3% White, 1.3% African American, 0.3% Native American, 0.7% Asian, 0.1% Pacific Islander, 1.2% from other races, and 2.3% from two or more races. Hispanic or Latino of any race were 3.2% of the population.
The median household income in the town was $60,938, and the median family income was $68,958. The per capita income in the town was $25,945. About 6.3% of families and 8.2% of the population were below the poverty line, including 10.2% of those under age 18 and 5.2% of those age 65 or over.
Common Questions
What is the Total Population of East Brookfield?
Total Population of East Brookfield is 1,345.
What is the Total Male Population of East Brookfield?
Total Male Population of East Brookfield is 711.
What is the Total Female Population of East Brookfield?
Total Female Population of East Brookfield is 634.
What is the Ratio of Males per 100 Females in East Brookfield?
There are 112.15 Males per 100 Females in East Brookfield.
What is the Ratio of Females per 100 Males in East Brookfield?
There are 89.17 Females per 100 Males in East Brookfield.
What is the Median Population Age in East Brookfield?
Median Population Age in East Brookfield is 58.1 Years.
What is the Average Family Size in East Brookfield
Average Family Size in East Brookfield is 2.6 People.
What is the Average Household Size in East Brookfield
Average Household Size in East Brookfield is 2.4 People.
What is Per Capita Income in East Brookfield?
Per Capita income in East Brookfield is $44,055.
What is the Median Family Income in East Brookfield?
Median Family Income in East Brookfield is $97,750.
What is the Median Household income in East Brookfield?
Median Household Income in East Brookfield is $76,406.
What is Income or Wage Gap in East Brookfield?
Income or Wage Gap in East Brookfield is 4.4%.
Women in East Brookfield earn 95.6 cents for every dollar earned by a man.
What is Inequality or Gini Index in East Brookfield?
Inequality or Gini Index in East Brookfield is 0.35.
How Large is the Labor Force in East Brookfield?
There are 750 People in the Labor Forcein in East Brookfield.
What is the Percentage of People in the Labor Force in East Brookfield?
63.9% of People are in the Labor Force in East Brookfield.
What is the Unemployment Rate in East Brookfield?
Unemployment Rate in East Brookfield is 1.3%.