Cities with the Most Immigrants from Western Europe in Massachusetts
RELATED REPORTS & OPTIONS
Western Europe
Massachusetts
Compare Cities
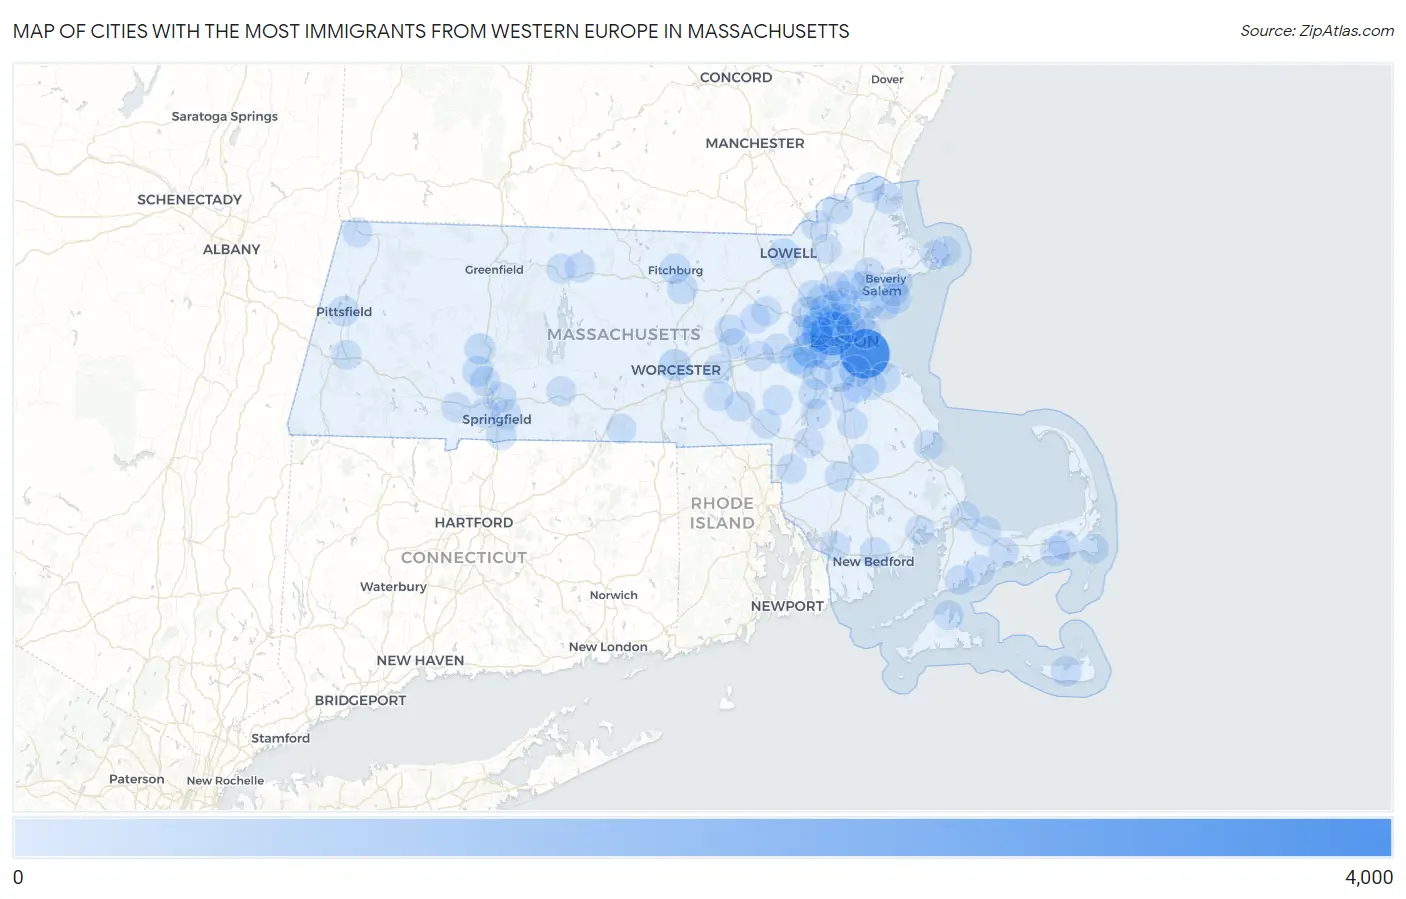
Map of Cities with the Most Immigrants from Western Europe in Massachusetts
0
4,000
Cities with the Most Immigrants from Western Europe in Massachusetts
| City | Western Europe | vs State | vs National | |
| 1. | Boston | 3,432 | 25,947(13.23%)#1 | 924,665(0.37%)#12 |
| 2. | Cambridge | 2,343 | 25,947(9.03%)#2 | 924,665(0.25%)#21 |
| 3. | Newton | 979 | 25,947(3.77%)#3 | 924,665(0.11%)#77 |
| 4. | Brookline | 919 | 25,947(3.54%)#4 | 924,665(0.10%)#85 |
| 5. | Somerville | 807 | 25,947(3.11%)#5 | 924,665(0.09%)#98 |
| 6. | Arlington | 491 | 25,947(1.89%)#6 | 924,665(0.05%)#197 |
| 7. | Belmont | 470 | 25,947(1.81%)#7 | 924,665(0.05%)#210 |
| 8. | Worcester | 383 | 25,947(1.48%)#8 | 924,665(0.04%)#279 |
| 9. | Medford | 354 | 25,947(1.36%)#9 | 924,665(0.04%)#310 |
| 10. | Lexington | 332 | 25,947(1.28%)#10 | 924,665(0.04%)#348 |
| 11. | Quincy | 325 | 25,947(1.25%)#11 | 924,665(0.04%)#359 |
| 12. | Watertown Town | 258 | 25,947(0.99%)#12 | 924,665(0.03%)#481 |
| 13. | Amherst | 248 | 25,947(0.96%)#13 | 924,665(0.03%)#512 |
| 14. | Woburn | 245 | 25,947(0.94%)#14 | 924,665(0.03%)#520 |
| 15. | Wellesley | 235 | 25,947(0.91%)#15 | 924,665(0.03%)#552 |
| 16. | Winchester | 199 | 25,947(0.77%)#16 | 924,665(0.02%)#659 |
| 17. | Milton | 190 | 25,947(0.73%)#17 | 924,665(0.02%)#705 |
| 18. | Northampton | 189 | 25,947(0.73%)#18 | 924,665(0.02%)#716 |
| 19. | Leominster | 180 | 25,947(0.69%)#19 | 924,665(0.02%)#749 |
| 20. | Lynn | 163 | 25,947(0.63%)#20 | 924,665(0.02%)#832 |
| 21. | Revere | 162 | 25,947(0.62%)#21 | 924,665(0.02%)#840 |
| 22. | Peabody | 162 | 25,947(0.62%)#22 | 924,665(0.02%)#841 |
| 23. | Needham | 162 | 25,947(0.62%)#23 | 924,665(0.02%)#842 |
| 24. | Melrose | 159 | 25,947(0.61%)#24 | 924,665(0.02%)#857 |
| 25. | Easthampton Town | 158 | 25,947(0.61%)#25 | 924,665(0.02%)#863 |
| 26. | Lowell | 155 | 25,947(0.60%)#26 | 924,665(0.02%)#879 |
| 27. | Fitchburg | 152 | 25,947(0.59%)#27 | 924,665(0.02%)#897 |
| 28. | Hingham | 147 | 25,947(0.57%)#28 | 924,665(0.02%)#937 |
| 29. | Waltham | 146 | 25,947(0.56%)#29 | 924,665(0.02%)#938 |
| 30. | Norwood | 143 | 25,947(0.55%)#30 | 924,665(0.02%)#967 |
| 31. | Pittsfield | 139 | 25,947(0.54%)#31 | 924,665(0.02%)#997 |
| 32. | Springfield | 135 | 25,947(0.52%)#32 | 924,665(0.01%)#1,023 |
| 33. | Nantucket | 124 | 25,947(0.48%)#33 | 924,665(0.01%)#1,122 |
| 34. | New Bedford | 121 | 25,947(0.47%)#34 | 924,665(0.01%)#1,136 |
| 35. | Haverhill | 113 | 25,947(0.44%)#35 | 924,665(0.01%)#1,233 |
| 36. | Holyoke | 111 | 25,947(0.43%)#36 | 924,665(0.01%)#1,254 |
| 37. | Brockton | 110 | 25,947(0.42%)#37 | 924,665(0.01%)#1,263 |
| 38. | Marlborough | 109 | 25,947(0.42%)#38 | 924,665(0.01%)#1,278 |
| 39. | Newburyport | 108 | 25,947(0.42%)#39 | 924,665(0.01%)#1,300 |
| 40. | Hudson | 104 | 25,947(0.40%)#40 | 924,665(0.01%)#1,346 |
| 41. | Milford | 102 | 25,947(0.39%)#41 | 924,665(0.01%)#1,370 |
| 42. | Dedham | 101 | 25,947(0.39%)#42 | 924,665(0.01%)#1,392 |
| 43. | Taunton | 99 | 25,947(0.38%)#43 | 924,665(0.01%)#1,412 |
| 44. | Barnstable Town | 90 | 25,947(0.35%)#44 | 924,665(0.01%)#1,520 |
| 45. | Chicopee | 89 | 25,947(0.34%)#45 | 924,665(0.01%)#1,535 |
| 46. | Framingham | 85 | 25,947(0.33%)#46 | 924,665(0.01%)#1,599 |
| 47. | Mansfield Center | 85 | 25,947(0.33%)#47 | 924,665(0.01%)#1,612 |
| 48. | Methuen Town | 79 | 25,947(0.30%)#48 | 924,665(0.01%)#1,709 |
| 49. | Wakefield | 79 | 25,947(0.30%)#49 | 924,665(0.01%)#1,715 |
| 50. | Marblehead | 77 | 25,947(0.30%)#50 | 924,665(0.01%)#1,763 |
| 51. | Sharon | 76 | 25,947(0.29%)#51 | 924,665(0.01%)#1,789 |
| 52. | West Springfield Town | 73 | 25,947(0.28%)#52 | 924,665(0.01%)#1,824 |
| 53. | Malden | 71 | 25,947(0.27%)#53 | 924,665(0.01%)#1,870 |
| 54. | Longmeadow | 71 | 25,947(0.27%)#54 | 924,665(0.01%)#1,880 |
| 55. | Westfield | 69 | 25,947(0.27%)#55 | 924,665(0.01%)#1,923 |
| 56. | Beverly | 66 | 25,947(0.25%)#56 | 924,665(0.01%)#1,992 |
| 57. | Cochituate | 61 | 25,947(0.24%)#57 | 924,665(0.01%)#2,154 |
| 58. | Millis Clicquot | 61 | 25,947(0.24%)#58 | 924,665(0.01%)#2,159 |
| 59. | Gloucester | 60 | 25,947(0.23%)#59 | 924,665(0.01%)#2,168 |
| 60. | Swampscott | 59 | 25,947(0.23%)#60 | 924,665(0.01%)#2,206 |
| 61. | Fall River | 56 | 25,947(0.22%)#61 | 924,665(0.01%)#2,280 |
| 62. | Maynard | 56 | 25,947(0.22%)#62 | 924,665(0.01%)#2,302 |
| 63. | Burlington | 54 | 25,947(0.21%)#63 | 924,665(0.01%)#2,359 |
| 64. | Winthrop Town | 51 | 25,947(0.20%)#64 | 924,665(0.01%)#2,478 |
| 65. | West Warren | 51 | 25,947(0.20%)#65 | 924,665(0.01%)#2,502 |
| 66. | Mashpee Neck | 47 | 25,947(0.18%)#66 | 924,665(0.01%)#2,638 |
| 67. | Danvers | 46 | 25,947(0.18%)#67 | 924,665(0.00%)#2,645 |
| 68. | Athol | 46 | 25,947(0.18%)#68 | 924,665(0.00%)#2,668 |
| 69. | Westborough | 46 | 25,947(0.18%)#69 | 924,665(0.00%)#2,679 |
| 70. | Dennis Port | 45 | 25,947(0.17%)#70 | 924,665(0.00%)#2,723 |
| 71. | Stoneham | 43 | 25,947(0.17%)#71 | 924,665(0.00%)#2,789 |
| 72. | Lee | 43 | 25,947(0.17%)#72 | 924,665(0.00%)#2,819 |
| 73. | Salem | 41 | 25,947(0.16%)#73 | 924,665(0.00%)#2,877 |
| 74. | Franklin Town | 41 | 25,947(0.16%)#74 | 924,665(0.00%)#2,878 |
| 75. | Rockport | 41 | 25,947(0.16%)#75 | 924,665(0.00%)#2,911 |
| 76. | Chelsea | 40 | 25,947(0.15%)#76 | 924,665(0.00%)#2,926 |
| 77. | North Attleborough | 39 | 25,947(0.15%)#77 | 924,665(0.00%)#2,975 |
| 78. | Lynnfield | 39 | 25,947(0.15%)#78 | 924,665(0.00%)#2,995 |
| 79. | South Duxbury | 39 | 25,947(0.15%)#79 | 924,665(0.00%)#3,017 |
| 80. | Attleboro | 38 | 25,947(0.15%)#80 | 924,665(0.00%)#3,032 |
| 81. | Reading | 38 | 25,947(0.15%)#81 | 924,665(0.00%)#3,039 |
| 82. | Andover | 38 | 25,947(0.15%)#82 | 924,665(0.00%)#3,064 |
| 83. | Weymouth Town | 36 | 25,947(0.14%)#83 | 924,665(0.00%)#3,153 |
| 84. | Braintree Town | 36 | 25,947(0.14%)#84 | 924,665(0.00%)#3,155 |
| 85. | Southbridge Town | 36 | 25,947(0.14%)#85 | 924,665(0.00%)#3,170 |
| 86. | Amesbury Town | 36 | 25,947(0.14%)#86 | 924,665(0.00%)#3,171 |
| 87. | Williamstown | 36 | 25,947(0.14%)#87 | 924,665(0.00%)#3,201 |
| 88. | Chatham | 36 | 25,947(0.14%)#88 | 924,665(0.00%)#3,208 |
| 89. | Randolph Town | 33 | 25,947(0.13%)#89 | 924,665(0.00%)#3,327 |
| 90. | East Falmouth | 33 | 25,947(0.13%)#90 | 924,665(0.00%)#3,358 |
| 91. | Palmer Town | 32 | 25,947(0.12%)#91 | 924,665(0.00%)#3,406 |
| 92. | West Concord | 32 | 25,947(0.12%)#92 | 924,665(0.00%)#3,423 |
| 93. | Orange | 32 | 25,947(0.12%)#93 | 924,665(0.00%)#3,437 |
| 94. | Bridgewater Town | 31 | 25,947(0.12%)#94 | 924,665(0.00%)#3,462 |
| 95. | Northwest Harwich | 30 | 25,947(0.12%)#95 | 924,665(0.00%)#3,596 |
| 96. | East Sandwich | 30 | 25,947(0.12%)#96 | 924,665(0.00%)#3,597 |
| 97. | Vineyard Haven | 30 | 25,947(0.12%)#97 | 924,665(0.00%)#3,602 |
| 98. | Sagamore | 29 | 25,947(0.11%)#98 | 924,665(0.00%)#3,671 |
| 99. | Weweantic | 28 | 25,947(0.11%)#99 | 924,665(0.00%)#3,762 |
| 100. | Upton | 27 | 25,947(0.10%)#100 | 924,665(0.00%)#3,836 |
Common Questions
What are the Top 10 Cities with the Most Immigrants from Western Europe in Massachusetts?
Top 10 Cities with the Most Immigrants from Western Europe in Massachusetts are:
What city has the Most Immigrants from Western Europe in Massachusetts?
Boston has the Most Immigrants from Western Europe in Massachusetts with 3,432.
What is the Total Immigrants from Western Europe in the State of Massachusetts?
Total Immigrants from Western Europe in Massachusetts is 25,947.
What is the Total Immigrants from Western Europe in the United States?
Total Immigrants from Western Europe in the United States is 924,665.