Littleton Common, MA
Littleton Common Map
Littleton Common Overview
2,870
TOTAL POPULATION
1,304
MALE POPULATION
1,566
FEMALE POPULATION
83.27
MALES / 100 FEMALES
120.09
FEMALES / 100 MALES
41.2
MEDIAN AGE
3.0
AVG FAMILY SIZE
2.5
AVG HOUSEHOLD SIZE
$55,219
PER CAPITA INCOME
$144,732
AVG FAMILY INCOME
$122,854
AVG HOUSEHOLD INCOME
39.5%
WAGE / INCOME GAP [ % ]
60.5¢/ $1
WAGE / INCOME GAP [ $ ]
0.36
INEQUALITY / GINI INDEX
1,494
LABOR FORCE [ PEOPLE ]
63.1%
PERCENT IN LABOR FORCE
9.1%
UNEMPLOYMENT RATE
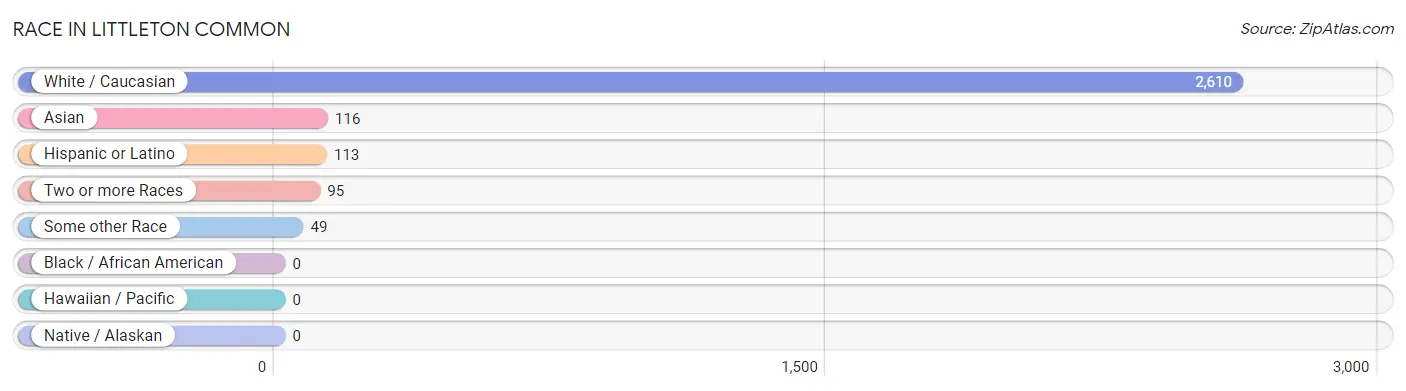
Race in Littleton Common
The most populous races in Littleton Common are White / Caucasian (2,610 | 90.9%), Asian (116 | 4.0%), and Hispanic or Latino (113 | 3.9%).
| Race | # Population | % Population |
| Asian | 116 | 4.0% |
| Black / African American | 0 | 0.0% |
| Hawaiian / Pacific | 0 | 0.0% |
| Hispanic or Latino | 113 | 3.9% |
| Native / Alaskan | 0 | 0.0% |
| White / Caucasian | 2,610 | 90.9% |
| Two or more Races | 95 | 3.3% |
| Some other Race | 49 | 1.7% |
| Total | 2,870 | 100.0% |
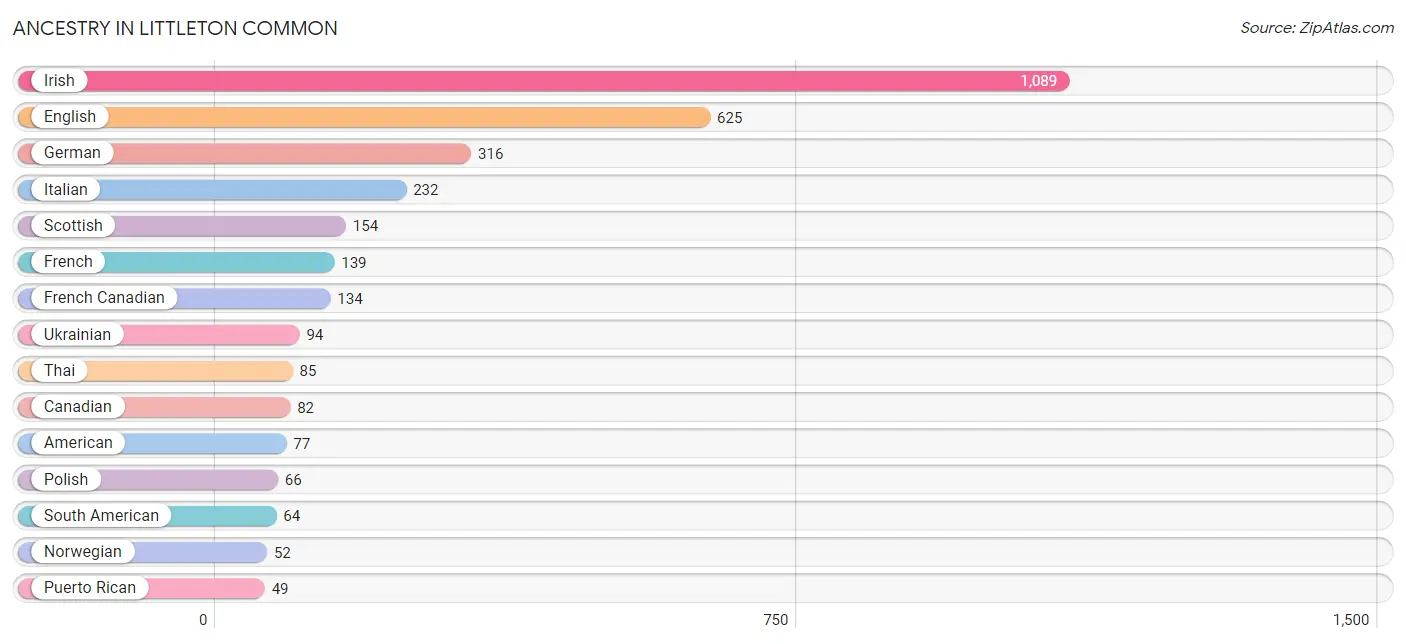
Ancestry in Littleton Common
The most populous ancestries reported in Littleton Common are Irish (1,089 | 37.9%), English (625 | 21.8%), German (316 | 11.0%), Italian (232 | 8.1%), and Scottish (154 | 5.4%), together accounting for 84.2% of all Littleton Common residents.
| Ancestry | # Population | % Population |
| American | 77 | 2.7% |
| Arab | 16 | 0.6% |
| Austrian | 17 | 0.6% |
| British | 48 | 1.7% |
| Canadian | 82 | 2.9% |
| Colombian | 32 | 1.1% |
| Danish | 44 | 1.5% |
| Dutch | 34 | 1.2% |
| English | 625 | 21.8% |
| European | 42 | 1.5% |
| French | 139 | 4.8% |
| French Canadian | 134 | 4.7% |
| German | 316 | 11.0% |
| Guyanese | 2 | 0.1% |
| Hungarian | 17 | 0.6% |
| Indian (Asian) | 31 | 1.1% |
| Irish | 1,089 | 37.9% |
| Italian | 232 | 8.1% |
| Lebanese | 16 | 0.6% |
| Lithuanian | 44 | 1.5% |
| Norwegian | 52 | 1.8% |
| Polish | 66 | 2.3% |
| Puerto Rican | 49 | 1.7% |
| Romanian | 16 | 0.6% |
| Scandinavian | 17 | 0.6% |
| Scottish | 154 | 5.4% |
| South American | 64 | 2.2% |
| Swedish | 17 | 0.6% |
| Thai | 85 | 3.0% |
| Ukrainian | 94 | 3.3% |
| Venezuelan | 32 | 1.1% | View All 31 Rows |
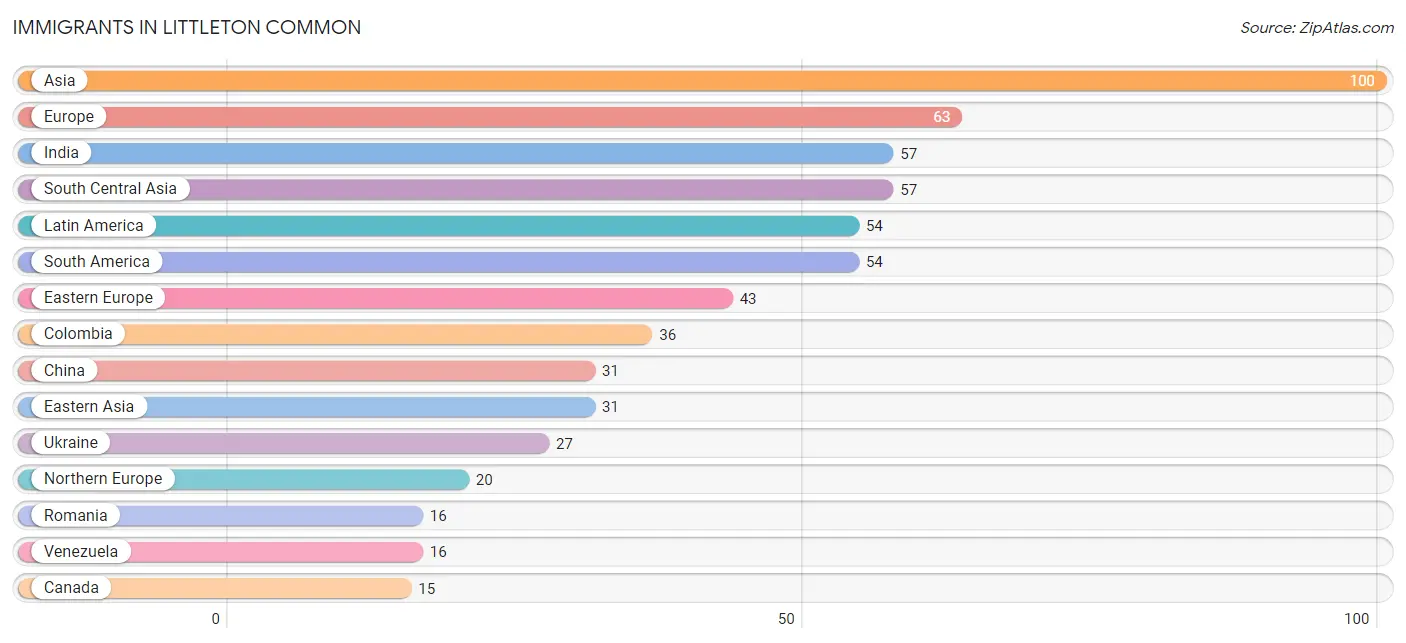
Immigrants in Littleton Common
The most numerous immigrant groups reported in Littleton Common came from Asia (100 | 3.5%), Europe (63 | 2.2%), India (57 | 2.0%), South Central Asia (57 | 2.0%), and Latin America (54 | 1.9%), together accounting for 11.5% of all Littleton Common residents.
| Immigration Origin | # Population | % Population |
| Asia | 100 | 3.5% |
| Canada | 15 | 0.5% |
| China | 31 | 1.1% |
| Colombia | 36 | 1.3% |
| Eastern Asia | 31 | 1.1% |
| Eastern Europe | 43 | 1.5% |
| Europe | 63 | 2.2% |
| Guyana | 2 | 0.1% |
| India | 57 | 2.0% |
| Israel | 12 | 0.4% |
| Latin America | 54 | 1.9% |
| Northern Europe | 20 | 0.7% |
| Romania | 16 | 0.6% |
| South America | 54 | 1.9% |
| South Central Asia | 57 | 2.0% |
| Ukraine | 27 | 0.9% |
| Venezuela | 16 | 0.6% |
| Western Asia | 12 | 0.4% | View All 18 Rows |
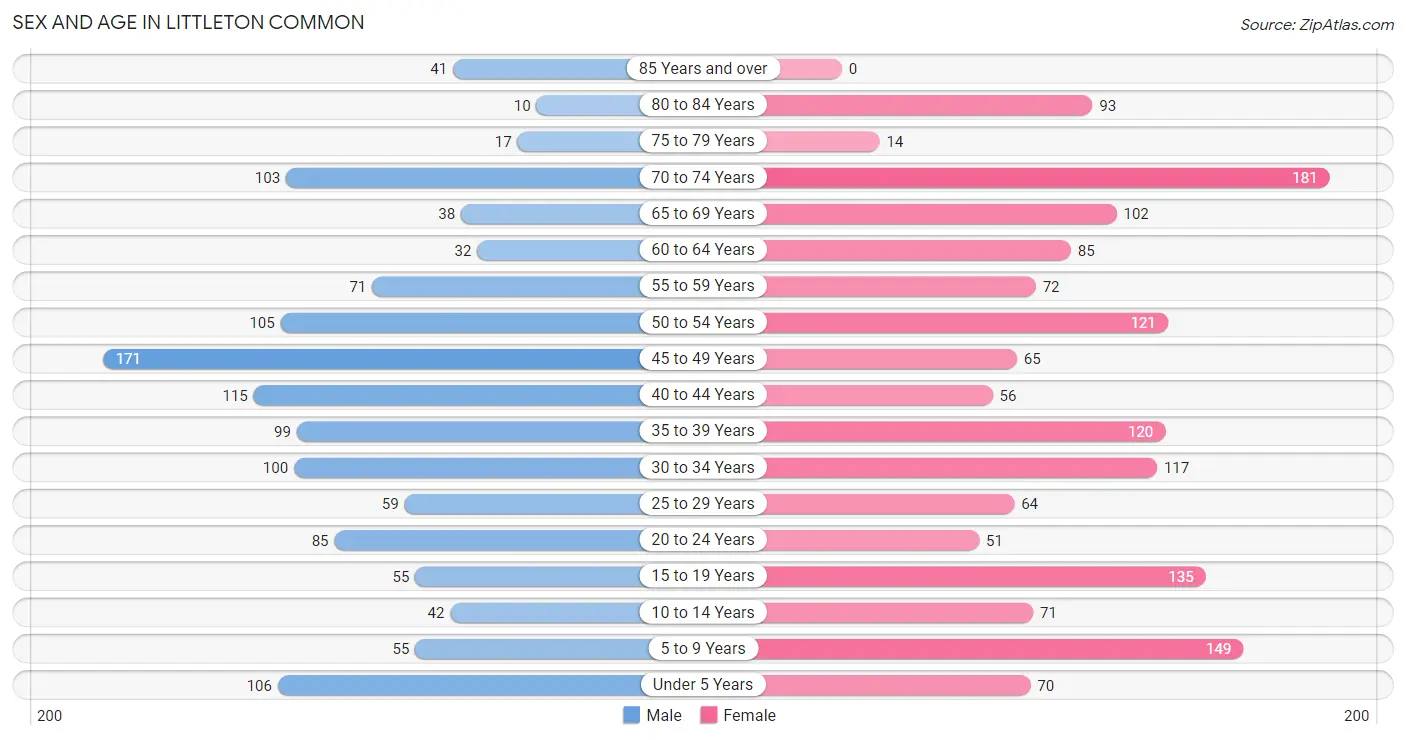
Sex and Age in Littleton Common
Sex and Age in Littleton Common
The most populous age groups in Littleton Common are 45 to 49 Years (171 | 13.1%) for men and 70 to 74 Years (181 | 11.6%) for women.
| Age Bracket | Male | Female |
| Under 5 Years | 106 (8.1%) | 70 (4.5%) |
| 5 to 9 Years | 55 (4.2%) | 149 (9.5%) |
| 10 to 14 Years | 42 (3.2%) | 71 (4.5%) |
| 15 to 19 Years | 55 (4.2%) | 135 (8.6%) |
| 20 to 24 Years | 85 (6.5%) | 51 (3.3%) |
| 25 to 29 Years | 59 (4.5%) | 64 (4.1%) |
| 30 to 34 Years | 100 (7.7%) | 117 (7.5%) |
| 35 to 39 Years | 99 (7.6%) | 120 (7.7%) |
| 40 to 44 Years | 115 (8.8%) | 56 (3.6%) |
| 45 to 49 Years | 171 (13.1%) | 65 (4.2%) |
| 50 to 54 Years | 105 (8.1%) | 121 (7.7%) |
| 55 to 59 Years | 71 (5.4%) | 72 (4.6%) |
| 60 to 64 Years | 32 (2.5%) | 85 (5.4%) |
| 65 to 69 Years | 38 (2.9%) | 102 (6.5%) |
| 70 to 74 Years | 103 (7.9%) | 181 (11.6%) |
| 75 to 79 Years | 17 (1.3%) | 14 (0.9%) |
| 80 to 84 Years | 10 (0.8%) | 93 (5.9%) |
| 85 Years and over | 41 (3.1%) | 0 (0.0%) |
| Total | 1,304 (100.0%) | 1,566 (100.0%) |
Families and Households in Littleton Common
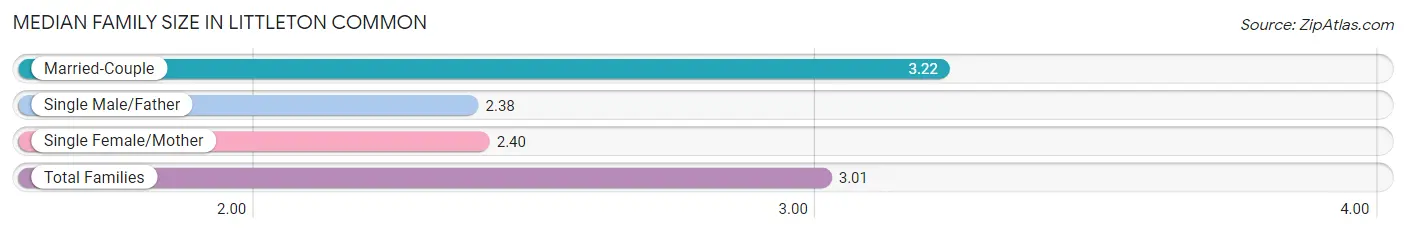
Median Family Size in Littleton Common
The median family size in Littleton Common is 3.01 persons per family, with married-couple families (623 | 75.1%) accounting for the largest median family size of 3.22 persons per family. On the other hand, single male/father families (42 | 5.1%) represent the smallest median family size with 2.38 persons per family.
| Family Type | # Families | Family Size |
| Married-Couple | 623 (75.1%) | 3.22 |
| Single Male/Father | 42 (5.1%) | 2.38 |
| Single Female/Mother | 164 (19.8%) | 2.40 |
| Total Families | 829 (100.0%) | 3.01 |
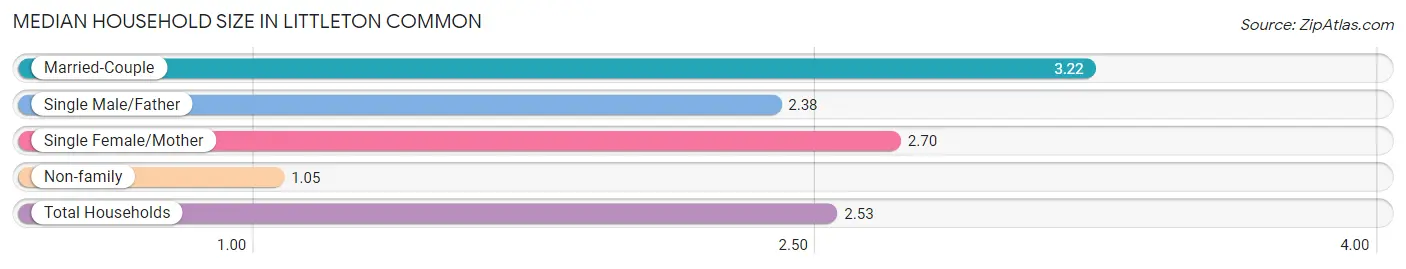
Median Household Size in Littleton Common
The median household size in Littleton Common is 2.53 persons per household, with married-couple households (623 | 55.2%) accounting for the largest median household size of 3.22 persons per household. non-family households (300 | 26.6%) represent the smallest median household size with 1.05 persons per household.
| Household Type | # Households | Household Size |
| Married-Couple | 623 (55.2%) | 3.22 |
| Single Male/Father | 42 (3.7%) | 2.38 |
| Single Female/Mother | 164 (14.5%) | 2.70 |
| Non-family | 300 (26.6%) | 1.05 |
| Total Households | 1,129 (100.0%) | 2.53 |
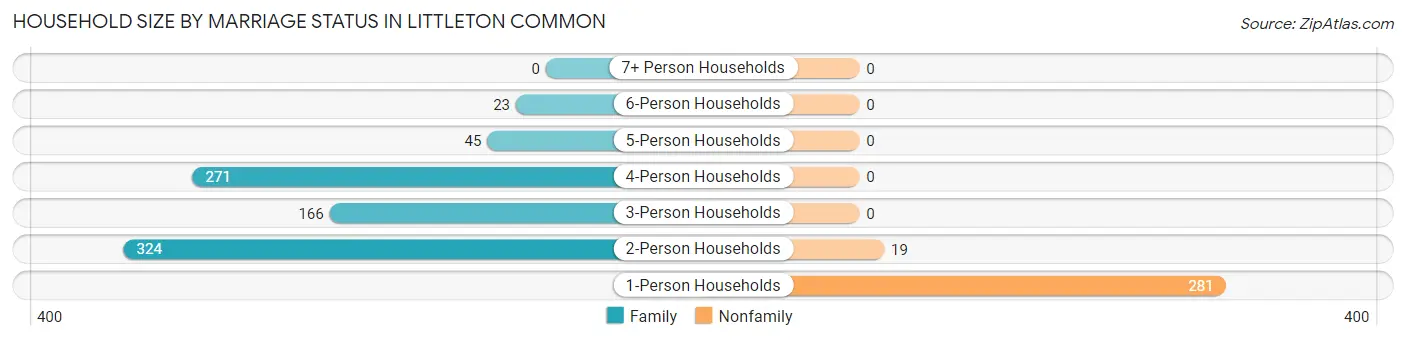
Household Size by Marriage Status in Littleton Common
Out of a total of 1,129 households in Littleton Common, 829 (73.4%) are family households, while 300 (26.6%) are nonfamily households. The most numerous type of family households are 2-person households, comprising 324, and the most common type of nonfamily households are 1-person households, comprising 281.
| Household Size | Family Households | Nonfamily Households |
| 1-Person Households | - | 281 (24.9%) |
| 2-Person Households | 324 (28.7%) | 19 (1.7%) |
| 3-Person Households | 166 (14.7%) | 0 (0.0%) |
| 4-Person Households | 271 (24.0%) | 0 (0.0%) |
| 5-Person Households | 45 (4.0%) | 0 (0.0%) |
| 6-Person Households | 23 (2.0%) | 0 (0.0%) |
| 7+ Person Households | 0 (0.0%) | 0 (0.0%) |
| Total | 829 (73.4%) | 300 (26.6%) |
Female Fertility in Littleton Common
Fertility by Age in Littleton Common
Average fertility rate in Littleton Common is 48.0 births per 1,000 women. Women in the age bracket of 20 to 34 years have the highest fertility rate with 129.0 births per 1,000 women. Women in the age bracket of 20 to 34 years acount for 100.0% of all women with births.
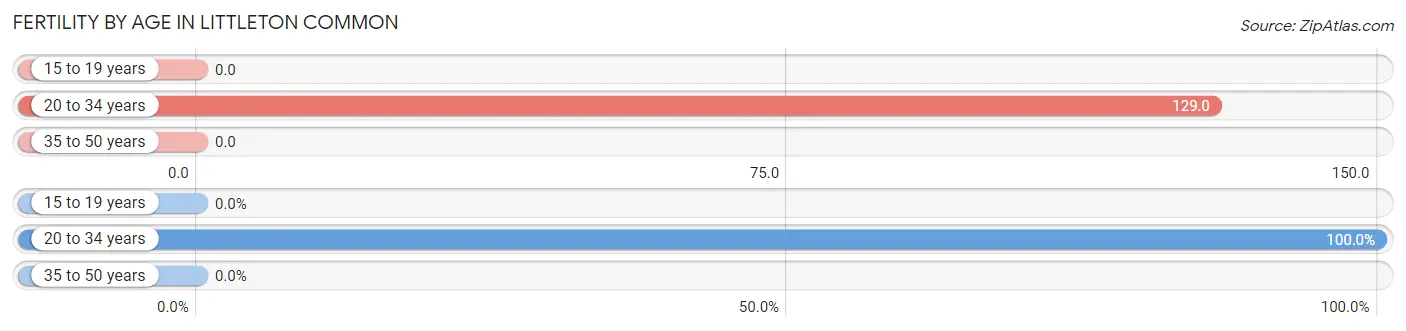
| Age Bracket | Women with Births | Births / 1,000 Women |
| 15 to 19 years | 0 (0.0%) | 0.0 |
| 20 to 34 years | 30 (100.0%) | 129.0 |
| 35 to 50 years | 0 (0.0%) | 0.0 |
| Total | 30 (100.0%) | 48.0 |
Fertility by Age by Marriage Status in Littleton Common
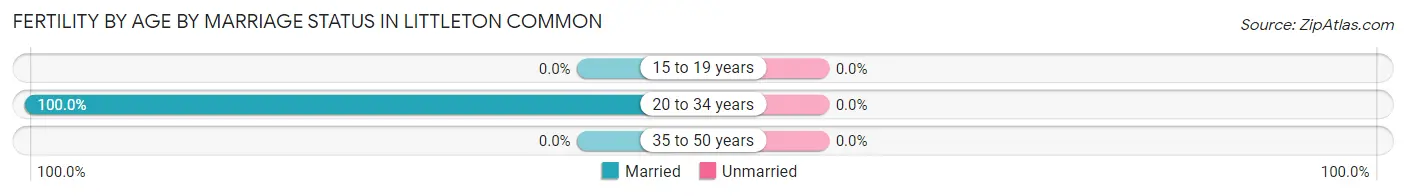
| Age Bracket | Married | Unmarried |
| 15 to 19 years | 0 (0.0%) | 0 (0.0%) |
| 20 to 34 years | 30 (100.0%) | 0 (0.0%) |
| 35 to 50 years | 0 (0.0%) | 0 (0.0%) |
| Total | 30 (100.0%) | 0 (0.0%) |
Fertility by Education in Littleton Common
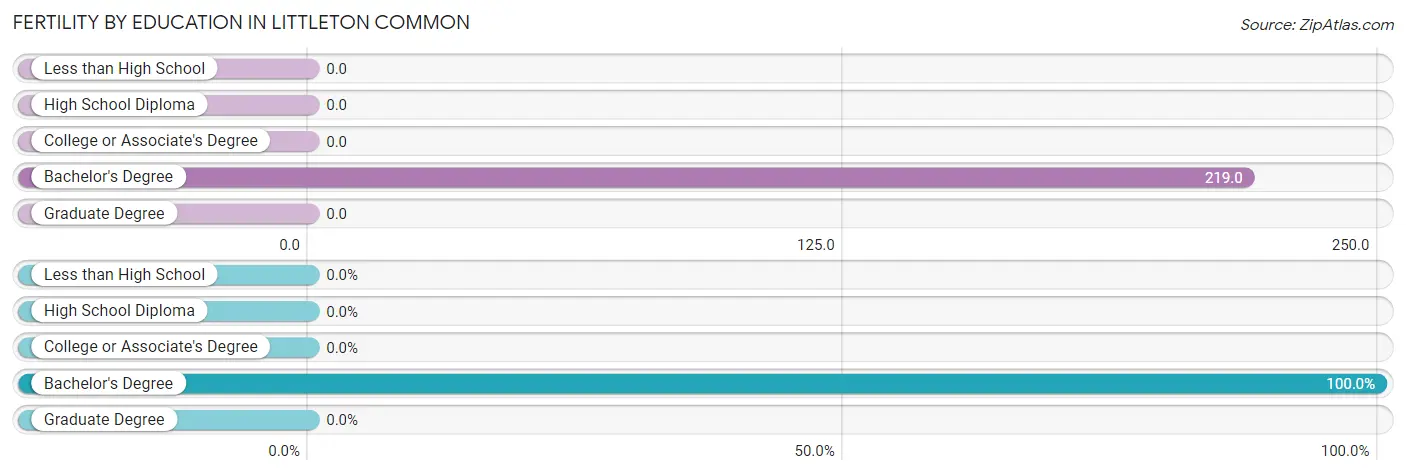
| Educational Attainment | Women with Births | Births / 1,000 Women |
| Less than High School | 0 (0.0%) | 0.0 |
| High School Diploma | 0 (0.0%) | 0.0 |
| College or Associate's Degree | 0 (0.0%) | 0.0 |
| Bachelor's Degree | 30 (100.0%) | 219.0 |
| Graduate Degree | 0 (0.0%) | 0.0 |
| Total | 30 (100.0%) | 48.0 |
Fertility by Education by Marriage Status in Littleton Common
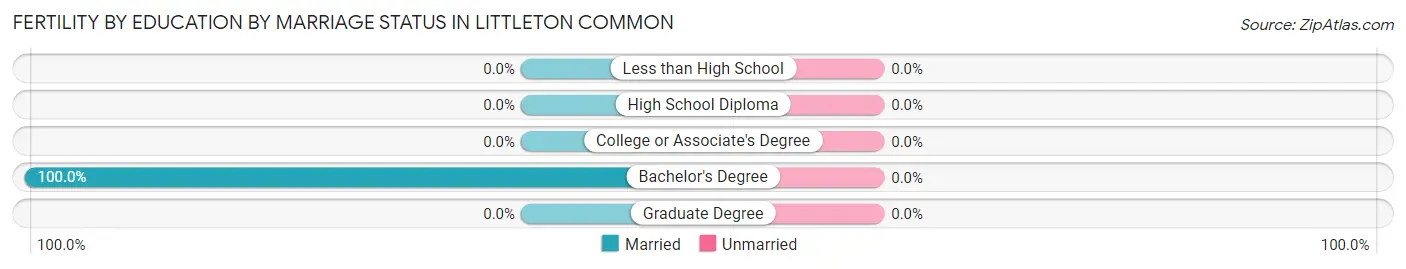
| Educational Attainment | Married | Unmarried |
| Less than High School | 0 (0.0%) | 0 (0.0%) |
| High School Diploma | 0 (0.0%) | 0 (0.0%) |
| College or Associate's Degree | 0 (0.0%) | 0 (0.0%) |
| Bachelor's Degree | 30 (100.0%) | 0 (0.0%) |
| Graduate Degree | 0 (0.0%) | 0 (0.0%) |
| Total | 30 (100.0%) | 0 (0.0%) |
Income in Littleton Common
Income Overview in Littleton Common
Per Capita Income in Littleton Common is $55,219, while median incomes of families and households are $144,732 and $122,854 respectively.
| Characteristic | Number | Measure |
| Per Capita Income | 2,870 | $55,219 |
| Median Family Income | 829 | $144,732 |
| Mean Family Income | 829 | $153,212 |
| Median Household Income | 1,129 | $122,854 |
| Mean Household Income | 1,129 | $140,659 |
| Income Deficit | 829 | $0 |
| Wage / Income Gap (%) | 2,870 | 39.50% |
| Wage / Income Gap ($) | 2,870 | 60.50¢ per $1 |
| Gini / Inequality Index | 2,870 | 0.36 |
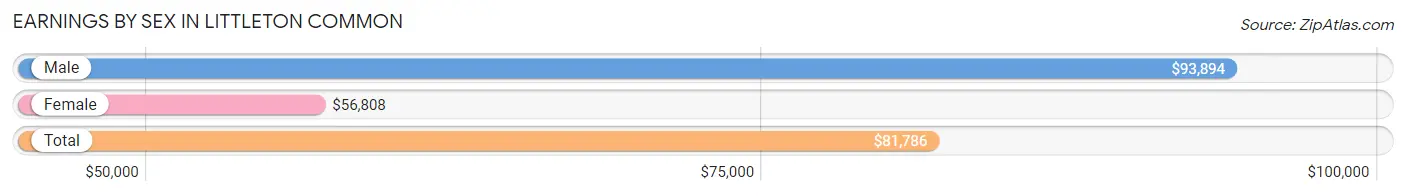
Earnings by Sex in Littleton Common
Average Earnings in Littleton Common are $81,786, $93,894 for men and $56,808 for women, a difference of 39.5%.
| Sex | Number | Average Earnings |
| Male | 859 (54.4%) | $93,894 |
| Female | 719 (45.6%) | $56,808 |
| Total | 1,578 (100.0%) | $81,786 |
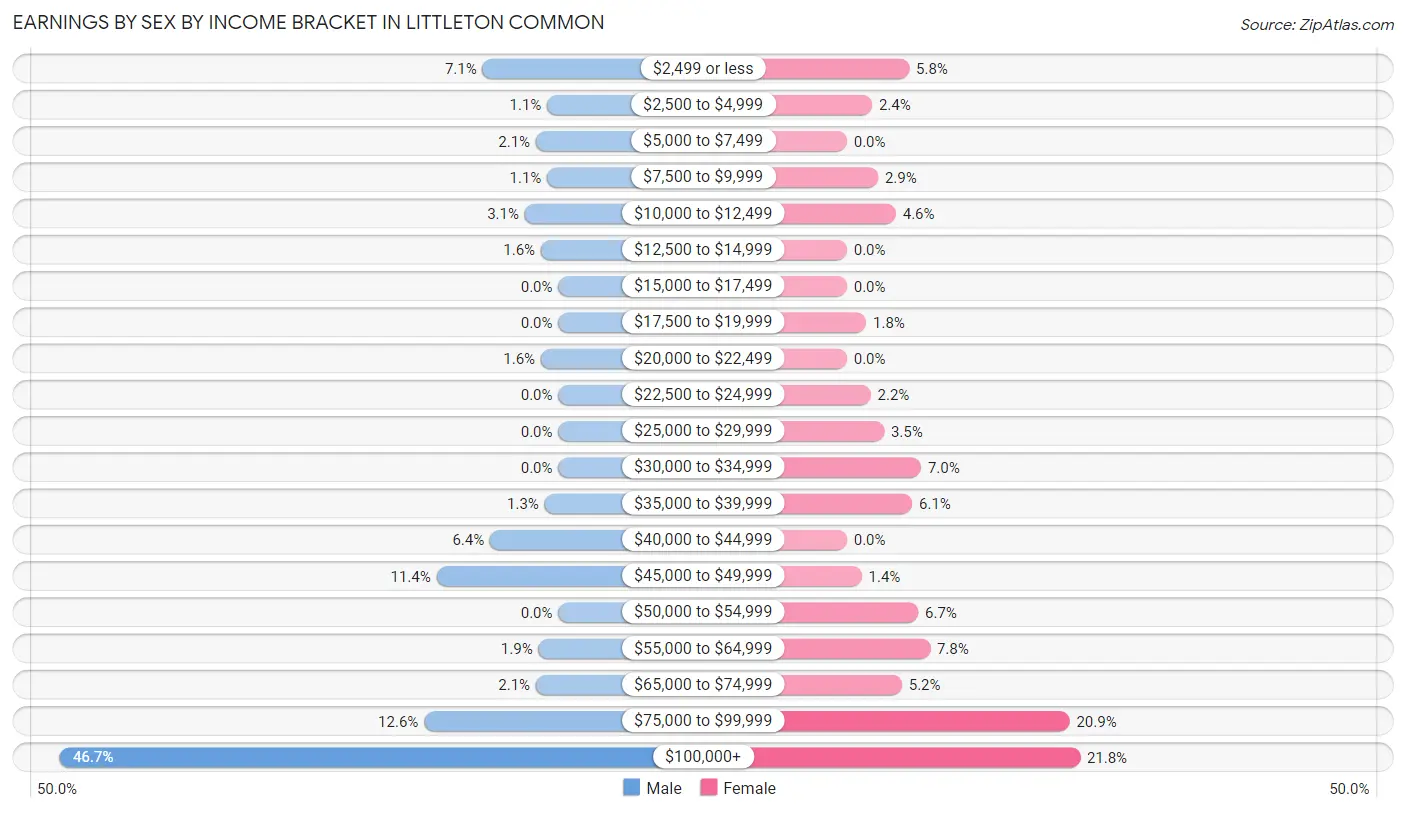
Earnings by Sex by Income Bracket in Littleton Common
The most common earnings brackets in Littleton Common are $100,000+ for men (401 | 46.7%) and $100,000+ for women (157 | 21.8%).
| Income | Male | Female |
| $2,499 or less | 61 (7.1%) | 42 (5.8%) |
| $2,500 to $4,999 | 9 (1.1%) | 17 (2.4%) |
| $5,000 to $7,499 | 18 (2.1%) | 0 (0.0%) |
| $7,500 to $9,999 | 9 (1.1%) | 21 (2.9%) |
| $10,000 to $12,499 | 27 (3.1%) | 33 (4.6%) |
| $12,500 to $14,999 | 14 (1.6%) | 0 (0.0%) |
| $15,000 to $17,499 | 0 (0.0%) | 0 (0.0%) |
| $17,500 to $19,999 | 0 (0.0%) | 13 (1.8%) |
| $20,000 to $22,499 | 14 (1.6%) | 0 (0.0%) |
| $22,500 to $24,999 | 0 (0.0%) | 16 (2.2%) |
| $25,000 to $29,999 | 0 (0.0%) | 25 (3.5%) |
| $30,000 to $34,999 | 0 (0.0%) | 50 (7.0%) |
| $35,000 to $39,999 | 11 (1.3%) | 44 (6.1%) |
| $40,000 to $44,999 | 55 (6.4%) | 0 (0.0%) |
| $45,000 to $49,999 | 98 (11.4%) | 10 (1.4%) |
| $50,000 to $54,999 | 0 (0.0%) | 48 (6.7%) |
| $55,000 to $64,999 | 16 (1.9%) | 56 (7.8%) |
| $65,000 to $74,999 | 18 (2.1%) | 37 (5.1%) |
| $75,000 to $99,999 | 108 (12.6%) | 150 (20.9%) |
| $100,000+ | 401 (46.7%) | 157 (21.8%) |
| Total | 859 (100.0%) | 719 (100.0%) |
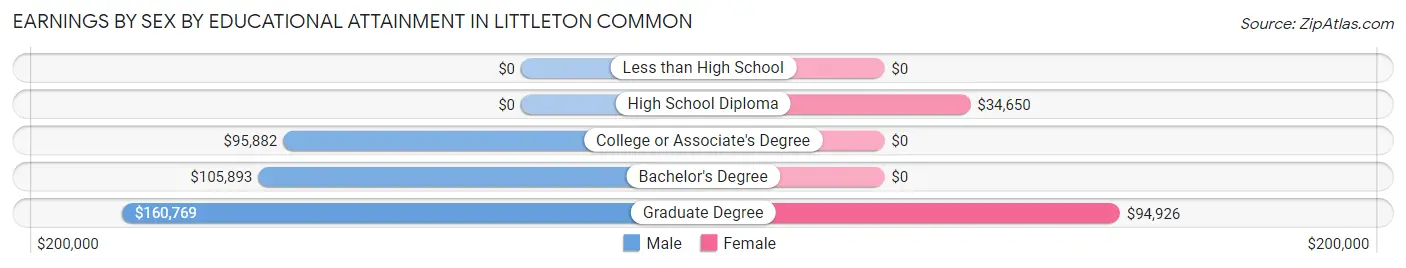
Earnings by Sex by Educational Attainment in Littleton Common
Average earnings in Littleton Common are $107,227 for men and $56,987 for women, a difference of 46.9%. Men with an educational attainment of graduate degree enjoy the highest average annual earnings of $160,769, while those with college or associate's degree education earn the least with $95,882. Women with an educational attainment of graduate degree earn the most with the average annual earnings of $94,926, while those with high school diploma education have the smallest earnings of $34,650.
| Educational Attainment | Male Income | Female Income |
| Less than High School | - | - |
| High School Diploma | - | - |
| College or Associate's Degree | $95,882 | $0 |
| Bachelor's Degree | $105,893 | $0 |
| Graduate Degree | $160,769 | $94,926 |
| Total | $107,227 | $56,987 |
Family Income in Littleton Common
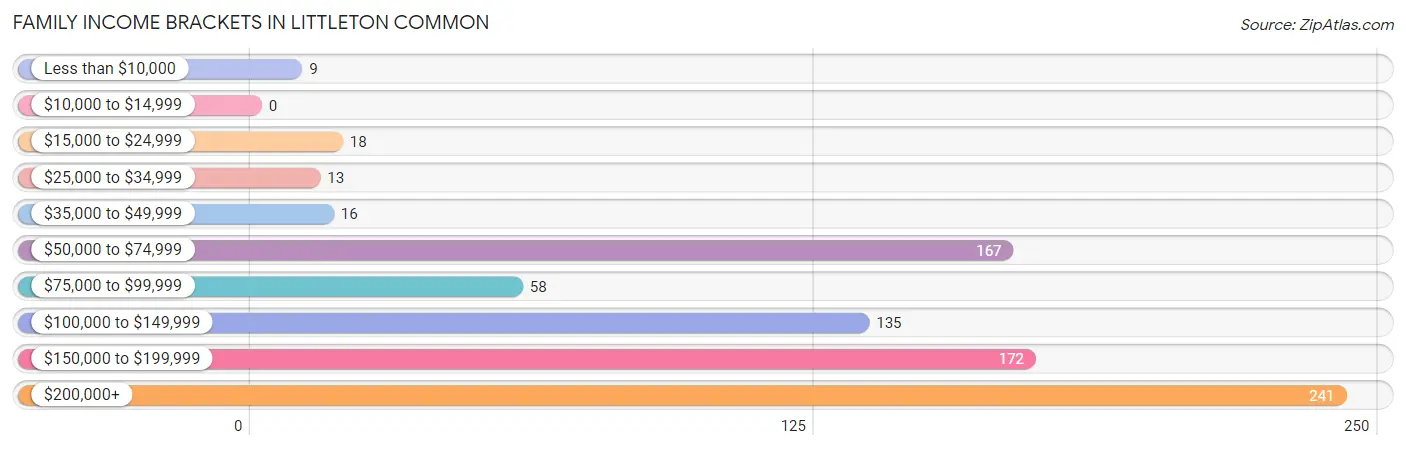
Family Income Brackets in Littleton Common
According to the Littleton Common family income data, there are 241 families falling into the $200,000+ income range, which is the most common income bracket and makes up 29.1% of all families.
| Income Bracket | # Families | % Families |
| Less than $10,000 | 9 | 1.1% |
| $10,000 to $14,999 | 0 | 0.0% |
| $15,000 to $24,999 | 18 | 2.2% |
| $25,000 to $34,999 | 13 | 1.6% |
| $35,000 to $49,999 | 16 | 1.9% |
| $50,000 to $74,999 | 167 | 20.1% |
| $75,000 to $99,999 | 58 | 7.0% |
| $100,000 to $149,999 | 135 | 16.3% |
| $150,000 to $199,999 | 172 | 20.7% |
| $200,000+ | 241 | 29.1% |
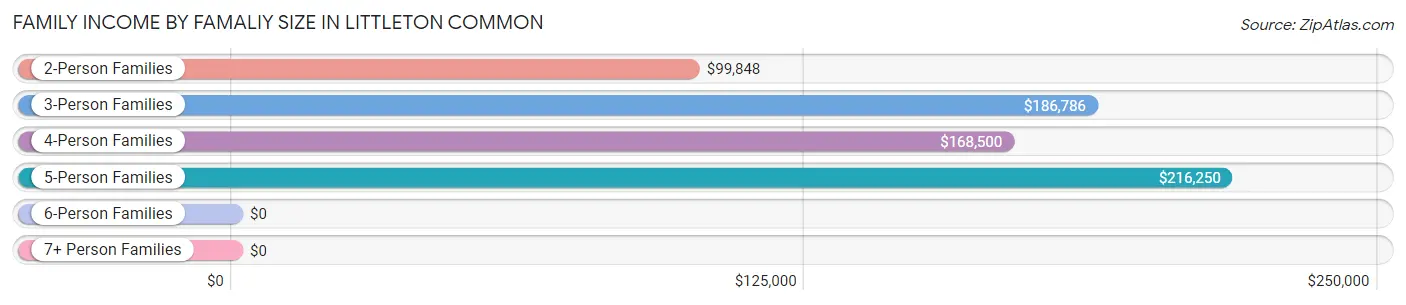
Family Income by Famaliy Size in Littleton Common
5-person families (45 | 5.4%) account for the highest median family income in Littleton Common with $216,250 per family, while 3-person families (166 | 20.0%) have the highest median income of $62,262 per family member.
| Income Bracket | # Families | Median Income |
| 2-Person Families | 324 (39.1%) | $99,848 |
| 3-Person Families | 166 (20.0%) | $186,786 |
| 4-Person Families | 294 (35.5%) | $168,500 |
| 5-Person Families | 45 (5.4%) | $216,250 |
| 6-Person Families | 0 (0.0%) | $0 |
| 7+ Person Families | 0 (0.0%) | $0 |
| Total | 829 (100.0%) | $144,732 |
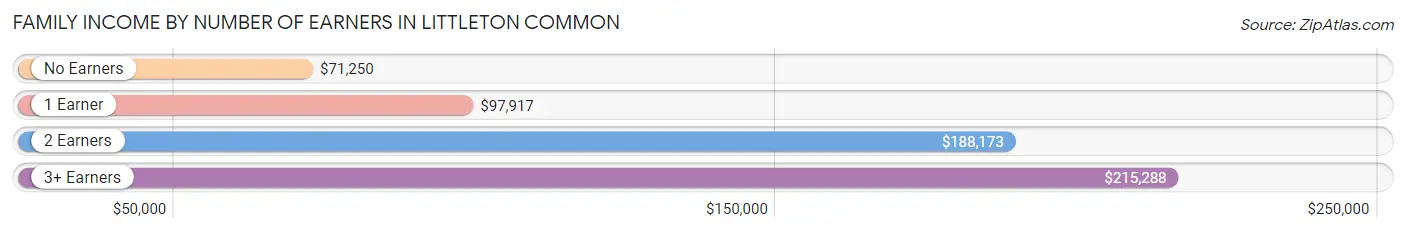
Family Income by Number of Earners in Littleton Common
The median family income in Littleton Common is $144,732, with families comprising 3+ earners (93) having the highest median family income of $215,288, while families with no earners (68) have the lowest median family income of $71,250, accounting for 11.2% and 8.2% of families, respectively.
| Number of Earners | # Families | Median Income |
| No Earners | 68 (8.2%) | $71,250 |
| 1 Earner | 343 (41.4%) | $97,917 |
| 2 Earners | 325 (39.2%) | $188,173 |
| 3+ Earners | 93 (11.2%) | $215,288 |
| Total | 829 (100.0%) | $144,732 |
Household Income in Littleton Common
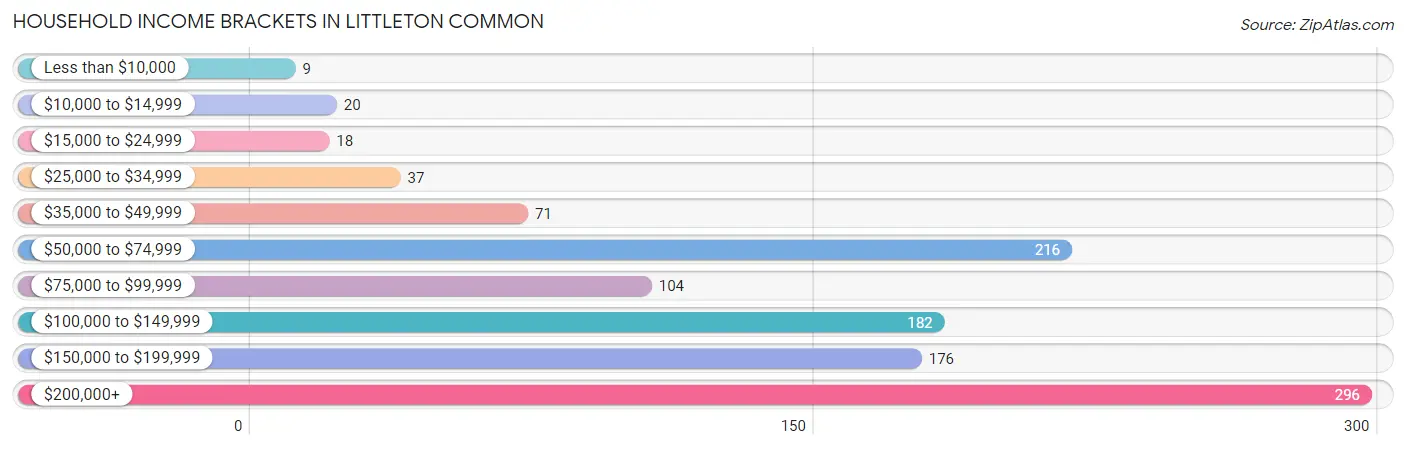
Household Income Brackets in Littleton Common
With 296 households falling in the category, the $200,000+ income range is the most frequent in Littleton Common, accounting for 26.2% of all households. In contrast, only 9 households (0.8%) fall into the less than $10,000 income bracket, making it the least populous group.
| Income Bracket | # Households | % Households |
| Less than $10,000 | 9 | 0.8% |
| $10,000 to $14,999 | 20 | 1.8% |
| $15,000 to $24,999 | 18 | 1.6% |
| $25,000 to $34,999 | 37 | 3.3% |
| $35,000 to $49,999 | 71 | 6.3% |
| $50,000 to $74,999 | 216 | 19.1% |
| $75,000 to $99,999 | 104 | 9.2% |
| $100,000 to $149,999 | 182 | 16.1% |
| $150,000 to $199,999 | 176 | 15.6% |
| $200,000+ | 296 | 26.2% |
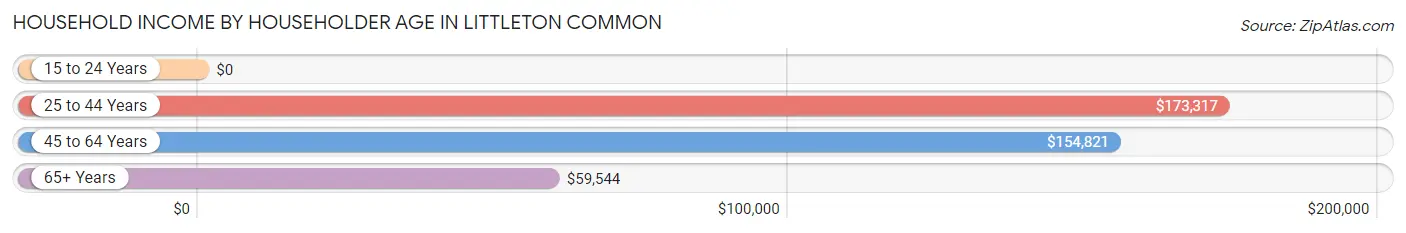
Household Income by Householder Age in Littleton Common
The median household income in Littleton Common is $122,854, with the highest median household income of $173,317 found in the 25 to 44 years age bracket for the primary householder. A total of 323 households (28.6%) fall into this category. Meanwhile, the 15 to 24 years age bracket for the primary householder has the lowest median household income of $0, with 15 households (1.3%) in this group.
| Income Bracket | # Households | Median Income |
| 15 to 24 Years | 15 (1.3%) | $0 |
| 25 to 44 Years | 323 (28.6%) | $173,317 |
| 45 to 64 Years | 364 (32.2%) | $154,821 |
| 65+ Years | 427 (37.8%) | $59,544 |
| Total | 1,129 (100.0%) | $122,854 |
Poverty in Littleton Common
Income Below Poverty by Sex and Age in Littleton Common
With 5.3% poverty level for males and 4.3% for females among the residents of Littleton Common, 65 to 74 year old males and 15 year old females are the most vulnerable to poverty, with 17 males (12.1%) and 9 females (100.0%) in their respective age groups living below the poverty level.
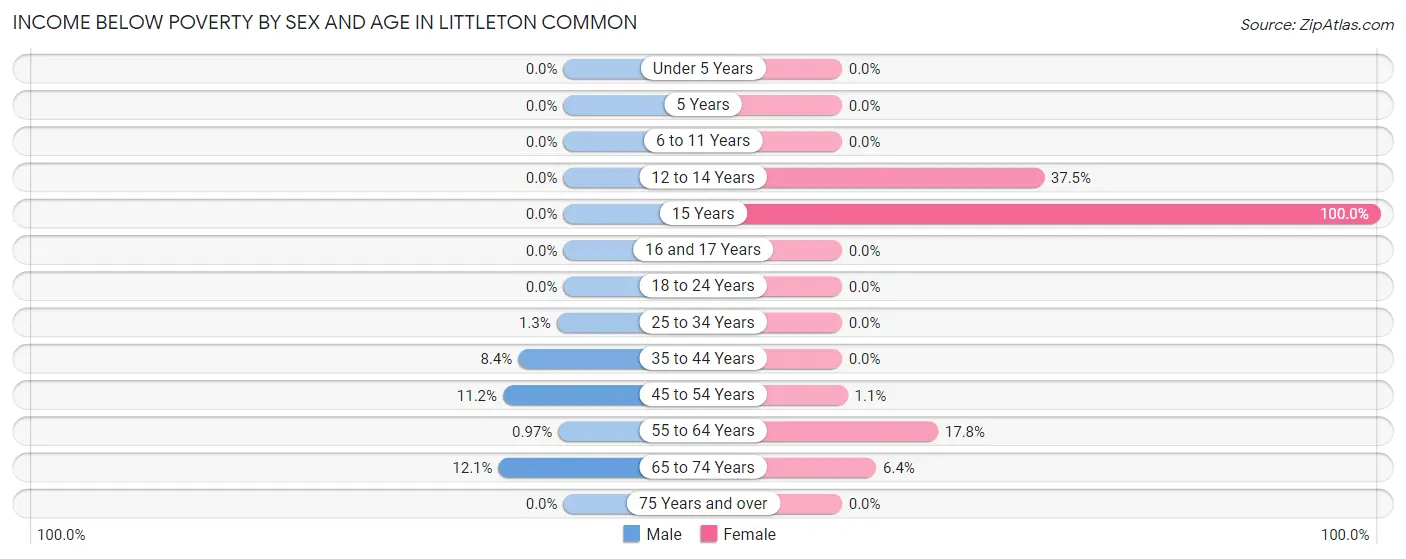
| Age Bracket | Male | Female |
| Under 5 Years | 0 (0.0%) | 0 (0.0%) |
| 5 Years | 0 (0.0%) | 0 (0.0%) |
| 6 to 11 Years | 0 (0.0%) | 0 (0.0%) |
| 12 to 14 Years | 0 (0.0%) | 9 (37.5%) |
| 15 Years | 0 (0.0%) | 9 (100.0%) |
| 16 and 17 Years | 0 (0.0%) | 0 (0.0%) |
| 18 to 24 Years | 0 (0.0%) | 0 (0.0%) |
| 25 to 34 Years | 2 (1.3%) | 0 (0.0%) |
| 35 to 44 Years | 18 (8.4%) | 0 (0.0%) |
| 45 to 54 Years | 31 (11.2%) | 2 (1.1%) |
| 55 to 64 Years | 1 (1.0%) | 28 (17.8%) |
| 65 to 74 Years | 17 (12.1%) | 18 (6.4%) |
| 75 Years and over | 0 (0.0%) | 0 (0.0%) |
| Total | 69 (5.3%) | 66 (4.3%) |
Income Above Poverty by Sex and Age in Littleton Common
According to the poverty statistics in Littleton Common, males aged under 5 years and females aged under 5 years are the age groups that are most secure financially, with 100.0% of males and 100.0% of females in these age groups living above the poverty line.
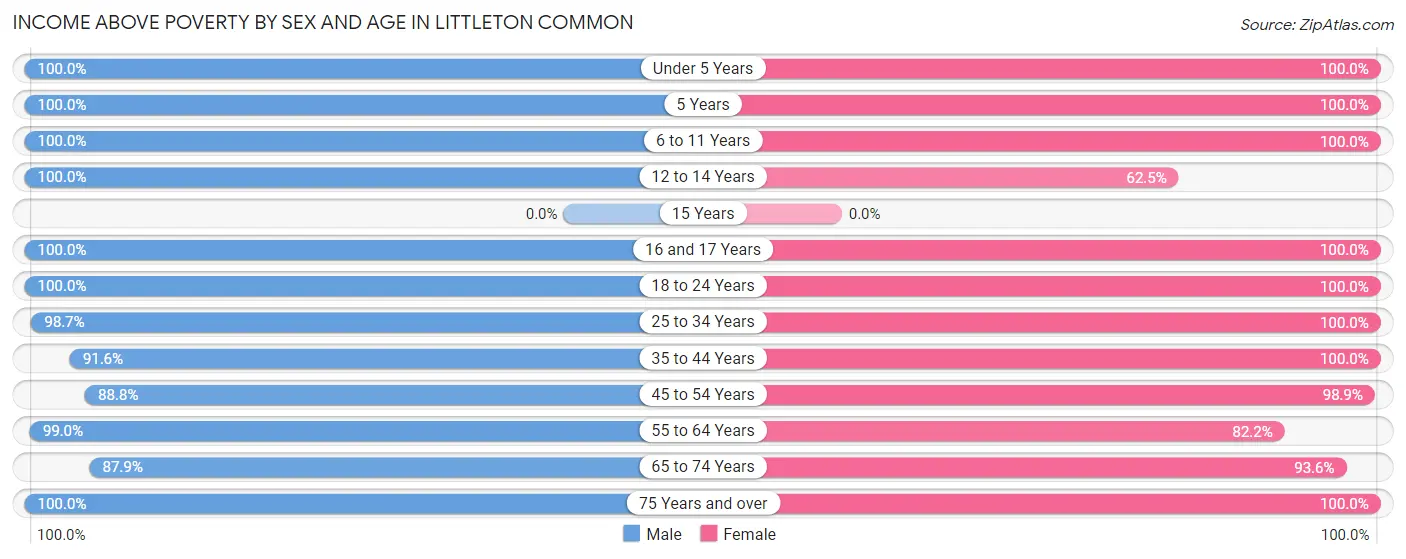
| Age Bracket | Male | Female |
| Under 5 Years | 106 (100.0%) | 70 (100.0%) |
| 5 Years | 3 (100.0%) | 64 (100.0%) |
| 6 to 11 Years | 52 (100.0%) | 109 (100.0%) |
| 12 to 14 Years | 42 (100.0%) | 15 (62.5%) |
| 15 Years | 0 (0.0%) | 0 (0.0%) |
| 16 and 17 Years | 12 (100.0%) | 109 (100.0%) |
| 18 to 24 Years | 128 (100.0%) | 68 (100.0%) |
| 25 to 34 Years | 157 (98.7%) | 181 (100.0%) |
| 35 to 44 Years | 196 (91.6%) | 176 (100.0%) |
| 45 to 54 Years | 245 (88.8%) | 184 (98.9%) |
| 55 to 64 Years | 102 (99.0%) | 129 (82.2%) |
| 65 to 74 Years | 124 (87.9%) | 265 (93.6%) |
| 75 Years and over | 68 (100.0%) | 107 (100.0%) |
| Total | 1,235 (94.7%) | 1,477 (95.7%) |
Income Below Poverty Among Married-Couple Families in Littleton Common
The poverty statistics for married-couple families in Littleton Common show that 4.3% or 27 of the total 623 families live below the poverty line. Families with no children have the highest poverty rate of 7.3%, comprising of 18 families. On the other hand, families with 3 or 4 children have the lowest poverty rate of 0.0%, which includes 0 families.
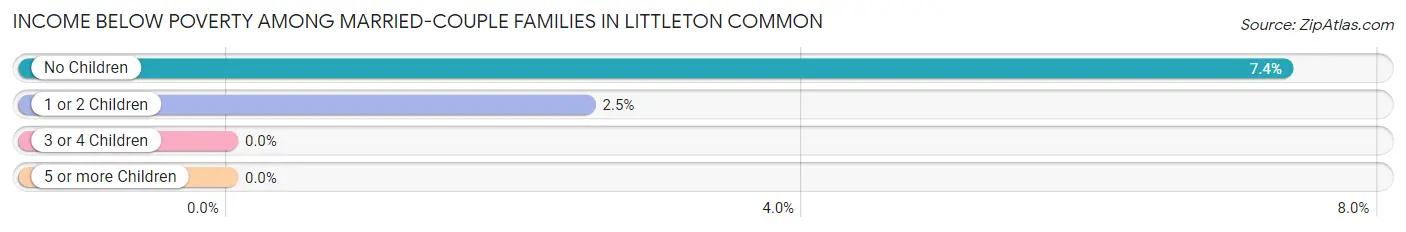
| Children | Above Poverty | Below Poverty |
| No Children | 227 (92.6%) | 18 (7.3%) |
| 1 or 2 Children | 353 (97.5%) | 9 (2.5%) |
| 3 or 4 Children | 16 (100.0%) | 0 (0.0%) |
| 5 or more Children | 0 (0.0%) | 0 (0.0%) |
| Total | 596 (95.7%) | 27 (4.3%) |
Income Below Poverty Among Single-Parent Households in Littleton Common
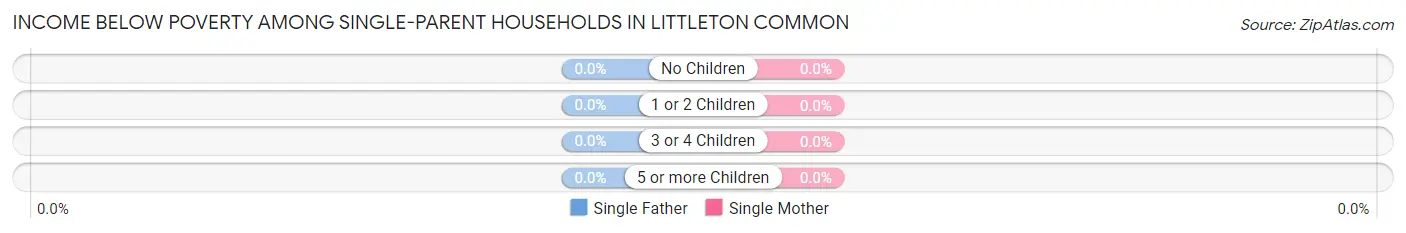
| Children | Single Father | Single Mother |
| No Children | 0 (0.0%) | 0 (0.0%) |
| 1 or 2 Children | 0 (0.0%) | 0 (0.0%) |
| 3 or 4 Children | 0 (0.0%) | 0 (0.0%) |
| 5 or more Children | 0 (0.0%) | 0 (0.0%) |
| Total | 0 (0.0%) | 0 (0.0%) |
Income Below Poverty Among Married-Couple vs Single-Parent Households in Littleton Common
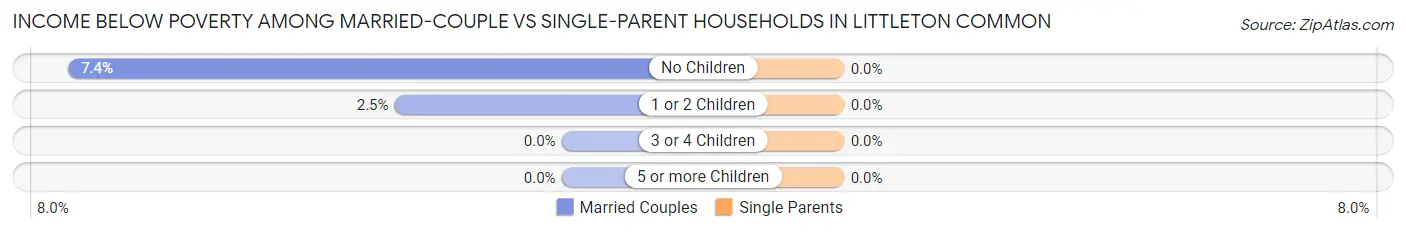
| Children | Married-Couple Families | Single-Parent Households |
| No Children | 18 (7.3%) | 0 (0.0%) |
| 1 or 2 Children | 9 (2.5%) | 0 (0.0%) |
| 3 or 4 Children | 0 (0.0%) | 0 (0.0%) |
| 5 or more Children | 0 (0.0%) | 0 (0.0%) |
| Total | 27 (4.3%) | 0 (0.0%) |
Employment Characteristics in Littleton Common
Employment by Class of Employer in Littleton Common
Among the 1,343 employed individuals in Littleton Common, private company employees (962 | 71.6%), local government employees (141 | 10.5%), and not-for-profit organizations (88 | 6.6%) make up the most common classes of employment.
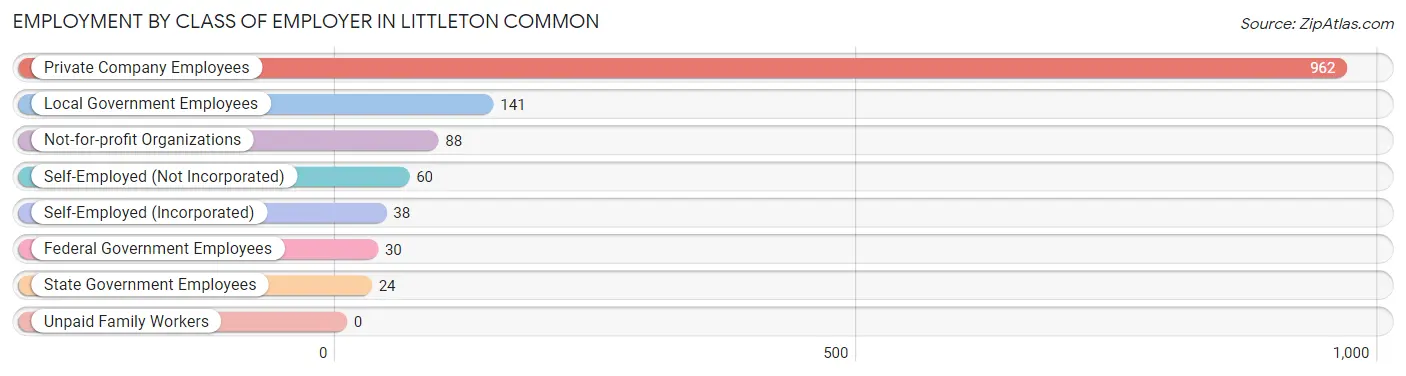
| Employer Class | # Employees | % Employees |
| Private Company Employees | 962 | 71.6% |
| Self-Employed (Incorporated) | 38 | 2.8% |
| Self-Employed (Not Incorporated) | 60 | 4.5% |
| Not-for-profit Organizations | 88 | 6.6% |
| Local Government Employees | 141 | 10.5% |
| State Government Employees | 24 | 1.8% |
| Federal Government Employees | 30 | 2.2% |
| Unpaid Family Workers | 0 | 0.0% |
| Total | 1,343 | 100.0% |
Employment Status by Age in Littleton Common
According to the labor force statistics for Littleton Common, out of the total population over 16 years of age (2,368), 63.1% or 1,494 individuals are in the labor force, with 9.1% or 136 of them unemployed. The age group with the highest labor force participation rate is 55 to 59 years, with 93.7% or 134 individuals in the labor force. Within the labor force, the 65 to 74 years age range has the highest percentage of unemployed individuals, with 31.1% or 41 of them being unemployed.
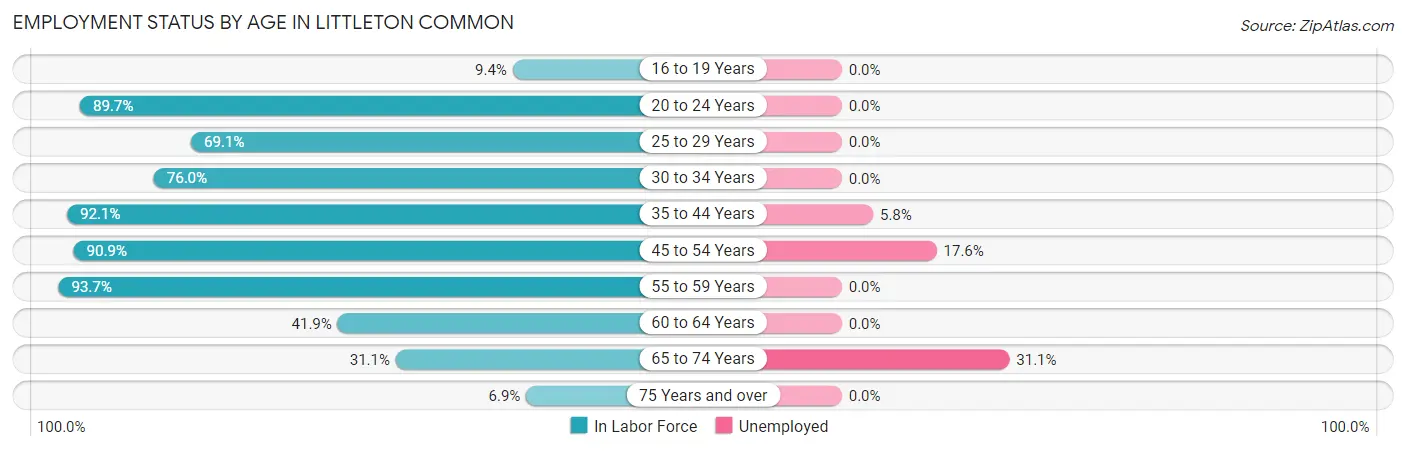
| Age Bracket | In Labor Force | Unemployed |
| 16 to 19 Years | 17 (9.4%) | 0 (0.0%) |
| 20 to 24 Years | 122 (89.7%) | 0 (0.0%) |
| 25 to 29 Years | 85 (69.1%) | 0 (0.0%) |
| 30 to 34 Years | 165 (76.0%) | 0 (0.0%) |
| 35 to 44 Years | 359 (92.1%) | 21 (5.8%) |
| 45 to 54 Years | 420 (90.9%) | 74 (17.6%) |
| 55 to 59 Years | 134 (93.7%) | 0 (0.0%) |
| 60 to 64 Years | 49 (41.9%) | 0 (0.0%) |
| 65 to 74 Years | 132 (31.1%) | 41 (31.1%) |
| 75 Years and over | 12 (6.9%) | 0 (0.0%) |
| Total | 1,494 (63.1%) | 136 (9.1%) |
Employment Status by Educational Attainment in Littleton Common
According to labor force statistics for Littleton Common, 83.5% of individuals (1,212) out of the total population between 25 and 64 years of age (1,452) are in the labor force, with 7.8% or 95 of them being unemployed. The group with the highest labor force participation rate are those with the educational attainment of bachelor's degree or higher, with 92.0% or 714 individuals in the labor force. Within the labor force, individuals with high school diploma education have the highest percentage of unemployment, with 31.0% or 92 of them being unemployed.
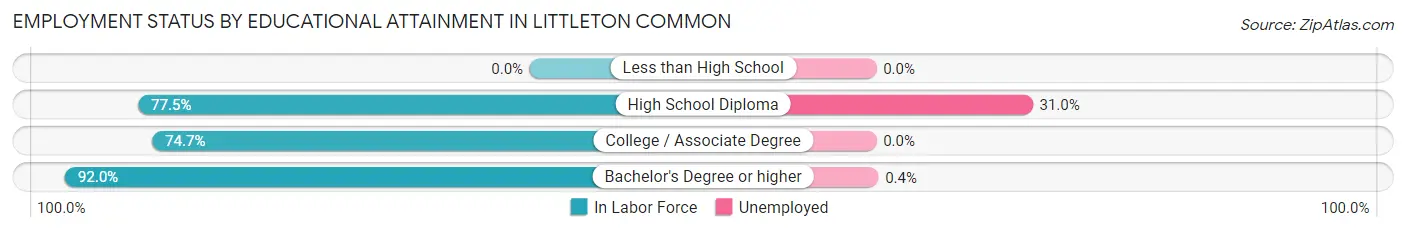
| Educational Attainment | In Labor Force | Unemployed |
| Less than High School | 0 (0.0%) | 0 (0.0%) |
| High School Diploma | 297 (77.5%) | 119 (31.0%) |
| College / Associate Degree | 201 (74.7%) | 0 (0.0%) |
| Bachelor's Degree or higher | 714 (92.0%) | 3 (0.4%) |
| Total | 1,212 (83.5%) | 113 (7.8%) |
Employment Occupations by Sex in Littleton Common
Management, Business, Science and Arts Occupations
The most common Management, Business, Science and Arts occupations in Littleton Common are Community & Social Service (240 | 17.7%), Management (232 | 17.1%), Computers, Engineering & Science (227 | 16.7%), Education Instruction & Library (172 | 12.7%), and Computers & Mathematics (112 | 8.2%).

Management, Business, Science and Arts Occupations by Sex
Within the Management, Business, Science and Arts occupations in Littleton Common, the most male-oriented occupations are Computers & Mathematics (86.6%), Management (68.1%), and Computers, Engineering & Science (61.7%), while the most female-oriented occupations are Business & Financial (100.0%), Education, Arts & Media (100.0%), and Health Technologists (100.0%).
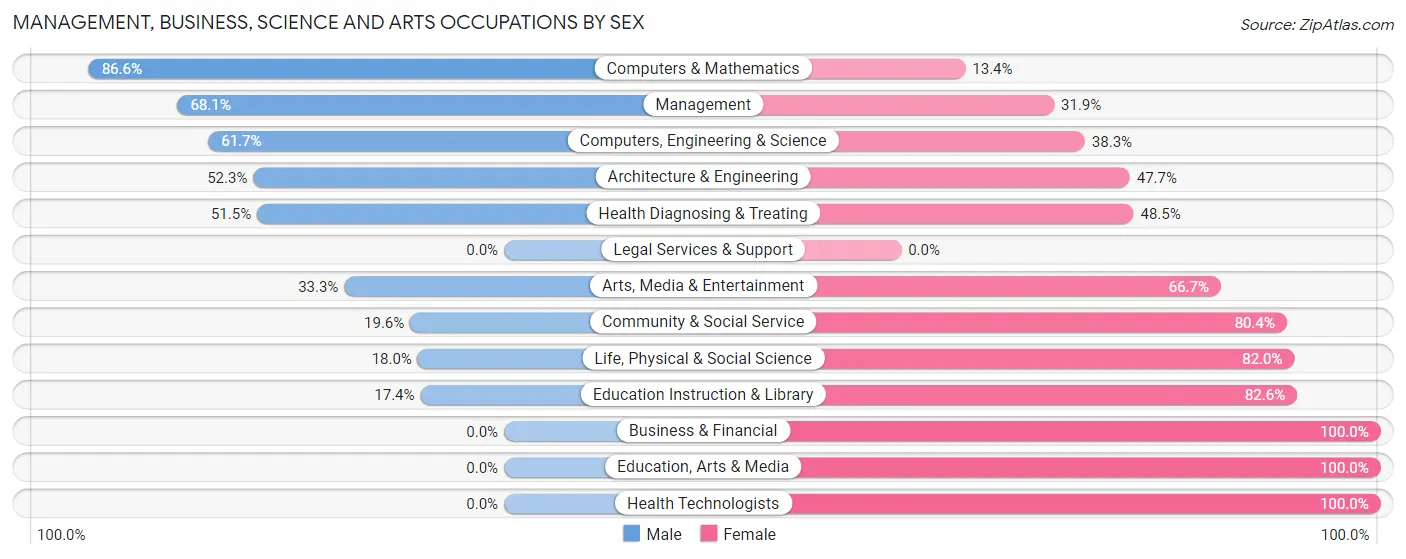
| Occupation | Male | Female |
| Management | 158 (68.1%) | 74 (31.9%) |
| Business & Financial | 0 (0.0%) | 12 (100.0%) |
| Computers, Engineering & Science | 140 (61.7%) | 87 (38.3%) |
| Computers & Mathematics | 97 (86.6%) | 15 (13.4%) |
| Architecture & Engineering | 34 (52.3%) | 31 (47.7%) |
| Life, Physical & Social Science | 9 (18.0%) | 41 (82.0%) |
| Community & Social Service | 47 (19.6%) | 193 (80.4%) |
| Education, Arts & Media | 0 (0.0%) | 17 (100.0%) |
| Legal Services & Support | 0 (0.0%) | 0 (0.0%) |
| Education Instruction & Library | 30 (17.4%) | 142 (82.6%) |
| Arts, Media & Entertainment | 17 (33.3%) | 34 (66.7%) |
| Health Diagnosing & Treating | 17 (51.5%) | 16 (48.5%) |
| Health Technologists | 0 (0.0%) | 16 (100.0%) |
| Total (Category) | 362 (48.7%) | 382 (51.3%) |
| Total (Overall) | 715 (52.6%) | 644 (47.4%) |
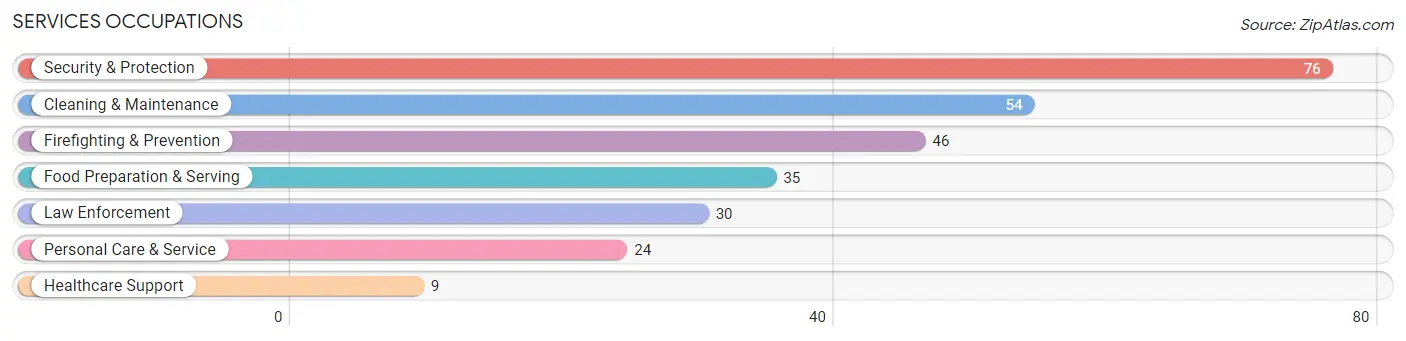
Services Occupations
The most common Services occupations in Littleton Common are Security & Protection (76 | 5.6%), Cleaning & Maintenance (54 | 4.0%), Firefighting & Prevention (46 | 3.4%), Food Preparation & Serving (35 | 2.6%), and Law Enforcement (30 | 2.2%).
Services Occupations by Sex
Within the Services occupations in Littleton Common, the most male-oriented occupations are Healthcare Support (100.0%), Law Enforcement (100.0%), and Cleaning & Maintenance (75.9%), while the most female-oriented occupations are Personal Care & Service (100.0%), Food Preparation & Serving (48.6%), and Firefighting & Prevention (45.7%).
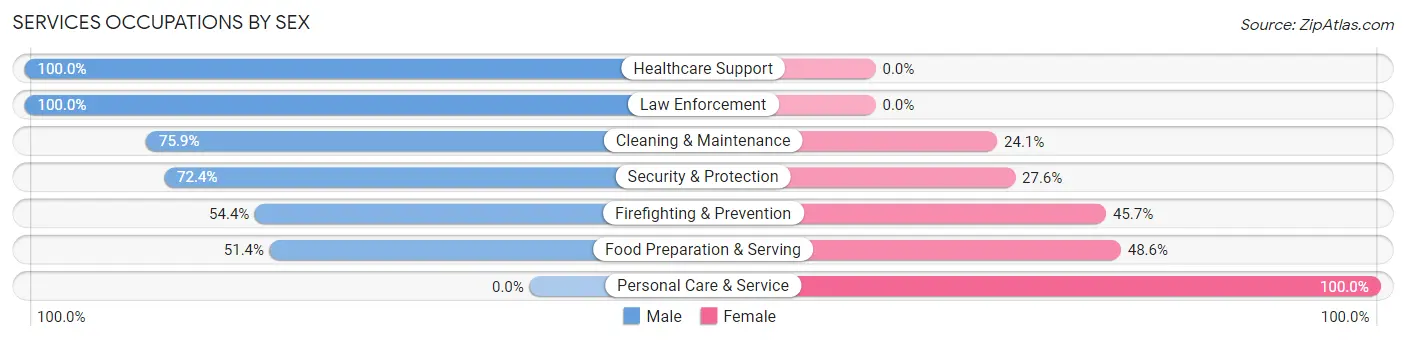
| Occupation | Male | Female |
| Healthcare Support | 9 (100.0%) | 0 (0.0%) |
| Security & Protection | 55 (72.4%) | 21 (27.6%) |
| Firefighting & Prevention | 25 (54.3%) | 21 (45.7%) |
| Law Enforcement | 30 (100.0%) | 0 (0.0%) |
| Food Preparation & Serving | 18 (51.4%) | 17 (48.6%) |
| Cleaning & Maintenance | 41 (75.9%) | 13 (24.1%) |
| Personal Care & Service | 0 (0.0%) | 24 (100.0%) |
| Total (Category) | 123 (62.1%) | 75 (37.9%) |
| Total (Overall) | 715 (52.6%) | 644 (47.4%) |
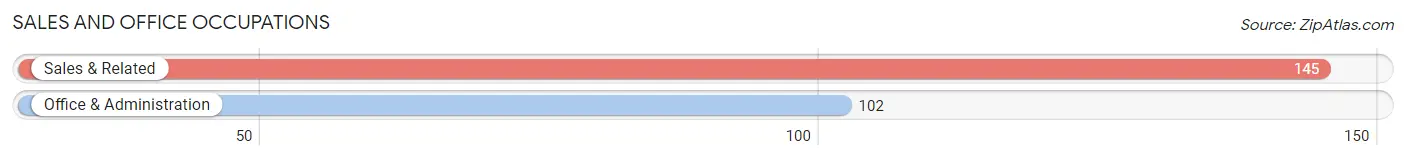
Sales and Office Occupations
The most common Sales and Office occupations in Littleton Common are Sales & Related (145 | 10.7%), and Office & Administration (102 | 7.5%).
Sales and Office Occupations by Sex
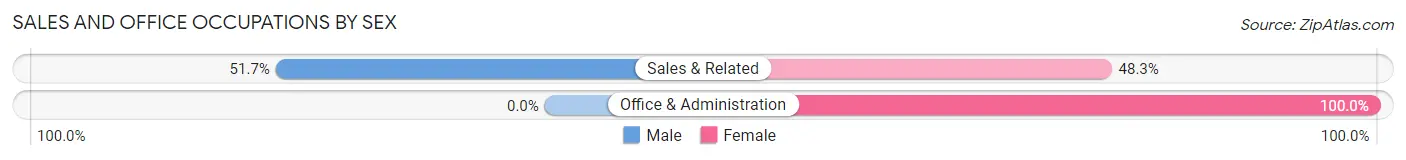
| Occupation | Male | Female |
| Sales & Related | 75 (51.7%) | 70 (48.3%) |
| Office & Administration | 0 (0.0%) | 102 (100.0%) |
| Total (Category) | 75 (30.4%) | 172 (69.6%) |
| Total (Overall) | 715 (52.6%) | 644 (47.4%) |
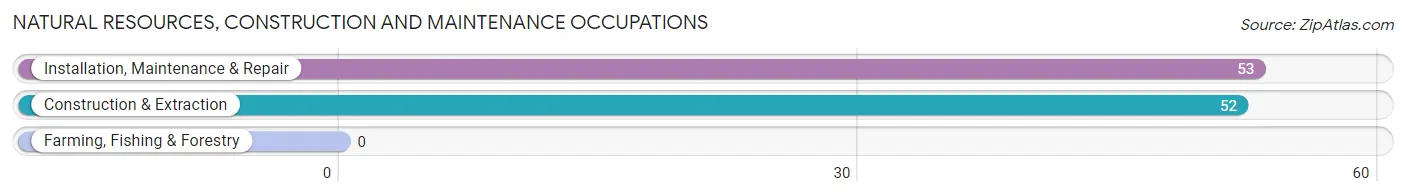
Natural Resources, Construction and Maintenance Occupations
The most common Natural Resources, Construction and Maintenance occupations in Littleton Common are Installation, Maintenance & Repair (53 | 3.9%), and Construction & Extraction (52 | 3.8%).
Natural Resources, Construction and Maintenance Occupations by Sex
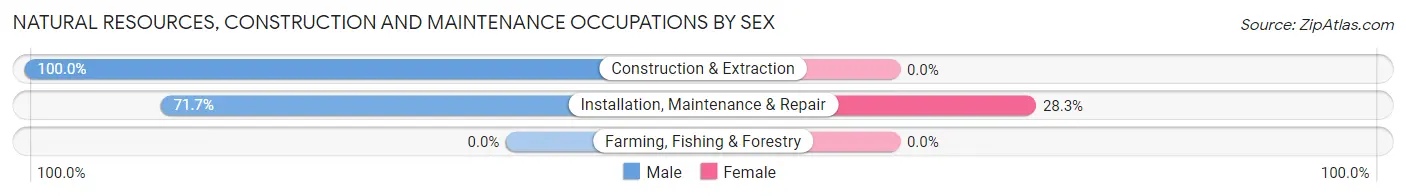
| Occupation | Male | Female |
| Farming, Fishing & Forestry | 0 (0.0%) | 0 (0.0%) |
| Construction & Extraction | 52 (100.0%) | 0 (0.0%) |
| Installation, Maintenance & Repair | 38 (71.7%) | 15 (28.3%) |
| Total (Category) | 90 (85.7%) | 15 (14.3%) |
| Total (Overall) | 715 (52.6%) | 644 (47.4%) |
Production, Transportation and Moving Occupations
The most common Production, Transportation and Moving occupations in Littleton Common are Transportation (35 | 2.6%), and Production (30 | 2.2%).
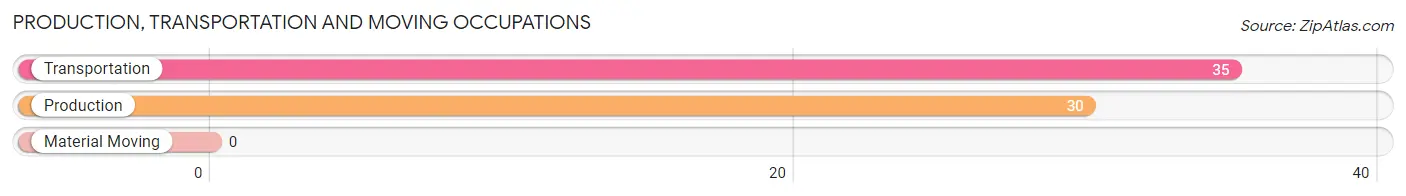
Production, Transportation and Moving Occupations by Sex
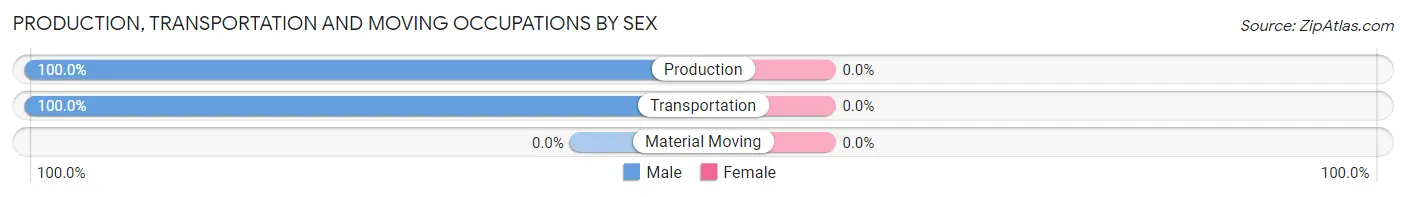
| Occupation | Male | Female |
| Production | 30 (100.0%) | 0 (0.0%) |
| Transportation | 35 (100.0%) | 0 (0.0%) |
| Material Moving | 0 (0.0%) | 0 (0.0%) |
| Total (Category) | 65 (100.0%) | 0 (0.0%) |
| Total (Overall) | 715 (52.6%) | 644 (47.4%) |
Employment Industries by Sex in Littleton Common
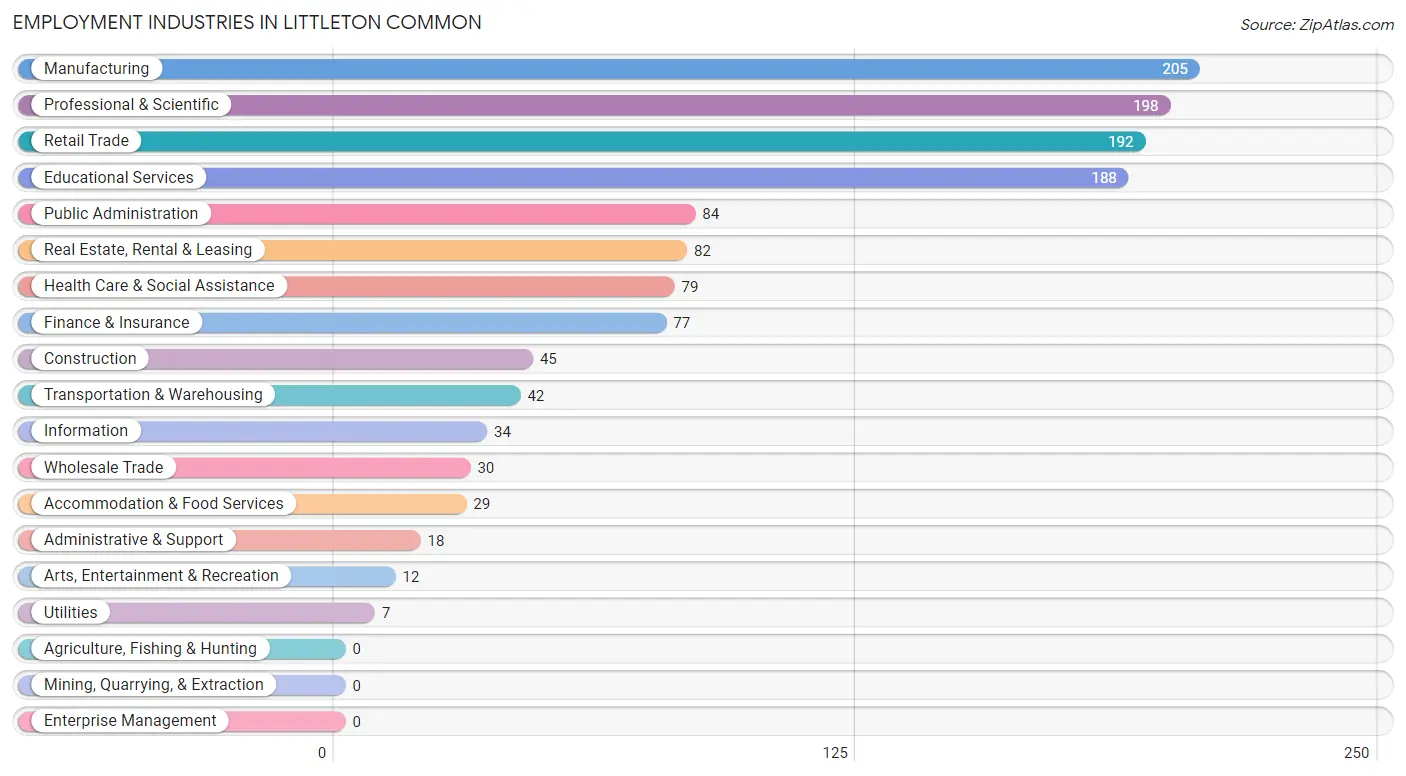
Employment Industries in Littleton Common
The major employment industries in Littleton Common include Manufacturing (205 | 15.1%), Professional & Scientific (198 | 14.6%), Retail Trade (192 | 14.1%), Educational Services (188 | 13.8%), and Public Administration (84 | 6.2%).
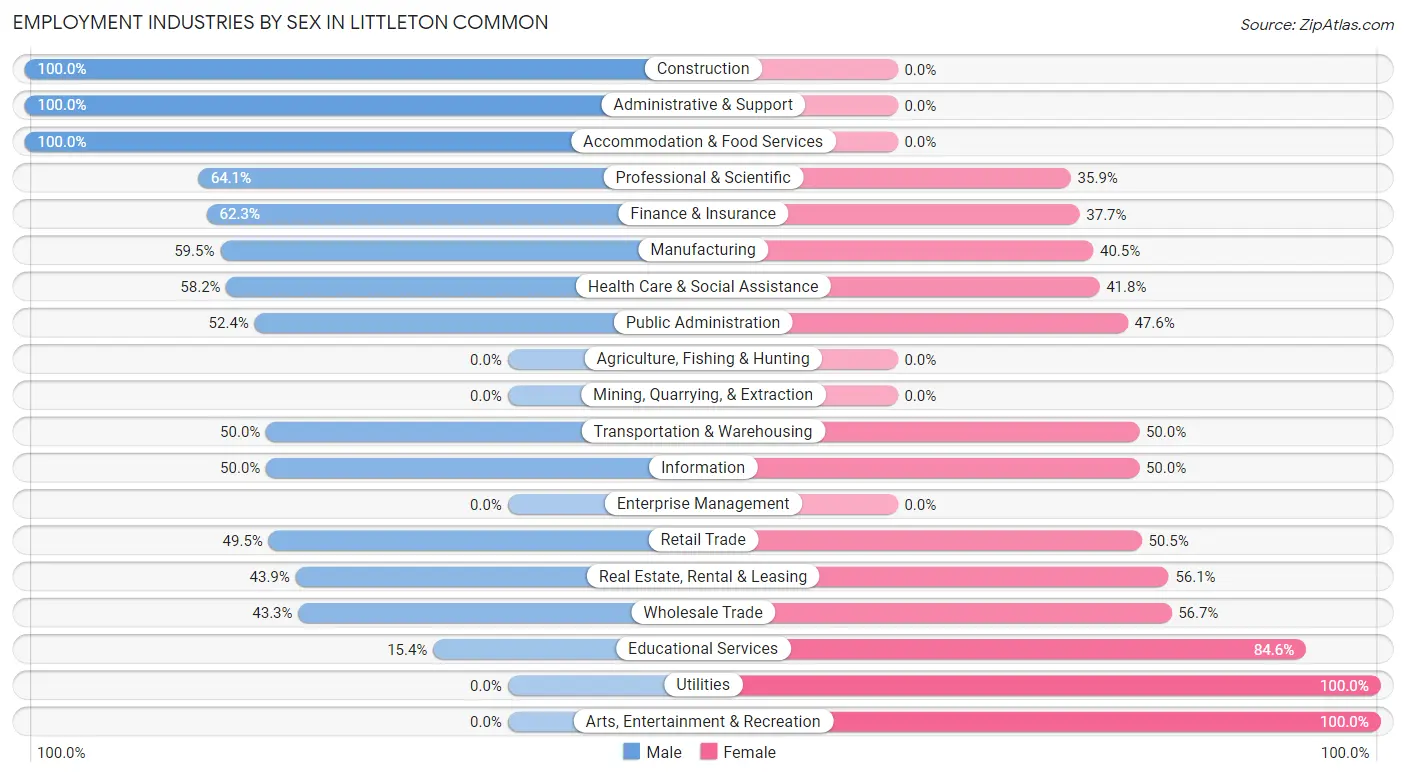
Employment Industries by Sex in Littleton Common
The Littleton Common industries that see more men than women are Construction (100.0%), Administrative & Support (100.0%), and Accommodation & Food Services (100.0%), whereas the industries that tend to have a higher number of women are Utilities (100.0%), Arts, Entertainment & Recreation (100.0%), and Educational Services (84.6%).
| Industry | Male | Female |
| Agriculture, Fishing & Hunting | 0 (0.0%) | 0 (0.0%) |
| Mining, Quarrying, & Extraction | 0 (0.0%) | 0 (0.0%) |
| Construction | 45 (100.0%) | 0 (0.0%) |
| Manufacturing | 122 (59.5%) | 83 (40.5%) |
| Wholesale Trade | 13 (43.3%) | 17 (56.7%) |
| Retail Trade | 95 (49.5%) | 97 (50.5%) |
| Transportation & Warehousing | 21 (50.0%) | 21 (50.0%) |
| Utilities | 0 (0.0%) | 7 (100.0%) |
| Information | 17 (50.0%) | 17 (50.0%) |
| Finance & Insurance | 48 (62.3%) | 29 (37.7%) |
| Real Estate, Rental & Leasing | 36 (43.9%) | 46 (56.1%) |
| Professional & Scientific | 127 (64.1%) | 71 (35.9%) |
| Enterprise Management | 0 (0.0%) | 0 (0.0%) |
| Administrative & Support | 18 (100.0%) | 0 (0.0%) |
| Educational Services | 29 (15.4%) | 159 (84.6%) |
| Health Care & Social Assistance | 46 (58.2%) | 33 (41.8%) |
| Arts, Entertainment & Recreation | 0 (0.0%) | 12 (100.0%) |
| Accommodation & Food Services | 29 (100.0%) | 0 (0.0%) |
| Public Administration | 44 (52.4%) | 40 (47.6%) |
| Total | 715 (52.6%) | 644 (47.4%) |
Education in Littleton Common
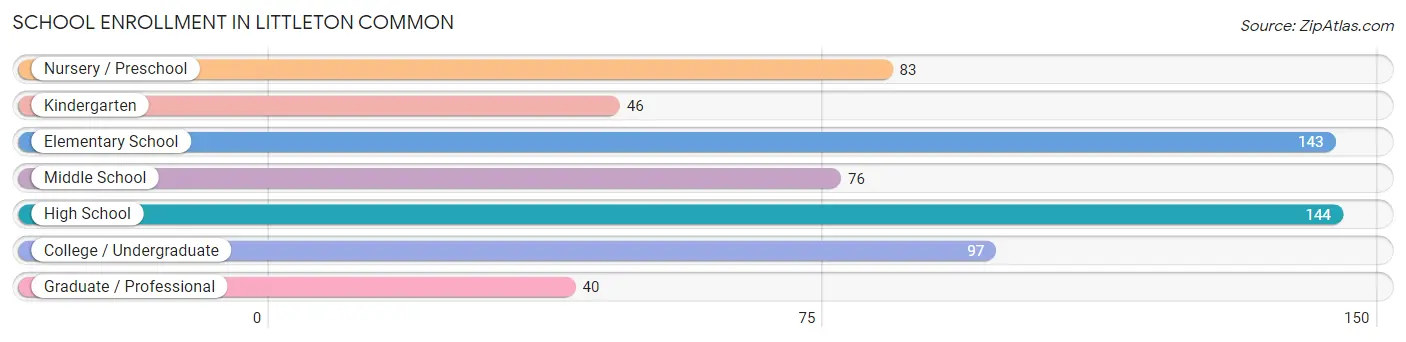
School Enrollment in Littleton Common
The most common levels of schooling among the 629 students in Littleton Common are high school (144 | 22.9%), elementary school (143 | 22.7%), and college / undergraduate (97 | 15.4%).
| School Level | # Students | % Students |
| Nursery / Preschool | 83 | 13.2% |
| Kindergarten | 46 | 7.3% |
| Elementary School | 143 | 22.7% |
| Middle School | 76 | 12.1% |
| High School | 144 | 22.9% |
| College / Undergraduate | 97 | 15.4% |
| Graduate / Professional | 40 | 6.4% |
| Total | 629 | 100.0% |
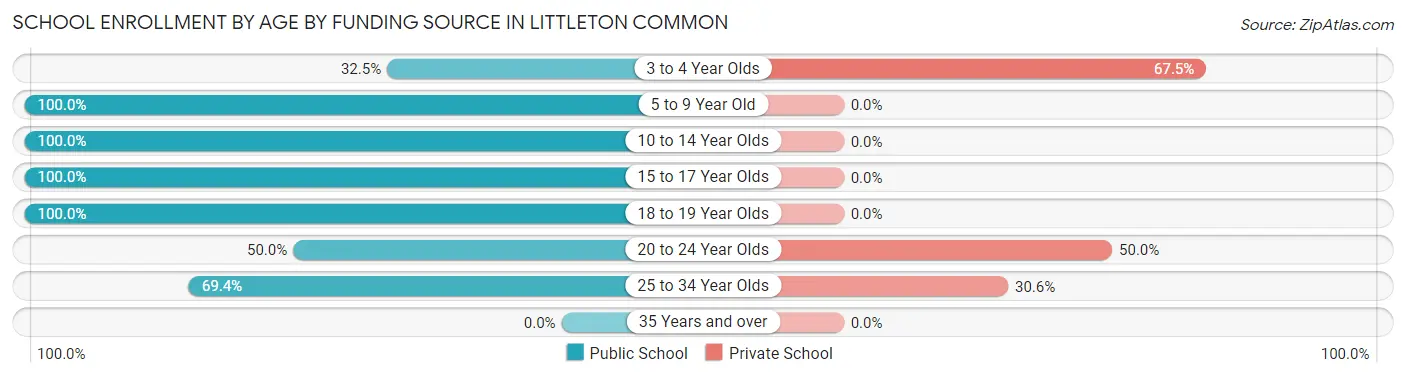
School Enrollment by Age by Funding Source in Littleton Common
Out of a total of 629 students who are enrolled in schools in Littleton Common, 98 (15.6%) attend a private institution, while the remaining 531 (84.4%) are enrolled in public schools. The age group of 3 to 4 year olds has the highest likelihood of being enrolled in private schools, with 54 (67.5% in the age bracket) enrolled. Conversely, the age group of 5 to 9 year old has the lowest likelihood of being enrolled in a private school, with 178 (100.0% in the age bracket) attending a public institution.
| Age Bracket | Public School | Private School |
| 3 to 4 Year Olds | 26 (32.5%) | 54 (67.5%) |
| 5 to 9 Year Old | 178 (100.0%) | 0 (0.0%) |
| 10 to 14 Year Olds | 113 (100.0%) | 0 (0.0%) |
| 15 to 17 Year Olds | 104 (100.0%) | 0 (0.0%) |
| 18 to 19 Year Olds | 28 (100.0%) | 0 (0.0%) |
| 20 to 24 Year Olds | 14 (50.0%) | 14 (50.0%) |
| 25 to 34 Year Olds | 68 (69.4%) | 30 (30.6%) |
| 35 Years and over | 0 (0.0%) | 0 (0.0%) |
| Total | 531 (84.4%) | 98 (15.6%) |
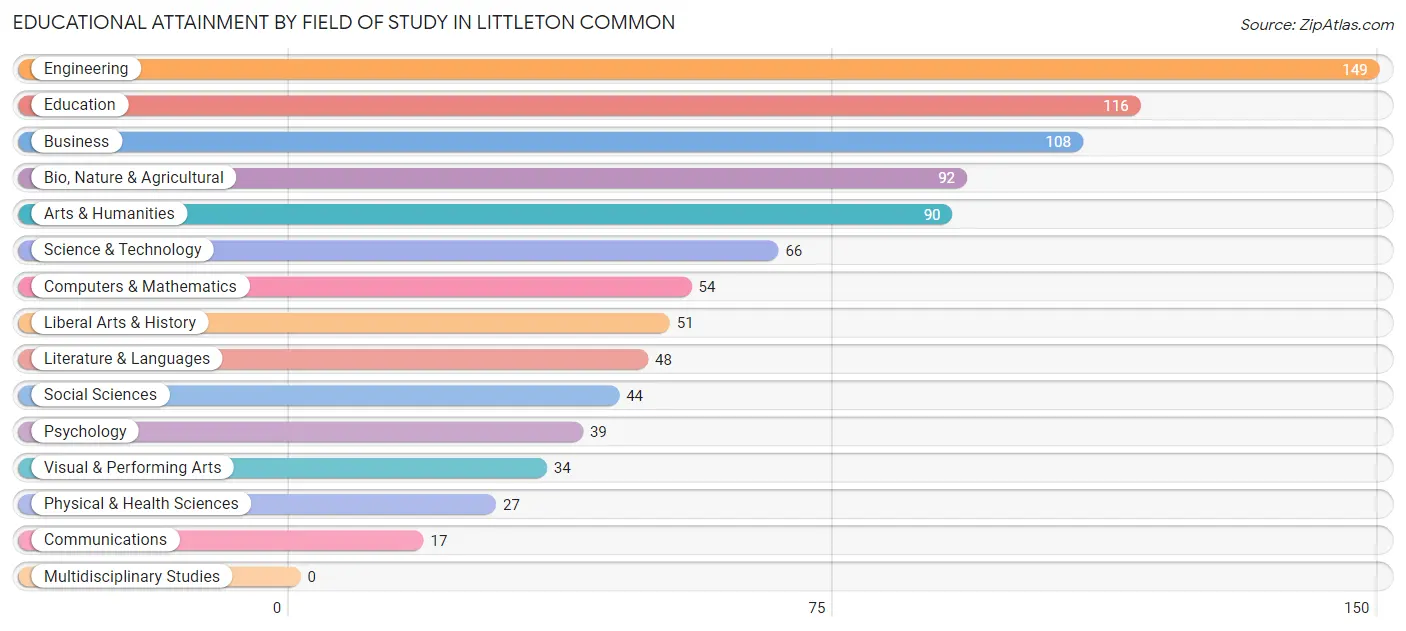
Educational Attainment by Field of Study in Littleton Common
Engineering (149 | 15.9%), education (116 | 12.4%), business (108 | 11.6%), bio, nature & agricultural (92 | 9.8%), and arts & humanities (90 | 9.6%) are the most common fields of study among 935 individuals in Littleton Common who have obtained a bachelor's degree or higher.
| Field of Study | # Graduates | % Graduates |
| Computers & Mathematics | 54 | 5.8% |
| Bio, Nature & Agricultural | 92 | 9.8% |
| Physical & Health Sciences | 27 | 2.9% |
| Psychology | 39 | 4.2% |
| Social Sciences | 44 | 4.7% |
| Engineering | 149 | 15.9% |
| Multidisciplinary Studies | 0 | 0.0% |
| Science & Technology | 66 | 7.1% |
| Business | 108 | 11.6% |
| Education | 116 | 12.4% |
| Literature & Languages | 48 | 5.1% |
| Liberal Arts & History | 51 | 5.4% |
| Visual & Performing Arts | 34 | 3.6% |
| Communications | 17 | 1.8% |
| Arts & Humanities | 90 | 9.6% |
| Total | 935 | 100.0% |
Transportation & Commute in Littleton Common
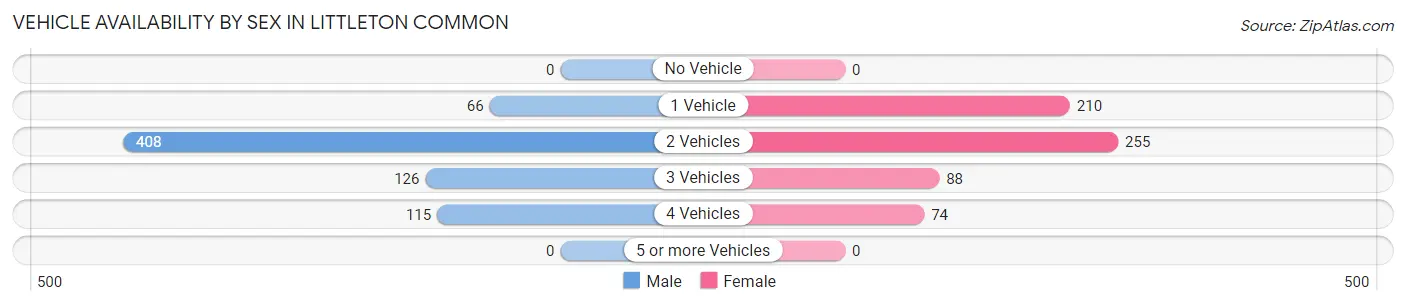
Vehicle Availability by Sex in Littleton Common
The most prevalent vehicle ownership categories in Littleton Common are males with 2 vehicles (408, accounting for 57.1%) and females with 2 vehicles (255, making up 65.1%).
| Vehicles Available | Male | Female |
| No Vehicle | 0 (0.0%) | 0 (0.0%) |
| 1 Vehicle | 66 (9.2%) | 210 (33.5%) |
| 2 Vehicles | 408 (57.1%) | 255 (40.7%) |
| 3 Vehicles | 126 (17.6%) | 88 (14.0%) |
| 4 Vehicles | 115 (16.1%) | 74 (11.8%) |
| 5 or more Vehicles | 0 (0.0%) | 0 (0.0%) |
| Total | 715 (100.0%) | 627 (100.0%) |
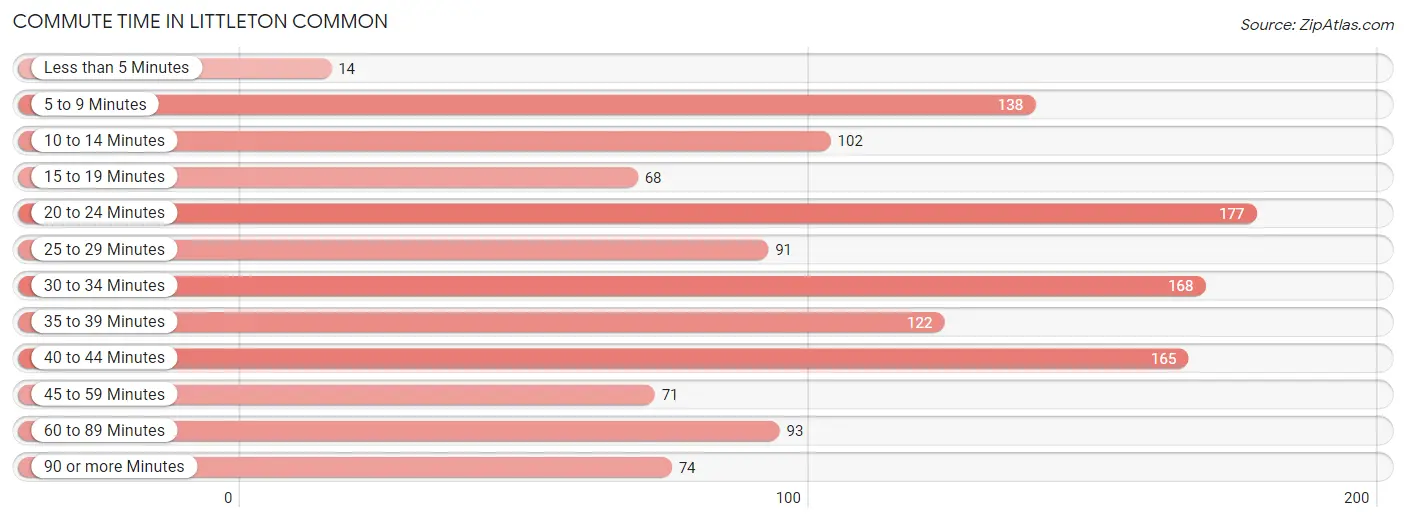
Commute Time in Littleton Common
The most frequently occuring commute durations in Littleton Common are 20 to 24 minutes (177 commuters, 13.8%), 30 to 34 minutes (168 commuters, 13.1%), and 40 to 44 minutes (165 commuters, 12.9%).
| Commute Time | # Commuters | % Commuters |
| Less than 5 Minutes | 14 | 1.1% |
| 5 to 9 Minutes | 138 | 10.8% |
| 10 to 14 Minutes | 102 | 8.0% |
| 15 to 19 Minutes | 68 | 5.3% |
| 20 to 24 Minutes | 177 | 13.8% |
| 25 to 29 Minutes | 91 | 7.1% |
| 30 to 34 Minutes | 168 | 13.1% |
| 35 to 39 Minutes | 122 | 9.5% |
| 40 to 44 Minutes | 165 | 12.9% |
| 45 to 59 Minutes | 71 | 5.5% |
| 60 to 89 Minutes | 93 | 7.2% |
| 90 or more Minutes | 74 | 5.8% |
Commute Time by Sex in Littleton Common
The most common commute times in Littleton Common are 30 to 34 minutes (135 commuters, 19.5%) for males and 20 to 24 minutes (163 commuters, 27.6%) for females.
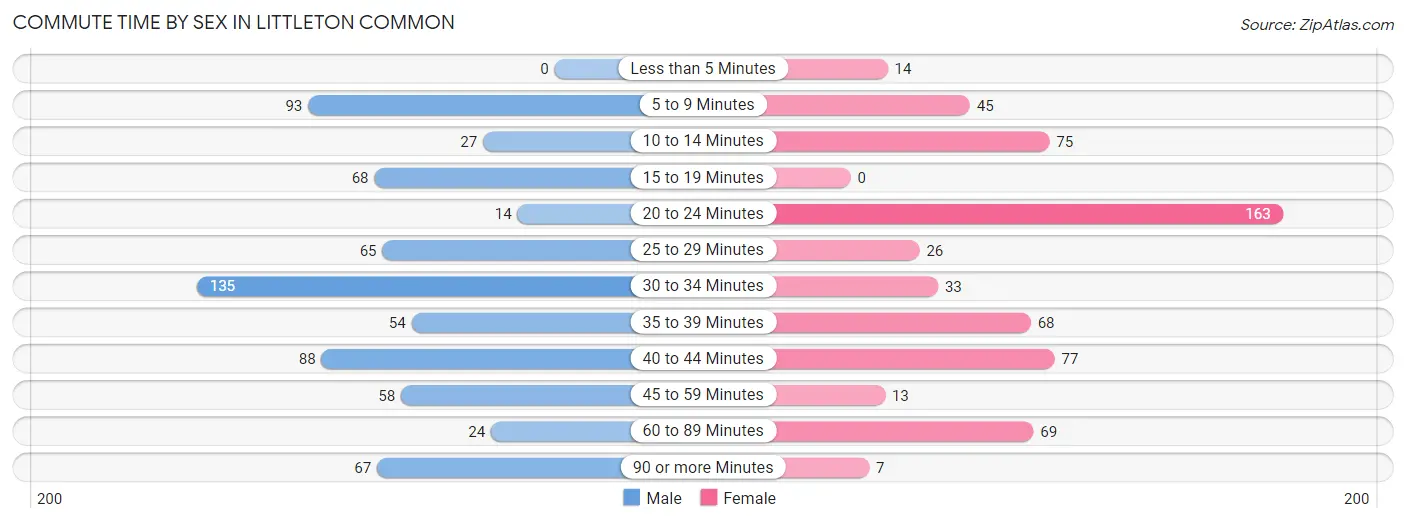
| Commute Time | Male | Female |
| Less than 5 Minutes | 0 (0.0%) | 14 (2.4%) |
| 5 to 9 Minutes | 93 (13.4%) | 45 (7.6%) |
| 10 to 14 Minutes | 27 (3.9%) | 75 (12.7%) |
| 15 to 19 Minutes | 68 (9.8%) | 0 (0.0%) |
| 20 to 24 Minutes | 14 (2.0%) | 163 (27.6%) |
| 25 to 29 Minutes | 65 (9.4%) | 26 (4.4%) |
| 30 to 34 Minutes | 135 (19.5%) | 33 (5.6%) |
| 35 to 39 Minutes | 54 (7.8%) | 68 (11.5%) |
| 40 to 44 Minutes | 88 (12.7%) | 77 (13.1%) |
| 45 to 59 Minutes | 58 (8.4%) | 13 (2.2%) |
| 60 to 89 Minutes | 24 (3.5%) | 69 (11.7%) |
| 90 or more Minutes | 67 (9.7%) | 7 (1.2%) |
Time of Departure to Work by Sex in Littleton Common
The most frequent times of departure to work in Littleton Common are 6:30 AM to 6:59 AM (160, 23.1%) for males and 8:00 AM to 8:29 AM (182, 30.8%) for females.
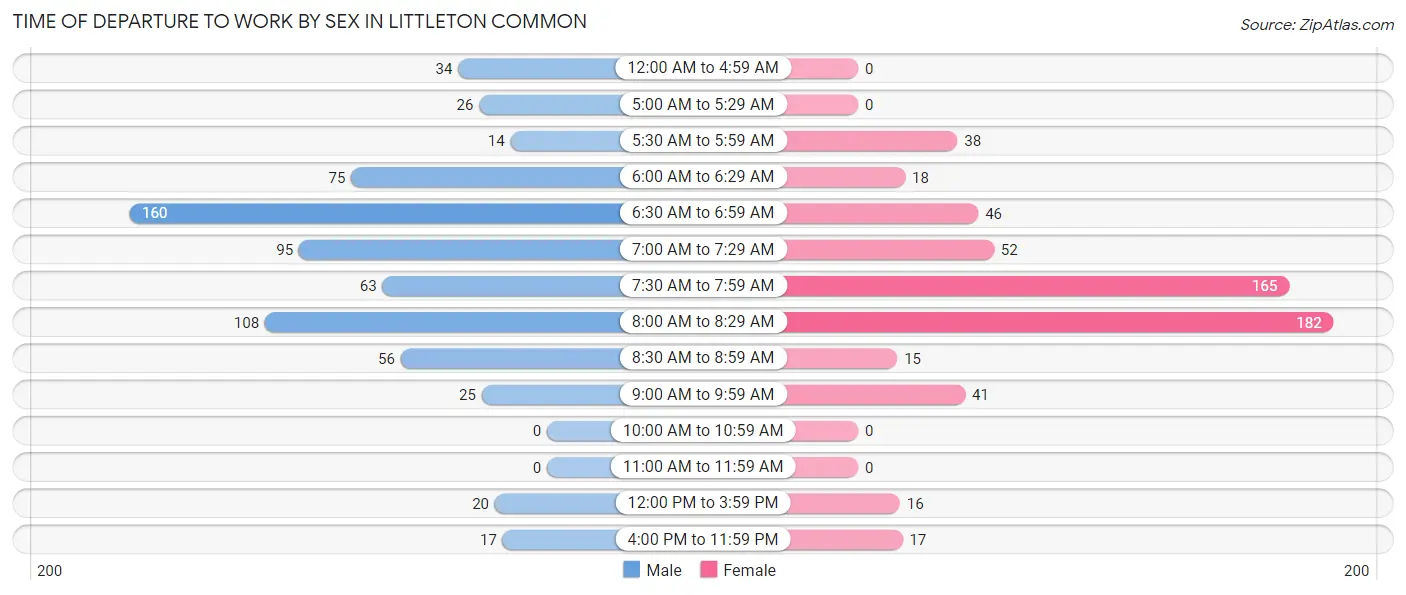
| Time of Departure | Male | Female |
| 12:00 AM to 4:59 AM | 34 (4.9%) | 0 (0.0%) |
| 5:00 AM to 5:29 AM | 26 (3.7%) | 0 (0.0%) |
| 5:30 AM to 5:59 AM | 14 (2.0%) | 38 (6.4%) |
| 6:00 AM to 6:29 AM | 75 (10.8%) | 18 (3.0%) |
| 6:30 AM to 6:59 AM | 160 (23.1%) | 46 (7.8%) |
| 7:00 AM to 7:29 AM | 95 (13.7%) | 52 (8.8%) |
| 7:30 AM to 7:59 AM | 63 (9.1%) | 165 (28.0%) |
| 8:00 AM to 8:29 AM | 108 (15.6%) | 182 (30.8%) |
| 8:30 AM to 8:59 AM | 56 (8.1%) | 15 (2.5%) |
| 9:00 AM to 9:59 AM | 25 (3.6%) | 41 (7.0%) |
| 10:00 AM to 10:59 AM | 0 (0.0%) | 0 (0.0%) |
| 11:00 AM to 11:59 AM | 0 (0.0%) | 0 (0.0%) |
| 12:00 PM to 3:59 PM | 20 (2.9%) | 16 (2.7%) |
| 4:00 PM to 11:59 PM | 17 (2.5%) | 17 (2.9%) |
| Total | 693 (100.0%) | 590 (100.0%) |
Housing Occupancy in Littleton Common
Occupancy by Ownership in Littleton Common
Of the total 1,129 dwellings in Littleton Common, owner-occupied units account for 1,028 (91.0%), while renter-occupied units make up 101 (8.9%).
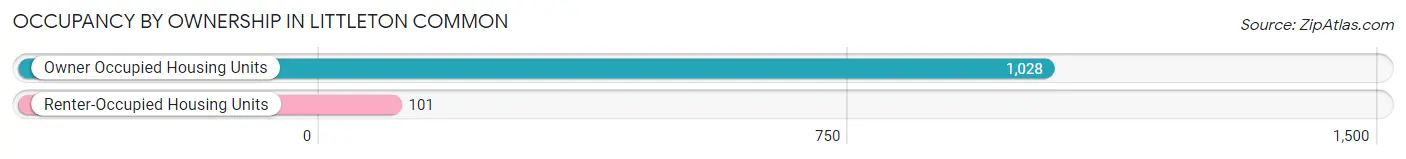
| Occupancy | # Housing Units | % Housing Units |
| Owner Occupied Housing Units | 1,028 | 91.0% |
| Renter-Occupied Housing Units | 101 | 8.9% |
| Total Occupied Housing Units | 1,129 | 100.0% |
Occupancy by Household Size in Littleton Common
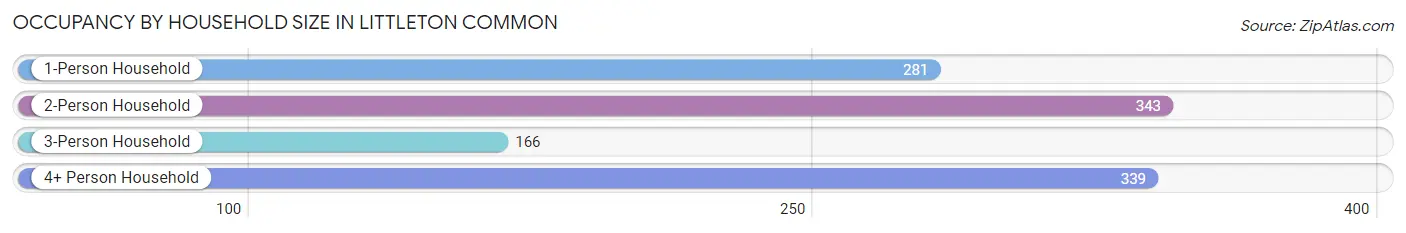
| Household Size | # Housing Units | % Housing Units |
| 1-Person Household | 281 | 24.9% |
| 2-Person Household | 343 | 30.4% |
| 3-Person Household | 166 | 14.7% |
| 4+ Person Household | 339 | 30.0% |
| Total Housing Units | 1,129 | 100.0% |
Occupancy by Ownership by Household Size in Littleton Common
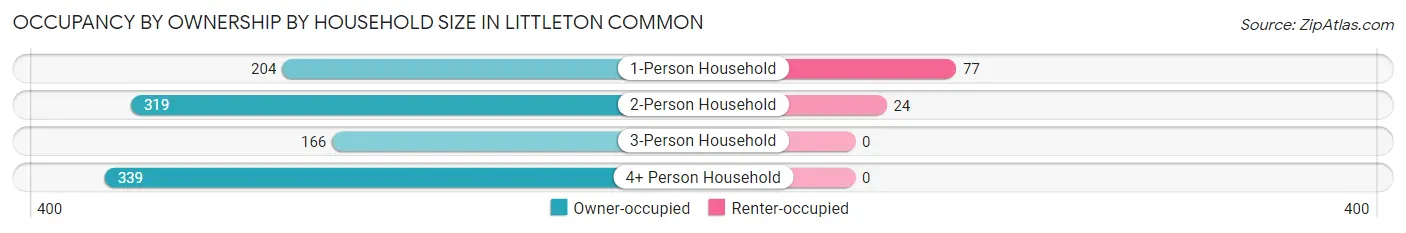
| Household Size | Owner-occupied | Renter-occupied |
| 1-Person Household | 204 (72.6%) | 77 (27.4%) |
| 2-Person Household | 319 (93.0%) | 24 (7.0%) |
| 3-Person Household | 166 (100.0%) | 0 (0.0%) |
| 4+ Person Household | 339 (100.0%) | 0 (0.0%) |
| Total Housing Units | 1,028 (91.0%) | 101 (8.9%) |
Occupancy by Educational Attainment in Littleton Common
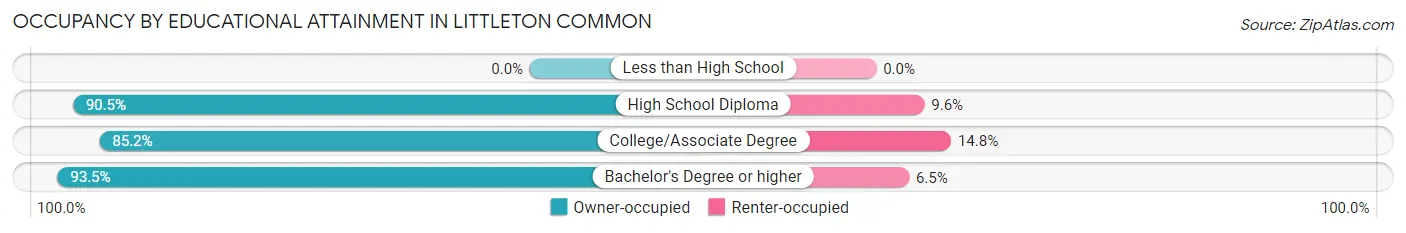
| Household Size | Owner-occupied | Renter-occupied |
| Less than High School | 0 (0.0%) | 0 (0.0%) |
| High School Diploma | 303 (90.4%) | 32 (9.6%) |
| College/Associate Degree | 178 (85.2%) | 31 (14.8%) |
| Bachelor's Degree or higher | 547 (93.5%) | 38 (6.5%) |
Occupancy by Age of Householder in Littleton Common
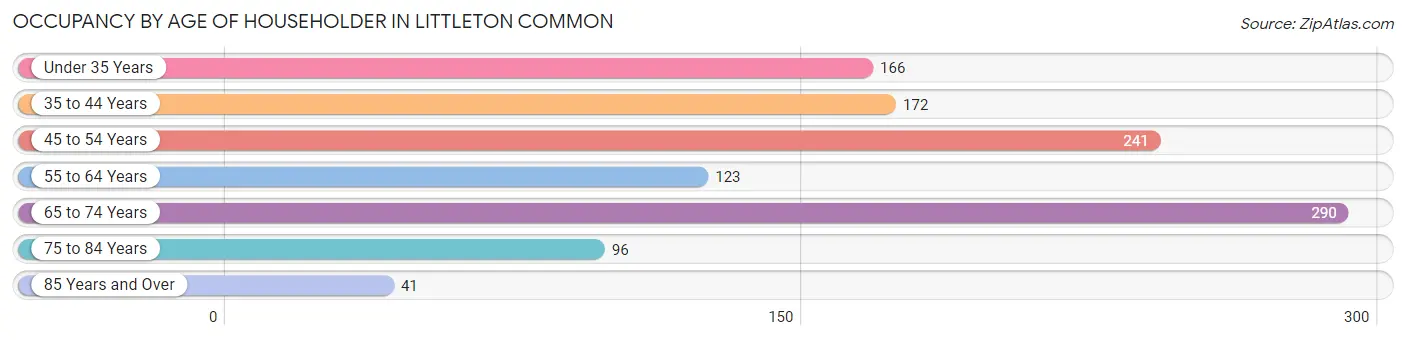
| Age Bracket | # Households | % Households |
| Under 35 Years | 166 | 14.7% |
| 35 to 44 Years | 172 | 15.2% |
| 45 to 54 Years | 241 | 21.3% |
| 55 to 64 Years | 123 | 10.9% |
| 65 to 74 Years | 290 | 25.7% |
| 75 to 84 Years | 96 | 8.5% |
| 85 Years and Over | 41 | 3.6% |
| Total | 1,129 | 100.0% |
Housing Finances in Littleton Common
Median Income by Occupancy in Littleton Common
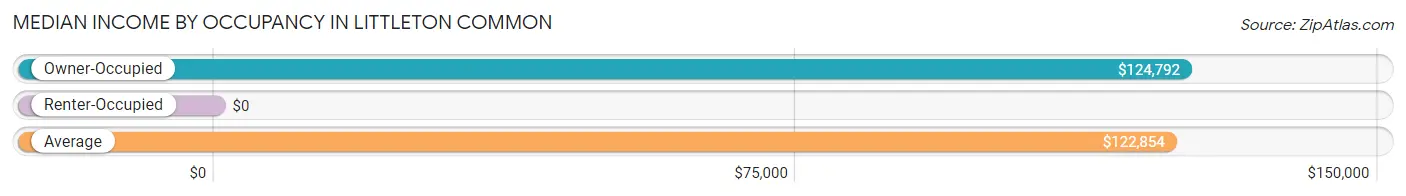
| Occupancy Type | # Households | Median Income |
| Owner-Occupied | 1,028 (91.0%) | $124,792 |
| Renter-Occupied | 101 (8.9%) | $0 |
| Average | 1,129 (100.0%) | $122,854 |
Occupancy by Householder Income Bracket in Littleton Common
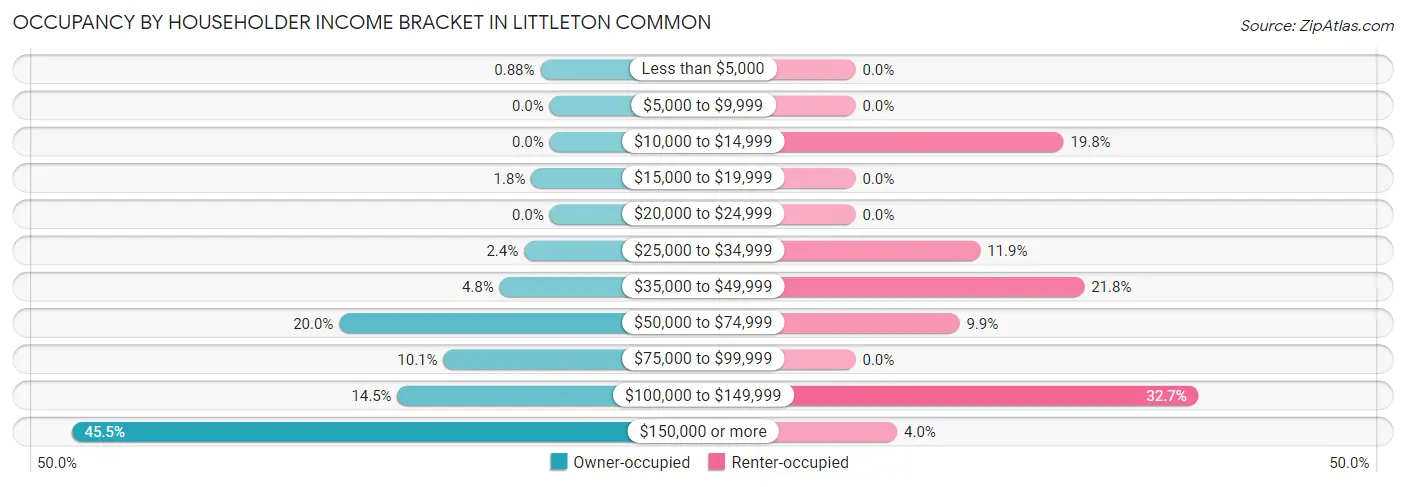
| Income Bracket | Owner-occupied | Renter-occupied |
| Less than $5,000 | 9 (0.9%) | 0 (0.0%) |
| $5,000 to $9,999 | 0 (0.0%) | 0 (0.0%) |
| $10,000 to $14,999 | 0 (0.0%) | 20 (19.8%) |
| $15,000 to $19,999 | 18 (1.8%) | 0 (0.0%) |
| $20,000 to $24,999 | 0 (0.0%) | 0 (0.0%) |
| $25,000 to $34,999 | 25 (2.4%) | 12 (11.9%) |
| $35,000 to $49,999 | 49 (4.8%) | 22 (21.8%) |
| $50,000 to $74,999 | 206 (20.0%) | 10 (9.9%) |
| $75,000 to $99,999 | 104 (10.1%) | 0 (0.0%) |
| $100,000 to $149,999 | 149 (14.5%) | 33 (32.7%) |
| $150,000 or more | 468 (45.5%) | 4 (4.0%) |
| Total | 1,028 (100.0%) | 101 (100.0%) |
Monthly Housing Cost Tiers in Littleton Common
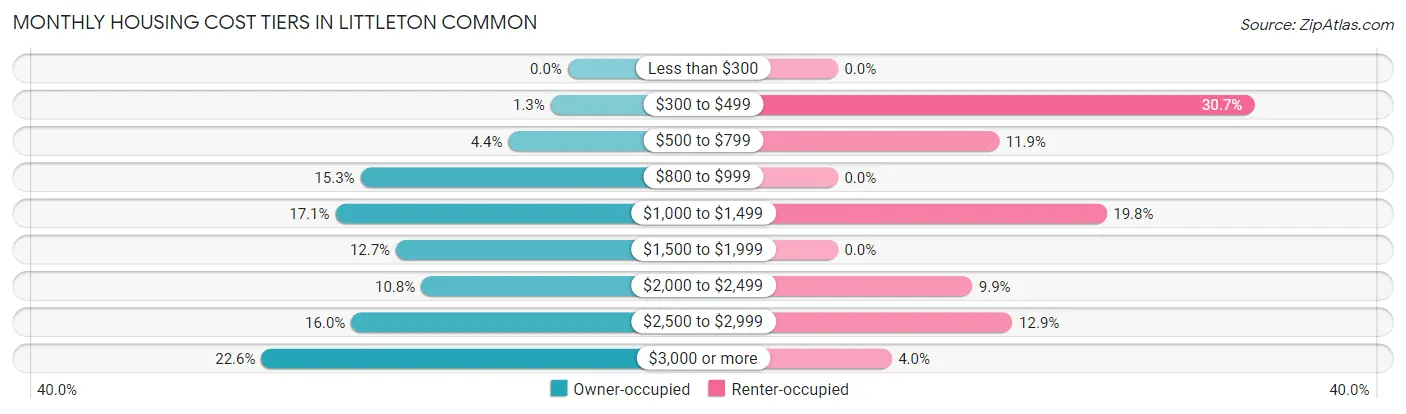
| Monthly Cost | Owner-occupied | Renter-occupied |
| Less than $300 | 0 (0.0%) | 0 (0.0%) |
| $300 to $499 | 13 (1.3%) | 31 (30.7%) |
| $500 to $799 | 45 (4.4%) | 12 (11.9%) |
| $800 to $999 | 157 (15.3%) | 0 (0.0%) |
| $1,000 to $1,499 | 176 (17.1%) | 20 (19.8%) |
| $1,500 to $1,999 | 130 (12.7%) | 0 (0.0%) |
| $2,000 to $2,499 | 111 (10.8%) | 10 (9.9%) |
| $2,500 to $2,999 | 164 (16.0%) | 13 (12.9%) |
| $3,000 or more | 232 (22.6%) | 4 (4.0%) |
| Total | 1,028 (100.0%) | 101 (100.0%) |
Physical Housing Characteristics in Littleton Common
Housing Structures in Littleton Common
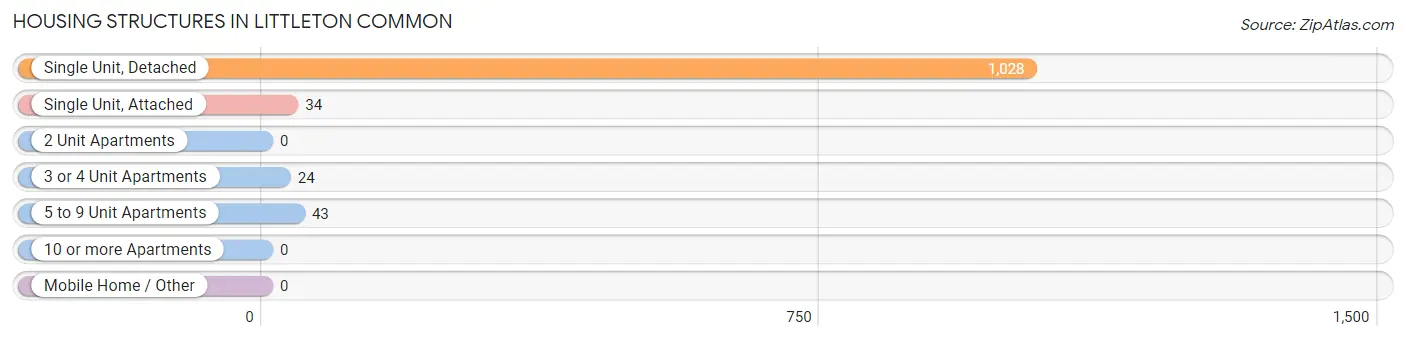
| Structure Type | # Housing Units | % Housing Units |
| Single Unit, Detached | 1,028 | 91.0% |
| Single Unit, Attached | 34 | 3.0% |
| 2 Unit Apartments | 0 | 0.0% |
| 3 or 4 Unit Apartments | 24 | 2.1% |
| 5 to 9 Unit Apartments | 43 | 3.8% |
| 10 or more Apartments | 0 | 0.0% |
| Mobile Home / Other | 0 | 0.0% |
| Total | 1,129 | 100.0% |
Housing Structures by Occupancy in Littleton Common
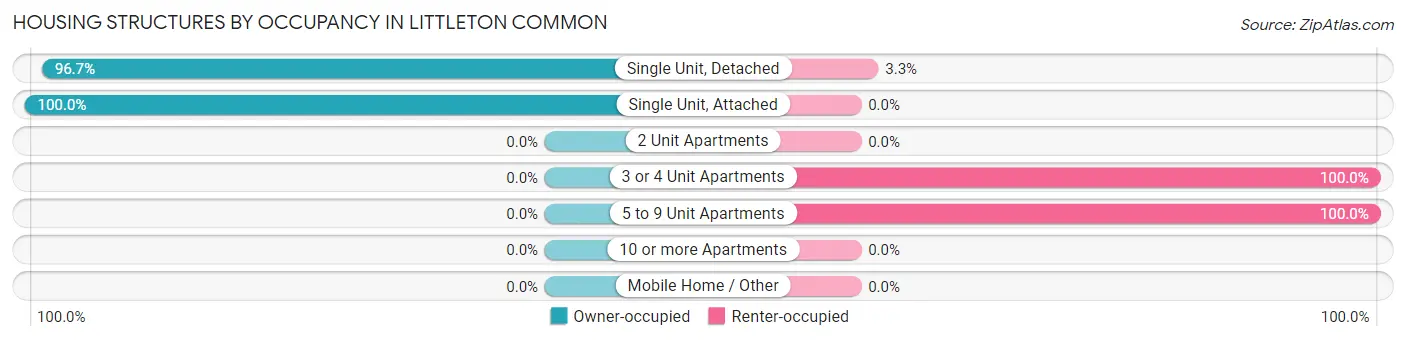
| Structure Type | Owner-occupied | Renter-occupied |
| Single Unit, Detached | 994 (96.7%) | 34 (3.3%) |
| Single Unit, Attached | 34 (100.0%) | 0 (0.0%) |
| 2 Unit Apartments | 0 (0.0%) | 0 (0.0%) |
| 3 or 4 Unit Apartments | 0 (0.0%) | 24 (100.0%) |
| 5 to 9 Unit Apartments | 0 (0.0%) | 43 (100.0%) |
| 10 or more Apartments | 0 (0.0%) | 0 (0.0%) |
| Mobile Home / Other | 0 (0.0%) | 0 (0.0%) |
| Total | 1,028 (91.0%) | 101 (8.9%) |
Housing Structures by Number of Rooms in Littleton Common
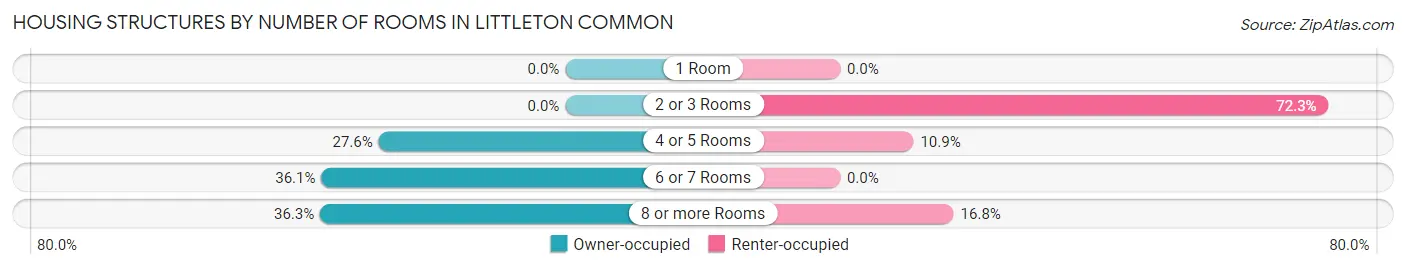
| Number of Rooms | Owner-occupied | Renter-occupied |
| 1 Room | 0 (0.0%) | 0 (0.0%) |
| 2 or 3 Rooms | 0 (0.0%) | 73 (72.3%) |
| 4 or 5 Rooms | 284 (27.6%) | 11 (10.9%) |
| 6 or 7 Rooms | 371 (36.1%) | 0 (0.0%) |
| 8 or more Rooms | 373 (36.3%) | 17 (16.8%) |
| Total | 1,028 (100.0%) | 101 (100.0%) |
Housing Structure by Heating Type in Littleton Common
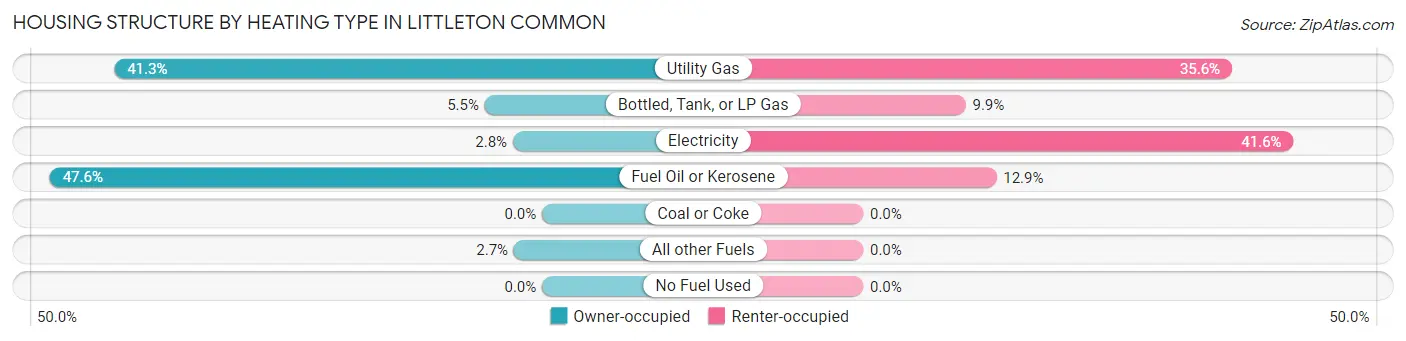
| Heating Type | Owner-occupied | Renter-occupied |
| Utility Gas | 425 (41.3%) | 36 (35.6%) |
| Bottled, Tank, or LP Gas | 57 (5.5%) | 10 (9.9%) |
| Electricity | 29 (2.8%) | 42 (41.6%) |
| Fuel Oil or Kerosene | 489 (47.6%) | 13 (12.9%) |
| Coal or Coke | 0 (0.0%) | 0 (0.0%) |
| All other Fuels | 28 (2.7%) | 0 (0.0%) |
| No Fuel Used | 0 (0.0%) | 0 (0.0%) |
| Total | 1,028 (100.0%) | 101 (100.0%) |
Household Vehicle Usage in Littleton Common
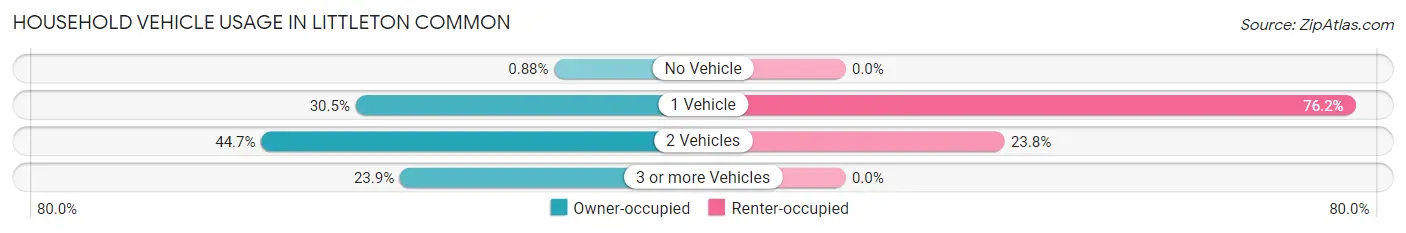
| Vehicles per Household | Owner-occupied | Renter-occupied |
| No Vehicle | 9 (0.9%) | 0 (0.0%) |
| 1 Vehicle | 314 (30.5%) | 77 (76.2%) |
| 2 Vehicles | 459 (44.7%) | 24 (23.8%) |
| 3 or more Vehicles | 246 (23.9%) | 0 (0.0%) |
| Total | 1,028 (100.0%) | 101 (100.0%) |
Real Estate & Mortgages in Littleton Common
Real Estate and Mortgage Overview in Littleton Common
| Characteristic | Without Mortgage | With Mortgage |
| Housing Units | 379 | 649 |
| Median Property Value | $454,100 | $493,100 |
| Median Household Income | $60,168 | $380 |
| Monthly Housing Costs | $977 | $232 |
| Real Estate Taxes | $7,155 | $0 |
Property Value by Mortgage Status in Littleton Common
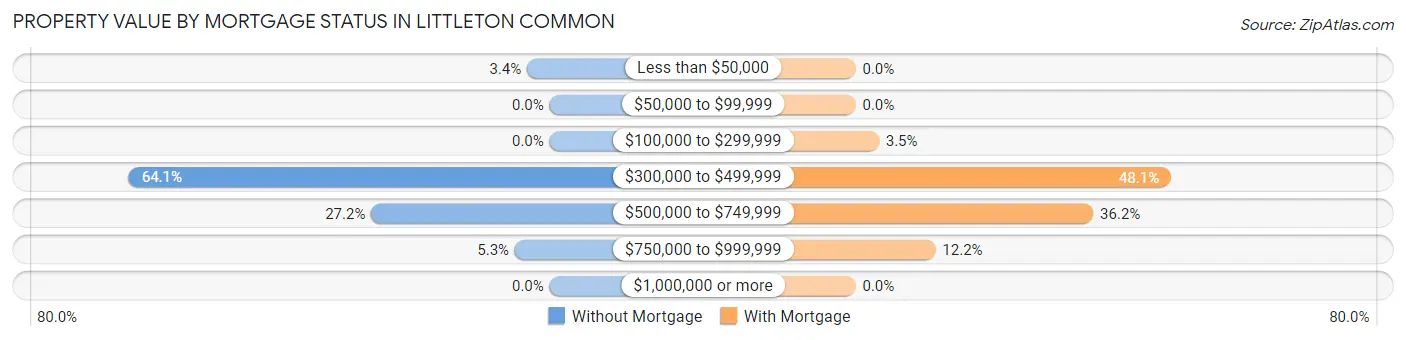
| Property Value | Without Mortgage | With Mortgage |
| Less than $50,000 | 13 (3.4%) | 0 (0.0%) |
| $50,000 to $99,999 | 0 (0.0%) | 0 (0.0%) |
| $100,000 to $299,999 | 0 (0.0%) | 23 (3.5%) |
| $300,000 to $499,999 | 243 (64.1%) | 312 (48.1%) |
| $500,000 to $749,999 | 103 (27.2%) | 235 (36.2%) |
| $750,000 to $999,999 | 20 (5.3%) | 79 (12.2%) |
| $1,000,000 or more | 0 (0.0%) | 0 (0.0%) |
| Total | 379 (100.0%) | 649 (100.0%) |
Household Income by Mortgage Status in Littleton Common
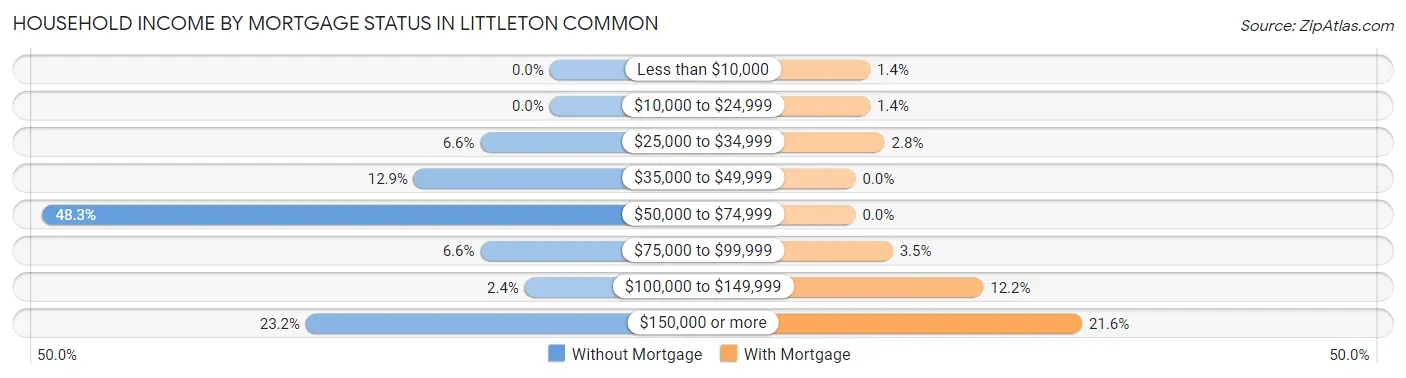
| Household Income | Without Mortgage | With Mortgage |
| Less than $10,000 | 0 (0.0%) | 9 (1.4%) |
| $10,000 to $24,999 | 0 (0.0%) | 9 (1.4%) |
| $25,000 to $34,999 | 25 (6.6%) | 18 (2.8%) |
| $35,000 to $49,999 | 49 (12.9%) | 0 (0.0%) |
| $50,000 to $74,999 | 183 (48.3%) | 0 (0.0%) |
| $75,000 to $99,999 | 25 (6.6%) | 23 (3.5%) |
| $100,000 to $149,999 | 9 (2.4%) | 79 (12.2%) |
| $150,000 or more | 88 (23.2%) | 140 (21.6%) |
| Total | 379 (100.0%) | 649 (100.0%) |
Property Value to Household Income Ratio in Littleton Common
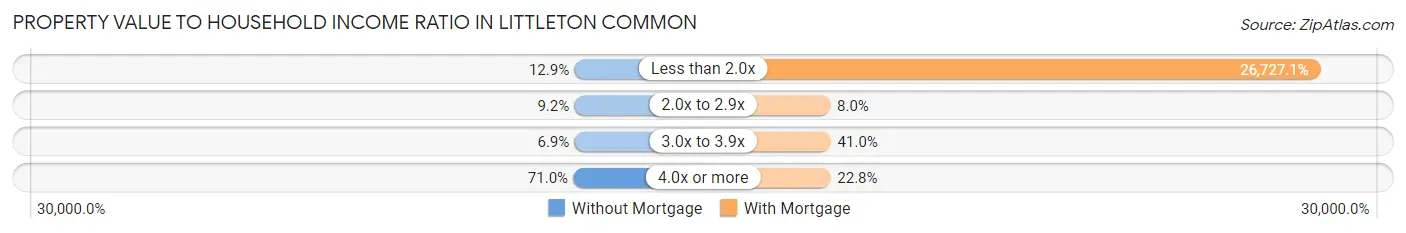
| Value-to-Income Ratio | Without Mortgage | With Mortgage |
| Less than 2.0x | 49 (12.9%) | 173,459 (26,727.1%) |
| 2.0x to 2.9x | 35 (9.2%) | 52 (8.0%) |
| 3.0x to 3.9x | 26 (6.9%) | 266 (41.0%) |
| 4.0x or more | 269 (71.0%) | 148 (22.8%) |
| Total | 379 (100.0%) | 649 (100.0%) |
Real Estate Taxes by Mortgage Status in Littleton Common
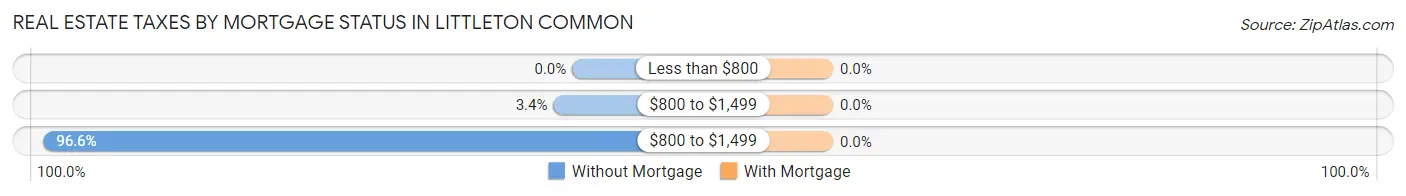
| Property Taxes | Without Mortgage | With Mortgage |
| Less than $800 | 0 (0.0%) | 0 (0.0%) |
| $800 to $1,499 | 13 (3.4%) | 0 (0.0%) |
| $800 to $1,499 | 366 (96.6%) | 0 (0.0%) |
| Total | 379 (100.0%) | 649 (100.0%) |
Health & Disability in Littleton Common
Health Insurance Coverage by Age in Littleton Common
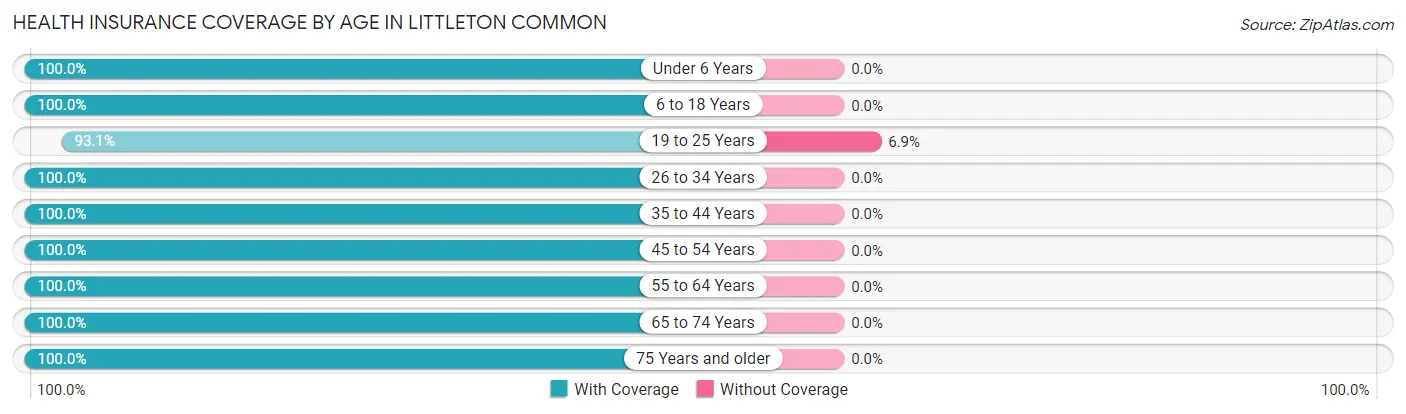
| Age Bracket | With Coverage | Without Coverage |
| Under 6 Years | 243 (100.0%) | 0 (0.0%) |
| 6 to 18 Years | 408 (100.0%) | 0 (0.0%) |
| 19 to 25 Years | 189 (93.1%) | 14 (6.9%) |
| 26 to 34 Years | 305 (100.0%) | 0 (0.0%) |
| 35 to 44 Years | 390 (100.0%) | 0 (0.0%) |
| 45 to 54 Years | 462 (100.0%) | 0 (0.0%) |
| 55 to 64 Years | 260 (100.0%) | 0 (0.0%) |
| 65 to 74 Years | 424 (100.0%) | 0 (0.0%) |
| 75 Years and older | 175 (100.0%) | 0 (0.0%) |
| Total | 2,856 (99.5%) | 14 (0.5%) |
Health Insurance Coverage by Citizenship Status in Littleton Common
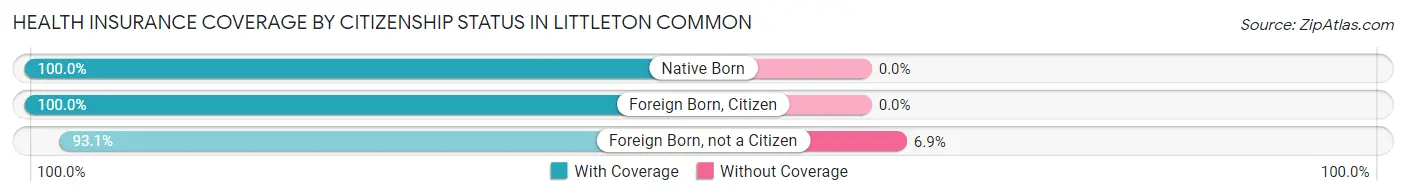
| Citizenship Status | With Coverage | Without Coverage |
| Native Born | 243 (100.0%) | 0 (0.0%) |
| Foreign Born, Citizen | 408 (100.0%) | 0 (0.0%) |
| Foreign Born, not a Citizen | 189 (93.1%) | 14 (6.9%) |
Health Insurance Coverage by Household Income in Littleton Common
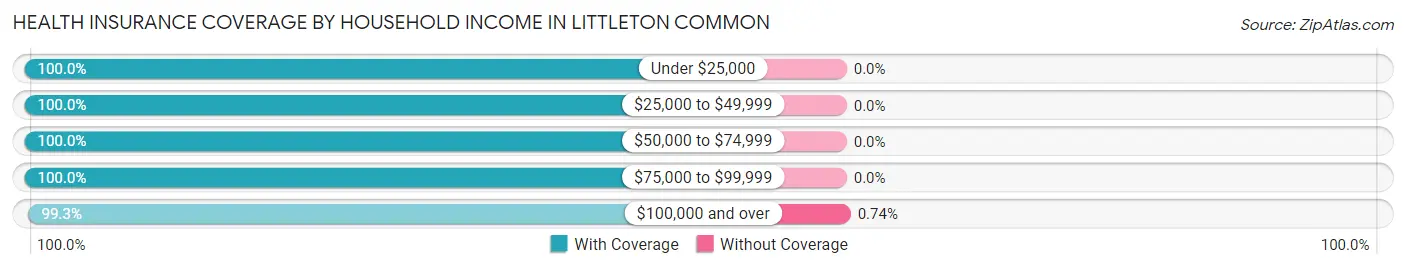
| Household Income | With Coverage | Without Coverage |
| Under $25,000 | 127 (100.0%) | 0 (0.0%) |
| $25,000 to $49,999 | 152 (100.0%) | 0 (0.0%) |
| $50,000 to $74,999 | 524 (100.0%) | 0 (0.0%) |
| $75,000 to $99,999 | 157 (100.0%) | 0 (0.0%) |
| $100,000 and over | 1,887 (99.3%) | 14 (0.7%) |
Public vs Private Health Insurance Coverage by Age in Littleton Common
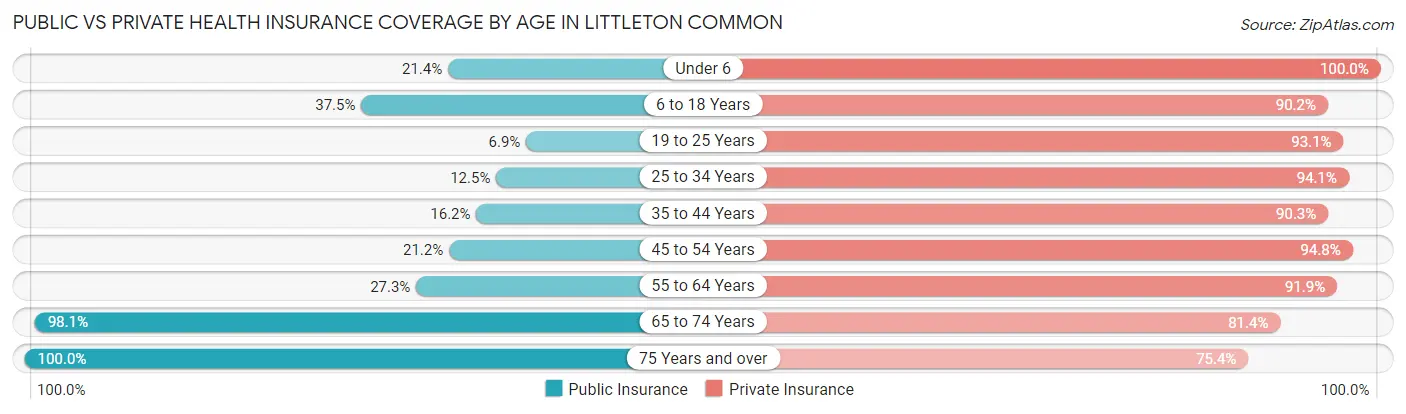
| Age Bracket | Public Insurance | Private Insurance |
| Under 6 | 52 (21.4%) | 243 (100.0%) |
| 6 to 18 Years | 153 (37.5%) | 368 (90.2%) |
| 19 to 25 Years | 14 (6.9%) | 189 (93.1%) |
| 25 to 34 Years | 38 (12.5%) | 287 (94.1%) |
| 35 to 44 Years | 63 (16.2%) | 352 (90.3%) |
| 45 to 54 Years | 98 (21.2%) | 438 (94.8%) |
| 55 to 64 Years | 71 (27.3%) | 239 (91.9%) |
| 65 to 74 Years | 416 (98.1%) | 345 (81.4%) |
| 75 Years and over | 175 (100.0%) | 132 (75.4%) |
| Total | 1,080 (37.6%) | 2,593 (90.3%) |
Disability Status by Sex by Age in Littleton Common
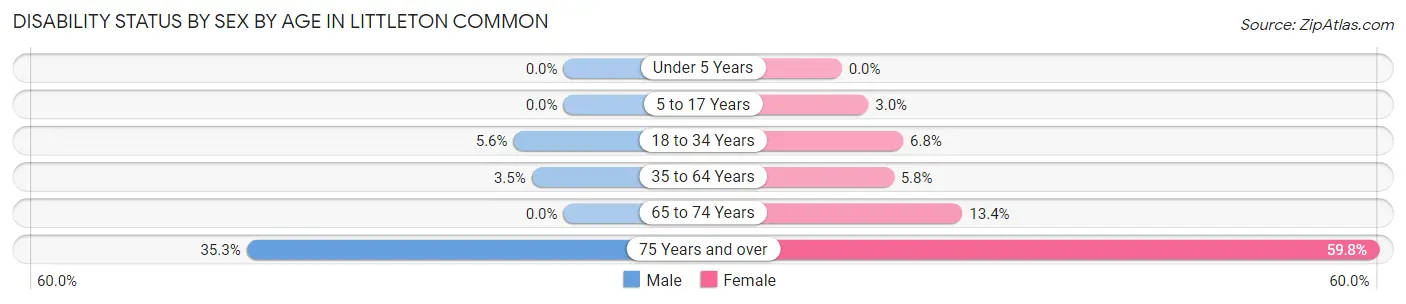
| Age Bracket | Male | Female |
| Under 5 Years | 0 (0.0%) | 0 (0.0%) |
| 5 to 17 Years | 0 (0.0%) | 10 (3.0%) |
| 18 to 34 Years | 16 (5.6%) | 17 (6.8%) |
| 35 to 64 Years | 21 (3.5%) | 30 (5.8%) |
| 65 to 74 Years | 0 (0.0%) | 38 (13.4%) |
| 75 Years and over | 24 (35.3%) | 64 (59.8%) |
Disability Class by Sex by Age in Littleton Common
Disability Class: Hearing Difficulty
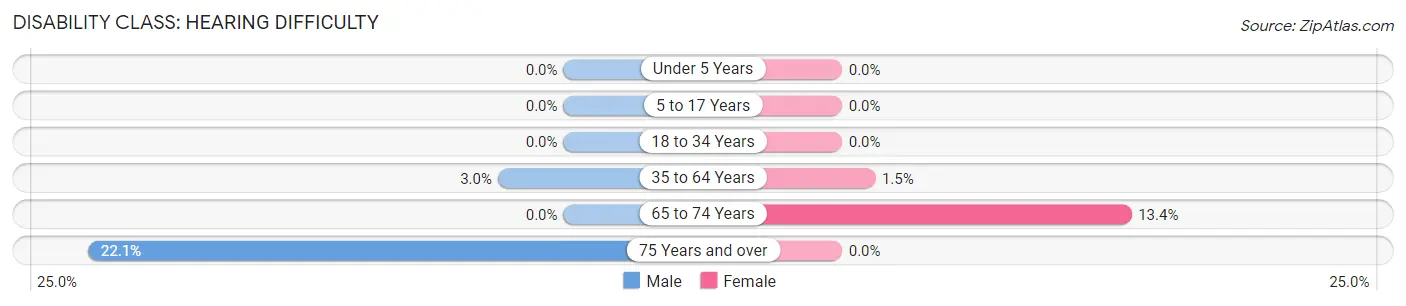
| Age Bracket | Male | Female |
| Under 5 Years | 0 (0.0%) | 0 (0.0%) |
| 5 to 17 Years | 0 (0.0%) | 0 (0.0%) |
| 18 to 34 Years | 0 (0.0%) | 0 (0.0%) |
| 35 to 64 Years | 18 (3.0%) | 8 (1.5%) |
| 65 to 74 Years | 0 (0.0%) | 38 (13.4%) |
| 75 Years and over | 15 (22.1%) | 0 (0.0%) |
Disability Class: Vision Difficulty
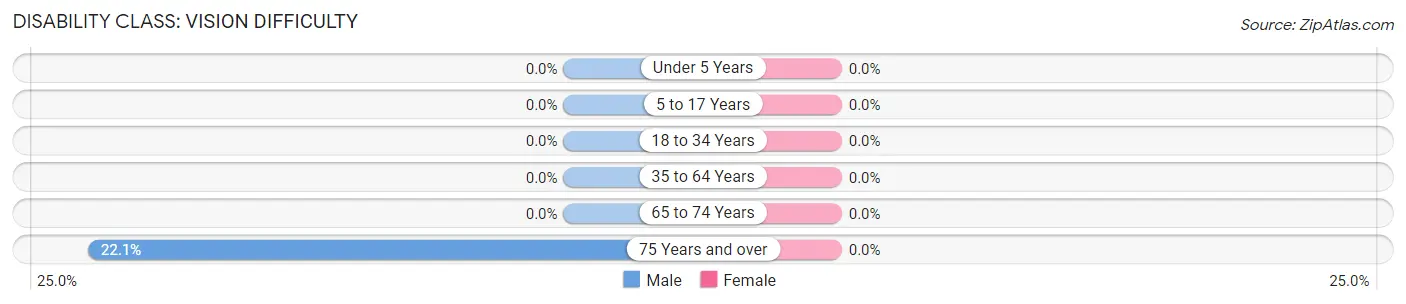
| Age Bracket | Male | Female |
| Under 5 Years | 0 (0.0%) | 0 (0.0%) |
| 5 to 17 Years | 0 (0.0%) | 0 (0.0%) |
| 18 to 34 Years | 0 (0.0%) | 0 (0.0%) |
| 35 to 64 Years | 0 (0.0%) | 0 (0.0%) |
| 65 to 74 Years | 0 (0.0%) | 0 (0.0%) |
| 75 Years and over | 15 (22.1%) | 0 (0.0%) |
Disability Class: Cognitive Difficulty
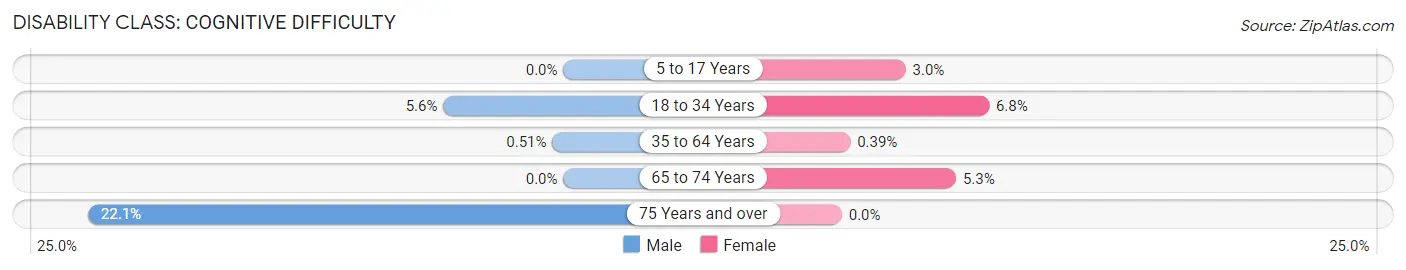
| Age Bracket | Male | Female |
| 5 to 17 Years | 0 (0.0%) | 10 (3.0%) |
| 18 to 34 Years | 16 (5.6%) | 17 (6.8%) |
| 35 to 64 Years | 3 (0.5%) | 2 (0.4%) |
| 65 to 74 Years | 0 (0.0%) | 15 (5.3%) |
| 75 Years and over | 15 (22.1%) | 0 (0.0%) |
Disability Class: Ambulatory Difficulty
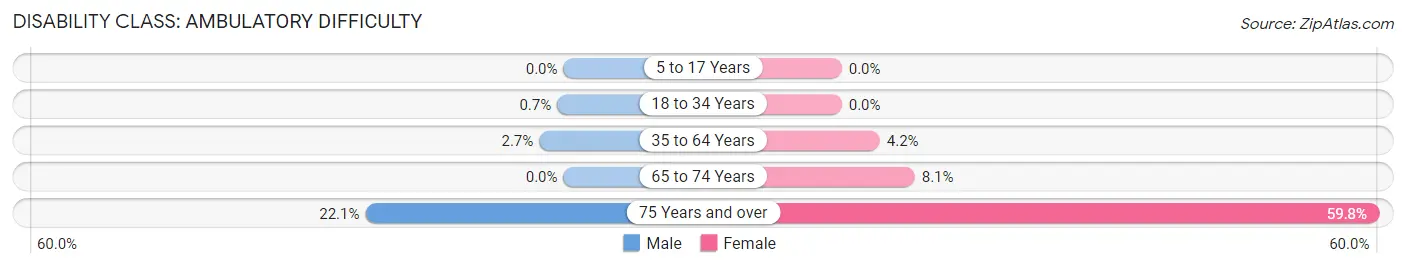
| Age Bracket | Male | Female |
| 5 to 17 Years | 0 (0.0%) | 0 (0.0%) |
| 18 to 34 Years | 2 (0.7%) | 0 (0.0%) |
| 35 to 64 Years | 16 (2.7%) | 22 (4.2%) |
| 65 to 74 Years | 0 (0.0%) | 23 (8.1%) |
| 75 Years and over | 15 (22.1%) | 64 (59.8%) |
Disability Class: Self-Care Difficulty
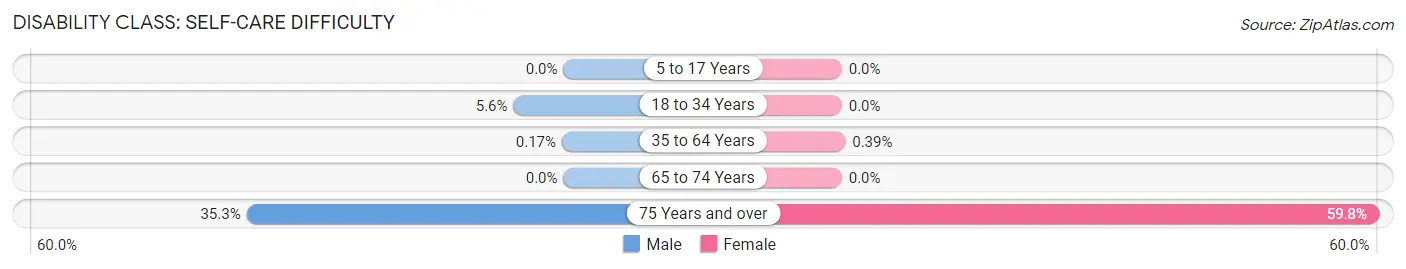
| Age Bracket | Male | Female |
| 5 to 17 Years | 0 (0.0%) | 0 (0.0%) |
| 18 to 34 Years | 16 (5.6%) | 0 (0.0%) |
| 35 to 64 Years | 1 (0.2%) | 2 (0.4%) |
| 65 to 74 Years | 0 (0.0%) | 0 (0.0%) |
| 75 Years and over | 24 (35.3%) | 64 (59.8%) |
Technology Access in Littleton Common
Computing Device Access in Littleton Common
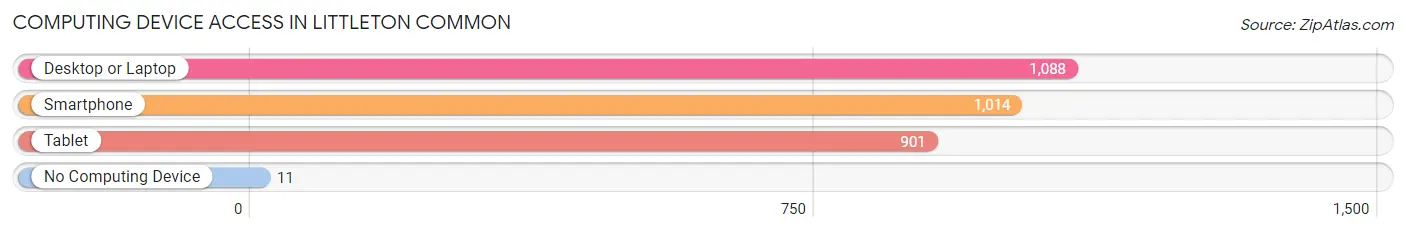
| Device Type | # Households | % Households |
| Desktop or Laptop | 1,088 | 96.4% |
| Smartphone | 1,014 | 89.8% |
| Tablet | 901 | 79.8% |
| No Computing Device | 11 | 1.0% |
| Total | 1,129 | 100.0% |
Internet Access in Littleton Common
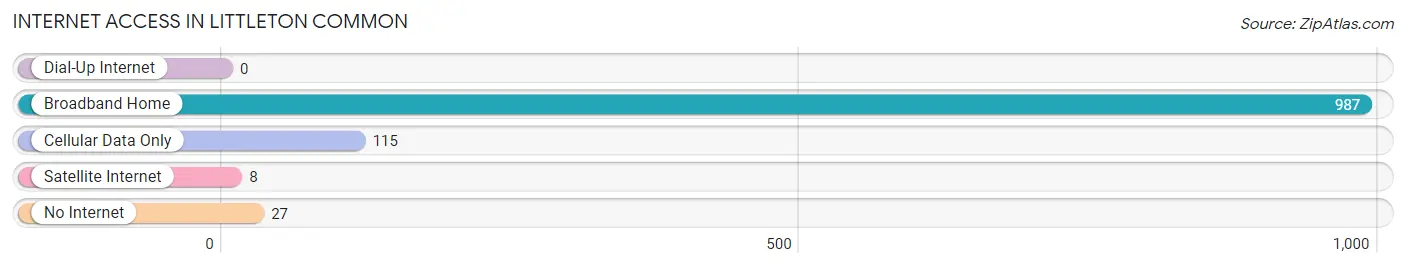
| Internet Type | # Households | % Households |
| Dial-Up Internet | 0 | 0.0% |
| Broadband Home | 987 | 87.4% |
| Cellular Data Only | 115 | 10.2% |
| Satellite Internet | 8 | 0.7% |
| No Internet | 27 | 2.4% |
| Total | 1,129 | 100.0% |
Littleton Common Summary
Littleton Common is a small town located in Middlesex County, Massachusetts. It is situated in the northern part of the state, about 25 miles northwest of Boston. The town was first settled in 1686 and incorporated in 1714. As of the 2010 census, the population of Littleton Common was 5,959.
Geography
Littleton Common is located at 42°33'N, 71°25'W. It is bordered by the towns of Ayer, Harvard, Groton, and Westford. The town is situated on the Nashua River, which flows through the center of town. The town is mostly rural, with a few small businesses and residential areas. The town is also home to the Littleton Common Historic District, which is listed on the National Register of Historic Places.
Economy
The economy of Littleton Common is largely based on agriculture and small businesses. The town is home to several farms, including the Littleton Common Farm, which produces a variety of fruits and vegetables. The town also has several small businesses, including a hardware store, a bakery, and a few restaurants.
Demographics
As of the 2010 census, the population of Littleton Common was 5,959. The racial makeup of the town was 94.3% White, 1.2% African American, 0.3% Native American, 1.2% Asian, 0.1% Pacific Islander, 1.2% from other races, and 1.9% from two or more races. Hispanic or Latino of any race were 3.2% of the population.
The median income for a household in Littleton Common was $68,958, and the median income for a family was $77,958. The per capita income for the town was $30,958. About 4.2% of families and 5.2% of the population were below the poverty line, including 6.2% of those under age 18 and 4.2% of those age 65 or over.
History
Littleton Common was first settled in 1686 and was incorporated in 1714. The town was originally part of the town of Groton, but was later separated and incorporated as its own town. The town was named after the Littleton family, who were among the first settlers of the area.
In the 19th century, Littleton Common was a thriving agricultural community. The town was home to several farms, which produced a variety of crops, including apples, potatoes, and hay. The town also had several mills, which produced lumber and other goods.
In the 20th century, Littleton Common began to transition from an agricultural community to a more suburban one. The town was home to several small businesses, including a hardware store, a bakery, and a few restaurants. The town also had several schools, including Littleton High School, which opened in 1921.
Today, Littleton Common is a small, suburban town. The town is home to several small businesses, including a hardware store, a bakery, and a few restaurants. The town also has several schools, including Littleton High School. The town is also home to the Littleton Common Historic District, which is listed on the National Register of Historic Places.
Common Questions
What is the Total Population of Littleton Common?
Total Population of Littleton Common is 2,870.
What is the Total Male Population of Littleton Common?
Total Male Population of Littleton Common is 1,304.
What is the Total Female Population of Littleton Common?
Total Female Population of Littleton Common is 1,566.
What is the Ratio of Males per 100 Females in Littleton Common?
There are 83.27 Males per 100 Females in Littleton Common.
What is the Ratio of Females per 100 Males in Littleton Common?
There are 120.09 Females per 100 Males in Littleton Common.
What is the Median Population Age in Littleton Common?
Median Population Age in Littleton Common is 41.2 Years.
What is the Average Family Size in Littleton Common
Average Family Size in Littleton Common is 3.0 People.
What is the Average Household Size in Littleton Common
Average Household Size in Littleton Common is 2.5 People.
What is Per Capita Income in Littleton Common?
Per Capita income in Littleton Common is $55,219.
What is the Median Family Income in Littleton Common?
Median Family Income in Littleton Common is $144,732.
What is the Median Household income in Littleton Common?
Median Household Income in Littleton Common is $122,854.
What is Income or Wage Gap in Littleton Common?
Income or Wage Gap in Littleton Common is 39.5%.
Women in Littleton Common earn 60.5 cents for every dollar earned by a man.
What is Inequality or Gini Index in Littleton Common?
Inequality or Gini Index in Littleton Common is 0.36.
How Large is the Labor Force in Littleton Common?
There are 1,494 People in the Labor Forcein in Littleton Common.
What is the Percentage of People in the Labor Force in Littleton Common?
63.1% of People are in the Labor Force in Littleton Common.
What is the Unemployment Rate in Littleton Common?
Unemployment Rate in Littleton Common is 9.1%.