Cities with the Most Immigrants from Western Asia in Massachusetts
RELATED REPORTS & OPTIONS
Western Asia
Massachusetts
Compare Cities
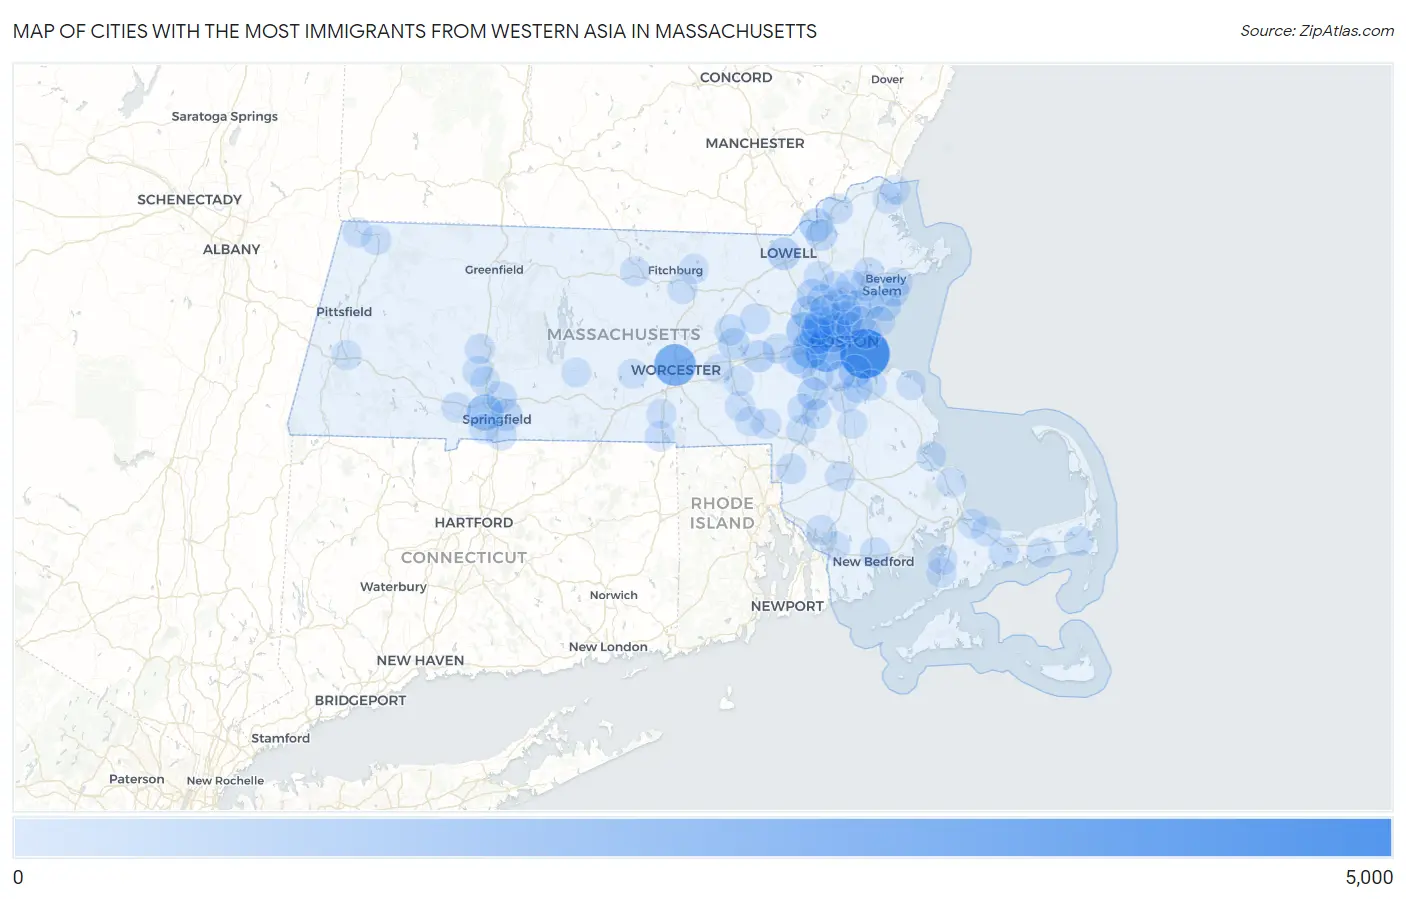
Map of Cities with the Most Immigrants from Western Asia in Massachusetts
0
5,000
Cities with the Most Immigrants from Western Asia in Massachusetts
| City | Western Asia | vs State | vs National | |
| 1. | Boston | 4,109 | 35,882(11.45%)#1 | 1,204,112(0.34%)#26 |
| 2. | Worcester | 2,448 | 35,882(6.82%)#2 | 1,204,112(0.20%)#48 |
| 3. | Brookline | 2,327 | 35,882(6.49%)#3 | 1,204,112(0.19%)#53 |
| 4. | Cambridge | 1,471 | 35,882(4.10%)#4 | 1,204,112(0.12%)#86 |
| 5. | Newton | 1,392 | 35,882(3.88%)#5 | 1,204,112(0.12%)#92 |
| 6. | West Springfield Town | 1,295 | 35,882(3.61%)#6 | 1,204,112(0.11%)#103 |
| 7. | Watertown Town | 1,200 | 35,882(3.34%)#7 | 1,204,112(0.10%)#112 |
| 8. | Waltham | 1,047 | 35,882(2.92%)#8 | 1,204,112(0.09%)#138 |
| 9. | Methuen Town | 674 | 35,882(1.88%)#9 | 1,204,112(0.06%)#246 |
| 10. | Lexington | 639 | 35,882(1.78%)#10 | 1,204,112(0.05%)#262 |
| 11. | Malden | 620 | 35,882(1.73%)#11 | 1,204,112(0.05%)#271 |
| 12. | Quincy | 601 | 35,882(1.67%)#12 | 1,204,112(0.05%)#282 |
| 13. | Belmont | 547 | 35,882(1.52%)#13 | 1,204,112(0.05%)#306 |
| 14. | Lowell | 531 | 35,882(1.48%)#14 | 1,204,112(0.04%)#316 |
| 15. | Norwood | 530 | 35,882(1.48%)#15 | 1,204,112(0.04%)#318 |
| 16. | Swampscott | 507 | 35,882(1.41%)#16 | 1,204,112(0.04%)#331 |
| 17. | Somerville | 452 | 35,882(1.26%)#17 | 1,204,112(0.04%)#382 |
| 18. | Springfield | 431 | 35,882(1.20%)#18 | 1,204,112(0.04%)#401 |
| 19. | Burlington | 413 | 35,882(1.15%)#19 | 1,204,112(0.03%)#422 |
| 20. | Framingham | 393 | 35,882(1.10%)#20 | 1,204,112(0.03%)#441 |
| 21. | Arlington | 375 | 35,882(1.05%)#21 | 1,204,112(0.03%)#461 |
| 22. | Lawrence | 341 | 35,882(0.95%)#22 | 1,204,112(0.03%)#509 |
| 23. | Marlborough | 323 | 35,882(0.90%)#23 | 1,204,112(0.03%)#536 |
| 24. | Dedham | 302 | 35,882(0.84%)#24 | 1,204,112(0.03%)#574 |
| 25. | Medford | 282 | 35,882(0.79%)#25 | 1,204,112(0.02%)#611 |
| 26. | Woburn | 275 | 35,882(0.77%)#26 | 1,204,112(0.02%)#635 |
| 27. | Salem | 261 | 35,882(0.73%)#27 | 1,204,112(0.02%)#668 |
| 28. | Needham | 245 | 35,882(0.68%)#28 | 1,204,112(0.02%)#709 |
| 29. | Lynn | 227 | 35,882(0.63%)#29 | 1,204,112(0.02%)#757 |
| 30. | Chicopee | 224 | 35,882(0.62%)#30 | 1,204,112(0.02%)#762 |
| 31. | Hudson | 209 | 35,882(0.58%)#31 | 1,204,112(0.02%)#808 |
| 32. | Saugus | 206 | 35,882(0.57%)#32 | 1,204,112(0.02%)#818 |
| 33. | Weymouth Town | 186 | 35,882(0.52%)#33 | 1,204,112(0.02%)#884 |
| 34. | Amherst | 173 | 35,882(0.48%)#34 | 1,204,112(0.01%)#933 |
| 35. | Longmeadow | 165 | 35,882(0.46%)#35 | 1,204,112(0.01%)#966 |
| 36. | Peabody | 154 | 35,882(0.43%)#36 | 1,204,112(0.01%)#1,020 |
| 37. | Randolph Town | 146 | 35,882(0.41%)#37 | 1,204,112(0.01%)#1,058 |
| 38. | Stoneham | 138 | 35,882(0.38%)#38 | 1,204,112(0.01%)#1,098 |
| 39. | Danvers | 136 | 35,882(0.38%)#39 | 1,204,112(0.01%)#1,114 |
| 40. | Attleboro | 129 | 35,882(0.36%)#40 | 1,204,112(0.01%)#1,159 |
| 41. | Maynard | 129 | 35,882(0.36%)#41 | 1,204,112(0.01%)#1,164 |
| 42. | Winchester | 128 | 35,882(0.36%)#42 | 1,204,112(0.01%)#1,171 |
| 43. | Braintree Town | 123 | 35,882(0.34%)#43 | 1,204,112(0.01%)#1,207 |
| 44. | New Bedford | 121 | 35,882(0.34%)#44 | 1,204,112(0.01%)#1,216 |
| 45. | Barnstable Town | 113 | 35,882(0.31%)#45 | 1,204,112(0.01%)#1,270 |
| 46. | Haverhill | 112 | 35,882(0.31%)#46 | 1,204,112(0.01%)#1,277 |
| 47. | Easthampton Town | 111 | 35,882(0.31%)#47 | 1,204,112(0.01%)#1,301 |
| 48. | North Attleborough | 109 | 35,882(0.30%)#48 | 1,204,112(0.01%)#1,312 |
| 49. | Everett | 93 | 35,882(0.26%)#49 | 1,204,112(0.01%)#1,437 |
| 50. | Somerset | 93 | 35,882(0.26%)#50 | 1,204,112(0.01%)#1,442 |
| 51. | Beverly | 91 | 35,882(0.25%)#51 | 1,204,112(0.01%)#1,455 |
| 52. | Wakefield | 89 | 35,882(0.25%)#52 | 1,204,112(0.01%)#1,484 |
| 53. | Webster | 87 | 35,882(0.24%)#53 | 1,204,112(0.01%)#1,509 |
| 54. | Westfield | 82 | 35,882(0.23%)#54 | 1,204,112(0.01%)#1,555 |
| 55. | Foxborough | 79 | 35,882(0.22%)#55 | 1,204,112(0.01%)#1,600 |
| 56. | Chelsea | 78 | 35,882(0.22%)#56 | 1,204,112(0.01%)#1,606 |
| 57. | Wellesley | 78 | 35,882(0.22%)#57 | 1,204,112(0.01%)#1,609 |
| 58. | Milford | 76 | 35,882(0.21%)#58 | 1,204,112(0.01%)#1,637 |
| 59. | Leominster | 73 | 35,882(0.20%)#59 | 1,204,112(0.01%)#1,670 |
| 60. | Franklin Town | 69 | 35,882(0.19%)#60 | 1,204,112(0.01%)#1,721 |
| 61. | Walpole | 68 | 35,882(0.19%)#61 | 1,204,112(0.01%)#1,742 |
| 62. | Wilmington | 64 | 35,882(0.18%)#62 | 1,204,112(0.01%)#1,810 |
| 63. | Lynnfield | 63 | 35,882(0.18%)#63 | 1,204,112(0.01%)#1,830 |
| 64. | East Harwich | 61 | 35,882(0.17%)#64 | 1,204,112(0.01%)#1,871 |
| 65. | Melrose | 60 | 35,882(0.17%)#65 | 1,204,112(0.00%)#1,878 |
| 66. | Gardner | 55 | 35,882(0.15%)#66 | 1,204,112(0.00%)#1,956 |
| 67. | Sharon | 53 | 35,882(0.15%)#67 | 1,204,112(0.00%)#2,009 |
| 68. | Revere | 47 | 35,882(0.13%)#68 | 1,204,112(0.00%)#2,111 |
| 69. | Northampton | 43 | 35,882(0.12%)#69 | 1,204,112(0.00%)#2,214 |
| 70. | Cochituate | 43 | 35,882(0.12%)#70 | 1,204,112(0.00%)#2,227 |
| 71. | North Plymouth | 42 | 35,882(0.12%)#71 | 1,204,112(0.00%)#2,249 |
| 72. | Taunton | 41 | 35,882(0.11%)#72 | 1,204,112(0.00%)#2,257 |
| 73. | North Adams | 40 | 35,882(0.11%)#73 | 1,204,112(0.00%)#2,291 |
| 74. | Agawam Town | 39 | 35,882(0.11%)#74 | 1,204,112(0.00%)#2,311 |
| 75. | East Sandwich | 38 | 35,882(0.11%)#75 | 1,204,112(0.00%)#2,355 |
| 76. | Winthrop Town | 35 | 35,882(0.10%)#76 | 1,204,112(0.00%)#2,419 |
| 77. | West Falmouth | 35 | 35,882(0.10%)#77 | 1,204,112(0.00%)#2,438 |
| 78. | North Scituate | 32 | 35,882(0.09%)#78 | 1,204,112(0.00%)#2,535 |
| 79. | Fall River | 29 | 35,882(0.08%)#79 | 1,204,112(0.00%)#2,612 |
| 80. | Salisbury | 26 | 35,882(0.07%)#80 | 1,204,112(0.00%)#2,782 |
| 81. | The Pinehills | 26 | 35,882(0.07%)#81 | 1,204,112(0.00%)#2,784 |
| 82. | Bellingham | 26 | 35,882(0.07%)#82 | 1,204,112(0.00%)#2,786 |
| 83. | Lee | 26 | 35,882(0.07%)#83 | 1,204,112(0.00%)#2,799 |
| 84. | Brockton | 24 | 35,882(0.07%)#84 | 1,204,112(0.00%)#2,845 |
| 85. | Lunenburg | 24 | 35,882(0.07%)#85 | 1,204,112(0.00%)#2,893 |
| 86. | Williamstown | 21 | 35,882(0.06%)#86 | 1,204,112(0.00%)#3,044 |
| 87. | Nahant | 21 | 35,882(0.06%)#87 | 1,204,112(0.00%)#3,049 |
| 88. | Holyoke | 20 | 35,882(0.06%)#88 | 1,204,112(0.00%)#3,056 |
| 89. | Milton | 19 | 35,882(0.05%)#89 | 1,204,112(0.00%)#3,118 |
| 90. | Ware | 18 | 35,882(0.05%)#90 | 1,204,112(0.00%)#3,210 |
| 91. | Spencer | 18 | 35,882(0.05%)#91 | 1,204,112(0.00%)#3,216 |
| 92. | Oxford | 18 | 35,882(0.05%)#92 | 1,204,112(0.00%)#3,220 |
| 93. | Reading | 17 | 35,882(0.05%)#93 | 1,204,112(0.00%)#3,252 |
| 94. | Hopkinton | 17 | 35,882(0.05%)#94 | 1,204,112(0.00%)#3,293 |
| 95. | Greenfield | 15 | 35,882(0.04%)#95 | 1,204,112(0.00%)#3,413 |
| 96. | South Yarmouth | 15 | 35,882(0.04%)#96 | 1,204,112(0.00%)#3,418 |
| 97. | Westborough | 15 | 35,882(0.04%)#97 | 1,204,112(0.00%)#3,444 |
| 98. | North Falmouth | 15 | 35,882(0.04%)#98 | 1,204,112(0.00%)#3,452 |
| 99. | Newburyport | 14 | 35,882(0.04%)#99 | 1,204,112(0.00%)#3,478 |
| 100. | Sandwich | 14 | 35,882(0.04%)#100 | 1,204,112(0.00%)#3,527 |
Common Questions
What are the Top 10 Cities with the Most Immigrants from Western Asia in Massachusetts?
Top 10 Cities with the Most Immigrants from Western Asia in Massachusetts are:
#1
4,109
#2
2,448
#3
2,327
#4
1,471
#5
1,392
#6
1,295
#7
1,200
#8
1,047
#9
674
#10
639
What city has the Most Immigrants from Western Asia in Massachusetts?
Boston has the Most Immigrants from Western Asia in Massachusetts with 4,109.
What is the Total Immigrants from Western Asia in the State of Massachusetts?
Total Immigrants from Western Asia in Massachusetts is 35,882.
What is the Total Immigrants from Western Asia in the United States?
Total Immigrants from Western Asia in the United States is 1,204,112.