Cities with the Highest Percentage of Sri Lankan Population in Massachusetts
RELATED REPORTS & OPTIONS
Sri Lankan
Massachusetts
Compare Cities
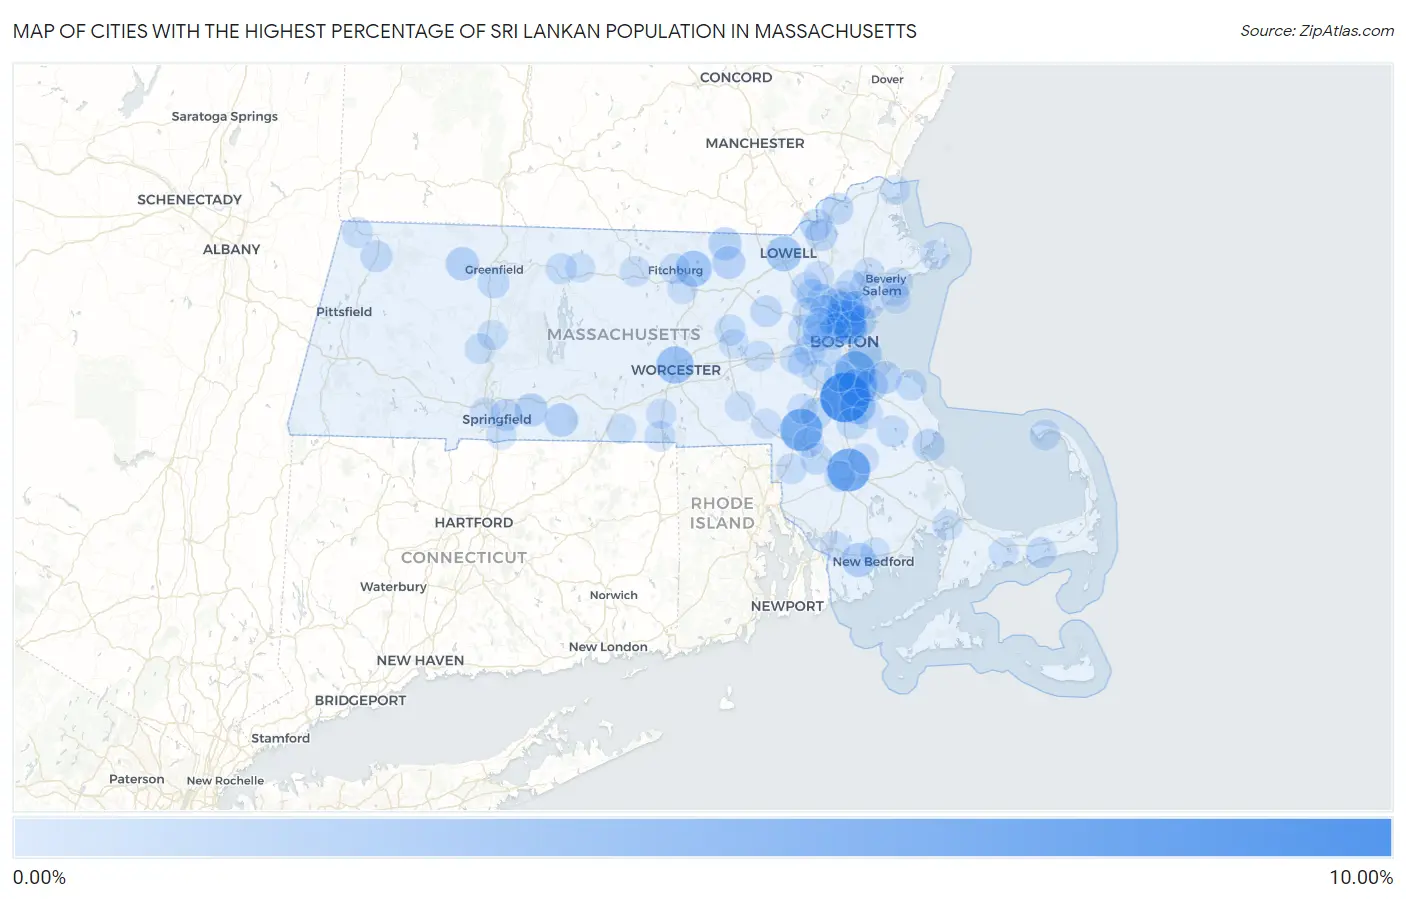
Map of Cities with the Highest Percentage of Sri Lankan Population in Massachusetts
0.00%
10.00%
Cities with the Highest Percentage of Sri Lankan Population in Massachusetts
| City | Sri Lankan | vs State | vs National | |
| 1. | Randolph Town | 8.99% | 0.89%(+8.10)#1 | 0.68%(+8.31)#62 |
| 2. | Raynham Center | 5.89% | 0.89%(+5.01)#2 | 0.68%(+5.21)#121 |
| 3. | Foxborough | 5.61% | 0.89%(+4.72)#3 | 0.68%(+4.93)#133 |
| 4. | Quincy | 4.67% | 0.89%(+3.78)#4 | 0.68%(+3.99)#184 |
| 5. | Everett | 4.15% | 0.89%(+3.27)#5 | 0.68%(+3.47)#221 |
| 6. | Braintree Town | 3.89% | 0.89%(+3.00)#6 | 0.68%(+3.21)#246 |
| 7. | Malden | 3.81% | 0.89%(+2.92)#7 | 0.68%(+3.13)#258 |
| 8. | Worcester | 3.35% | 0.89%(+2.46)#8 | 0.68%(+2.67)#322 |
| 9. | Melrose | 3.22% | 0.89%(+2.33)#9 | 0.68%(+2.54)#345 |
| 10. | Lunenburg | 2.79% | 0.89%(+1.91)#10 | 0.68%(+2.11)#436 |
| 11. | Holbrook | 2.55% | 0.89%(+1.66)#11 | 0.68%(+1.87)#488 |
| 12. | Lowell | 2.35% | 0.89%(+1.46)#12 | 0.68%(+1.67)#551 |
| 13. | Smith Mills | 1.89% | 0.89%(+1.00)#13 | 0.68%(+1.21)#734 |
| 14. | Amherst | 1.76% | 0.89%(+0.875)#14 | 0.68%(+1.08)#804 |
| 15. | Boston | 1.71% | 0.89%(+0.822)#15 | 0.68%(+1.03)#840 |
| 16. | Shelburne Falls | 1.65% | 0.89%(+0.762)#16 | 0.68%(+0.970)#884 |
| 17. | Monson Center | 1.61% | 0.89%(+0.728)#17 | 0.68%(+0.935)#906 |
| 18. | Wilbraham | 1.51% | 0.89%(+0.625)#18 | 0.68%(+0.832)#995 |
| 19. | Weymouth Town | 1.46% | 0.89%(+0.578)#19 | 0.68%(+0.786)#1,038 |
| 20. | Pepperell | 1.45% | 0.89%(+0.565)#20 | 0.68%(+0.773)#1,047 |
| 21. | Chelsea | 1.36% | 0.89%(+0.473)#21 | 0.68%(+0.680)#1,133 |
| 22. | Groton | 1.36% | 0.89%(+0.473)#22 | 0.68%(+0.680)#1,134 |
| 23. | Hingham | 1.28% | 0.89%(+0.399)#23 | 0.68%(+0.606)#1,216 |
| 24. | Revere | 1.24% | 0.89%(+0.351)#24 | 0.68%(+0.558)#1,275 |
| 25. | Lawrence | 1.09% | 0.89%(+0.201)#25 | 0.68%(+0.408)#1,449 |
| 26. | Methuen Town | 1.06% | 0.89%(+0.177)#26 | 0.68%(+0.384)#1,480 |
| 27. | Stoneham | 1.06% | 0.89%(+0.171)#27 | 0.68%(+0.378)#1,491 |
| 28. | South Duxbury | 1.03% | 0.89%(+0.141)#28 | 0.68%(+0.348)#1,529 |
| 29. | Springfield | 0.99% | 0.89%(+0.108)#29 | 0.68%(+0.315)#1,571 |
| 30. | Sharon | 0.94% | 0.89%(+0.050)#30 | 0.68%(+0.257)#1,671 |
| 31. | Haverhill | 0.91% | 0.89%(+0.027)#31 | 0.68%(+0.234)#1,726 |
| 32. | Burlington | 0.90% | 0.89%(+0.012)#32 | 0.68%(+0.220)#1,747 |
| 33. | Medford | 0.90% | 0.89%(+0.011)#33 | 0.68%(+0.219)#1,748 |
| 34. | Woburn | 0.89% | 0.89%(+0.005)#34 | 0.68%(+0.212)#1,756 |
| 35. | Adams | 0.87% | 0.89%(-0.012)#35 | 0.68%(+0.195)#1,780 |
| 36. | Cambridge | 0.84% | 0.89%(-0.044)#36 | 0.68%(+0.163)#1,835 |
| 37. | West Concord | 0.84% | 0.89%(-0.049)#37 | 0.68%(+0.159)#1,847 |
| 38. | Deerfield | 0.82% | 0.89%(-0.063)#38 | 0.68%(+0.145)#1,877 |
| 39. | Norton Center | 0.81% | 0.89%(-0.072)#39 | 0.68%(+0.135)#1,897 |
| 40. | Newton | 0.78% | 0.89%(-0.110)#40 | 0.68%(+0.097)#1,985 |
| 41. | Hanson | 0.77% | 0.89%(-0.119)#41 | 0.68%(+0.088)#2,001 |
| 42. | Somerville | 0.73% | 0.89%(-0.153)#42 | 0.68%(+0.055)#2,077 |
| 43. | North Attleborough | 0.73% | 0.89%(-0.157)#43 | 0.68%(+0.050)#2,085 |
| 44. | Brockton | 0.67% | 0.89%(-0.215)#44 | 0.68%(-0.008)#2,248 |
| 45. | Taunton | 0.66% | 0.89%(-0.223)#45 | 0.68%(-0.016)#2,268 |
| 46. | Waltham | 0.64% | 0.89%(-0.249)#46 | 0.68%(-0.042)#2,335 |
| 47. | South Yarmouth | 0.63% | 0.89%(-0.259)#47 | 0.68%(-0.052)#2,365 |
| 48. | Milton | 0.62% | 0.89%(-0.264)#48 | 0.68%(-0.056)#2,376 |
| 49. | North Scituate | 0.56% | 0.89%(-0.322)#49 | 0.68%(-0.115)#2,538 |
| 50. | Orange | 0.56% | 0.89%(-0.323)#50 | 0.68%(-0.116)#2,542 |
| 51. | Pinehurst | 0.54% | 0.89%(-0.341)#51 | 0.68%(-0.134)#2,598 |
| 52. | Hudson | 0.54% | 0.89%(-0.344)#52 | 0.68%(-0.136)#2,605 |
| 53. | Brookline | 0.50% | 0.89%(-0.387)#53 | 0.68%(-0.179)#2,755 |
| 54. | Provincetown | 0.50% | 0.89%(-0.391)#54 | 0.68%(-0.183)#2,770 |
| 55. | Wakefield | 0.49% | 0.89%(-0.394)#55 | 0.68%(-0.187)#2,784 |
| 56. | Gardner | 0.49% | 0.89%(-0.397)#56 | 0.68%(-0.190)#2,801 |
| 57. | Beverly | 0.48% | 0.89%(-0.402)#57 | 0.68%(-0.195)#2,819 |
| 58. | Framingham | 0.46% | 0.89%(-0.422)#58 | 0.68%(-0.215)#2,889 |
| 59. | Fitchburg | 0.46% | 0.89%(-0.424)#59 | 0.68%(-0.217)#2,893 |
| 60. | Lexington | 0.42% | 0.89%(-0.465)#60 | 0.68%(-0.258)#3,060 |
| 61. | Webster | 0.42% | 0.89%(-0.470)#61 | 0.68%(-0.263)#3,077 |
| 62. | Northampton | 0.40% | 0.89%(-0.482)#62 | 0.68%(-0.275)#3,136 |
| 63. | Williamstown | 0.40% | 0.89%(-0.486)#63 | 0.68%(-0.278)#3,154 |
| 64. | Abington | 0.40% | 0.89%(-0.486)#64 | 0.68%(-0.279)#3,157 |
| 65. | Attleboro | 0.39% | 0.89%(-0.496)#65 | 0.68%(-0.288)#3,206 |
| 66. | Lynn | 0.38% | 0.89%(-0.503)#66 | 0.68%(-0.296)#3,249 |
| 67. | Peabody | 0.38% | 0.89%(-0.506)#67 | 0.68%(-0.298)#3,255 |
| 68. | Leominster | 0.37% | 0.89%(-0.519)#68 | 0.68%(-0.312)#3,307 |
| 69. | Walpole | 0.33% | 0.89%(-0.556)#69 | 0.68%(-0.349)#3,508 |
| 70. | Watertown Town | 0.33% | 0.89%(-0.559)#70 | 0.68%(-0.352)#3,523 |
| 71. | Winchester | 0.32% | 0.89%(-0.566)#71 | 0.68%(-0.358)#3,548 |
| 72. | Saugus | 0.31% | 0.89%(-0.574)#72 | 0.68%(-0.367)#3,592 |
| 73. | Wilmington | 0.31% | 0.89%(-0.575)#73 | 0.68%(-0.368)#3,599 |
| 74. | Fall River | 0.31% | 0.89%(-0.580)#74 | 0.68%(-0.373)#3,623 |
| 75. | Hatfield | 0.30% | 0.89%(-0.585)#75 | 0.68%(-0.378)#3,649 |
| 76. | Danvers | 0.28% | 0.89%(-0.603)#76 | 0.68%(-0.395)#3,733 |
| 77. | West Springfield Town | 0.28% | 0.89%(-0.604)#77 | 0.68%(-0.397)#3,741 |
| 78. | Mansfield Center | 0.27% | 0.89%(-0.613)#78 | 0.68%(-0.405)#3,787 |
| 79. | Buzzards Bay | 0.27% | 0.89%(-0.618)#79 | 0.68%(-0.411)#3,823 |
| 80. | Salem | 0.26% | 0.89%(-0.623)#80 | 0.68%(-0.416)#3,849 |
| 81. | Bridgewater Town | 0.26% | 0.89%(-0.626)#81 | 0.68%(-0.419)#3,866 |
| 82. | Oxford | 0.26% | 0.89%(-0.627)#82 | 0.68%(-0.420)#3,871 |
| 83. | Dedham | 0.25% | 0.89%(-0.635)#83 | 0.68%(-0.428)#3,925 |
| 84. | Franklin Town | 0.25% | 0.89%(-0.636)#84 | 0.68%(-0.428)#3,927 |
| 85. | Wellesley | 0.24% | 0.89%(-0.641)#85 | 0.68%(-0.434)#3,960 |
| 86. | Belmont | 0.24% | 0.89%(-0.645)#86 | 0.68%(-0.438)#3,982 |
| 87. | Greenfield | 0.23% | 0.89%(-0.654)#87 | 0.68%(-0.447)#4,027 |
| 88. | Lynnfield | 0.22% | 0.89%(-0.669)#88 | 0.68%(-0.462)#4,138 |
| 89. | Southbridge Town | 0.20% | 0.89%(-0.682)#89 | 0.68%(-0.475)#4,227 |
| 90. | Gloucester | 0.19% | 0.89%(-0.691)#90 | 0.68%(-0.484)#4,281 |
| 91. | Needham | 0.18% | 0.89%(-0.701)#91 | 0.68%(-0.494)#4,347 |
| 92. | Milford | 0.18% | 0.89%(-0.704)#92 | 0.68%(-0.497)#4,375 |
| 93. | Arlington | 0.18% | 0.89%(-0.705)#93 | 0.68%(-0.498)#4,381 |
| 94. | New Bedford | 0.18% | 0.89%(-0.706)#94 | 0.68%(-0.499)#4,389 |
| 95. | Athol | 0.17% | 0.89%(-0.711)#95 | 0.68%(-0.504)#4,427 |
| 96. | Longmeadow | 0.16% | 0.89%(-0.721)#96 | 0.68%(-0.514)#4,517 |
| 97. | Marlborough | 0.13% | 0.89%(-0.753)#97 | 0.68%(-0.546)#4,737 |
| 98. | Barnstable Town | 0.13% | 0.89%(-0.753)#98 | 0.68%(-0.546)#4,738 |
| 99. | Salisbury | 0.13% | 0.89%(-0.753)#99 | 0.68%(-0.546)#4,739 |
| 100. | Marblehead | 0.13% | 0.89%(-0.758)#100 | 0.68%(-0.551)#4,780 |
Common Questions
What are the Top 10 Cities with the Highest Percentage of Sri Lankan Population in Massachusetts?
Top 10 Cities with the Highest Percentage of Sri Lankan Population in Massachusetts are:
#1
8.99%
#2
5.89%
#3
5.61%
#4
4.67%
#5
4.15%
#6
3.89%
#7
3.81%
#8
3.35%
#9
3.22%
#10
2.79%
What city has the Highest Percentage of Sri Lankan Population in Massachusetts?
Randolph Town has the Highest Percentage of Sri Lankan Population in Massachusetts with 8.99%.
What is the Percentage of Sri Lankan Population in the State of Massachusetts?
Percentage of Sri Lankan Population in Massachusetts is 0.89%.
What is the Percentage of Sri Lankan Population in the United States?
Percentage of Sri Lankan Population in the United States is 0.68%.