West Falmouth, MA
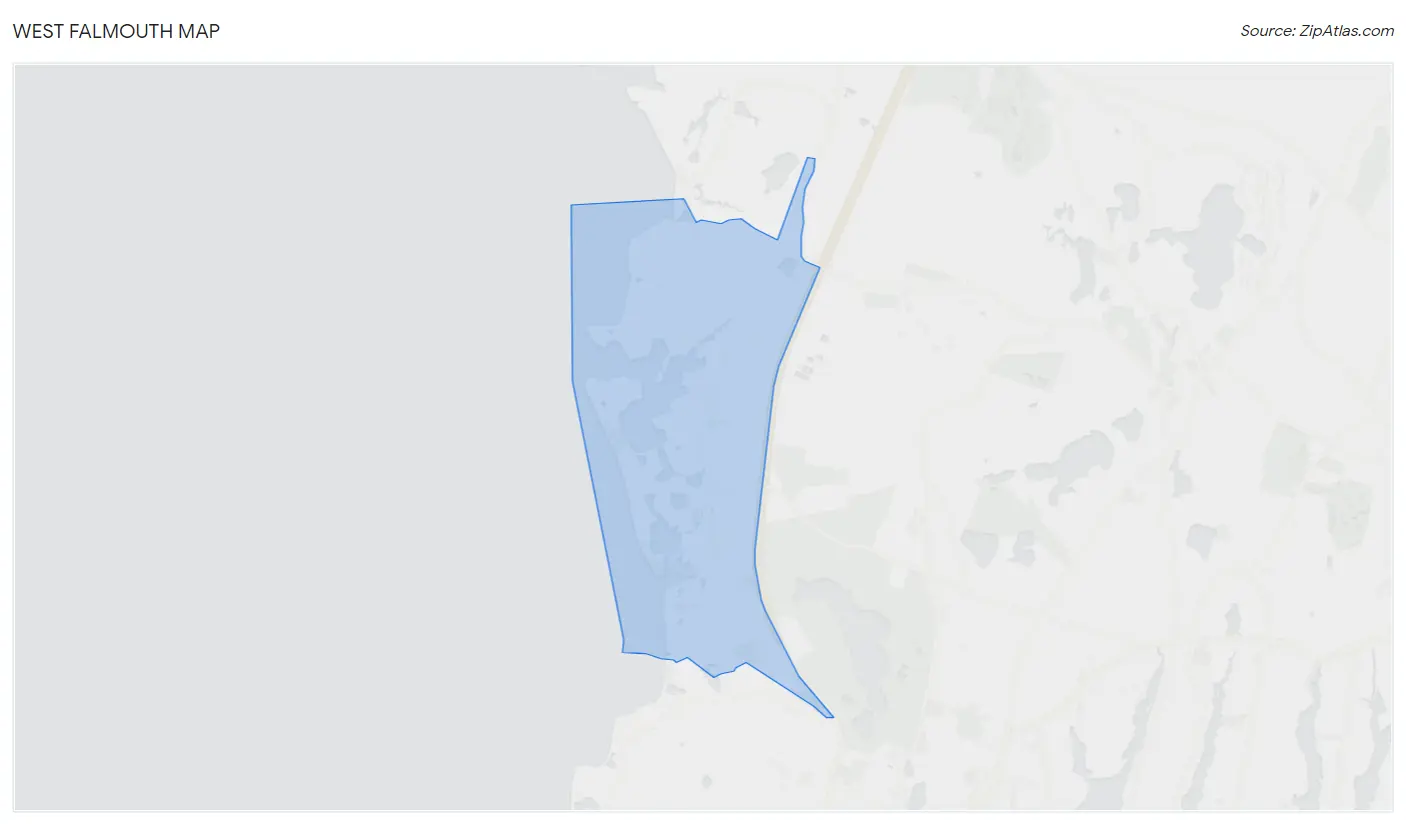
West Falmouth Map
West Falmouth Overview
1,793
TOTAL POPULATION
809
MALE POPULATION
984
FEMALE POPULATION
82.22
MALES / 100 FEMALES
121.63
FEMALES / 100 MALES
61.4
MEDIAN AGE
2.7
AVG FAMILY SIZE
2.4
AVG HOUSEHOLD SIZE
$83,057
PER CAPITA INCOME
$182,262
AVG FAMILY INCOME
$167,083
AVG HOUSEHOLD INCOME
0.44
INEQUALITY / GINI INDEX
875
LABOR FORCE [ PEOPLE ]
54.5%
PERCENT IN LABOR FORCE
8.7%
UNEMPLOYMENT RATE
West Falmouth Area Codes
Race in West Falmouth
The most populous races in West Falmouth are White / Caucasian (1,780 | 99.3%), Hispanic or Latino (8 | 0.4%), and Some other Race (8 | 0.4%).
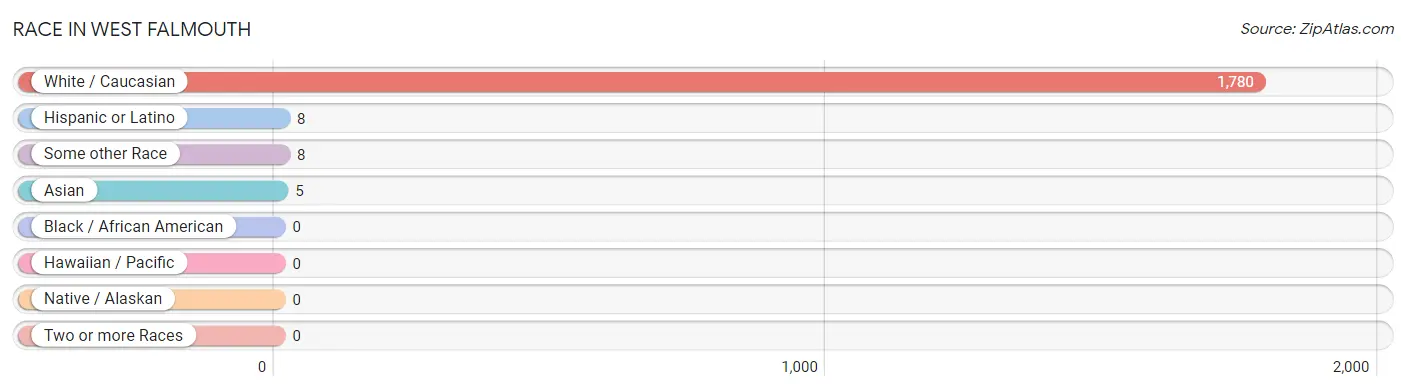
| Race | # Population | % Population |
| Asian | 5 | 0.3% |
| Black / African American | 0 | 0.0% |
| Hawaiian / Pacific | 0 | 0.0% |
| Hispanic or Latino | 8 | 0.4% |
| Native / Alaskan | 0 | 0.0% |
| White / Caucasian | 1,780 | 99.3% |
| Two or more Races | 0 | 0.0% |
| Some other Race | 8 | 0.4% |
| Total | 1,793 | 100.0% |
Ancestry in West Falmouth
The most populous ancestries reported in West Falmouth are Irish (383 | 21.4%), American (267 | 14.9%), English (249 | 13.9%), Polish (189 | 10.5%), and German (151 | 8.4%), together accounting for 69.1% of all West Falmouth residents.
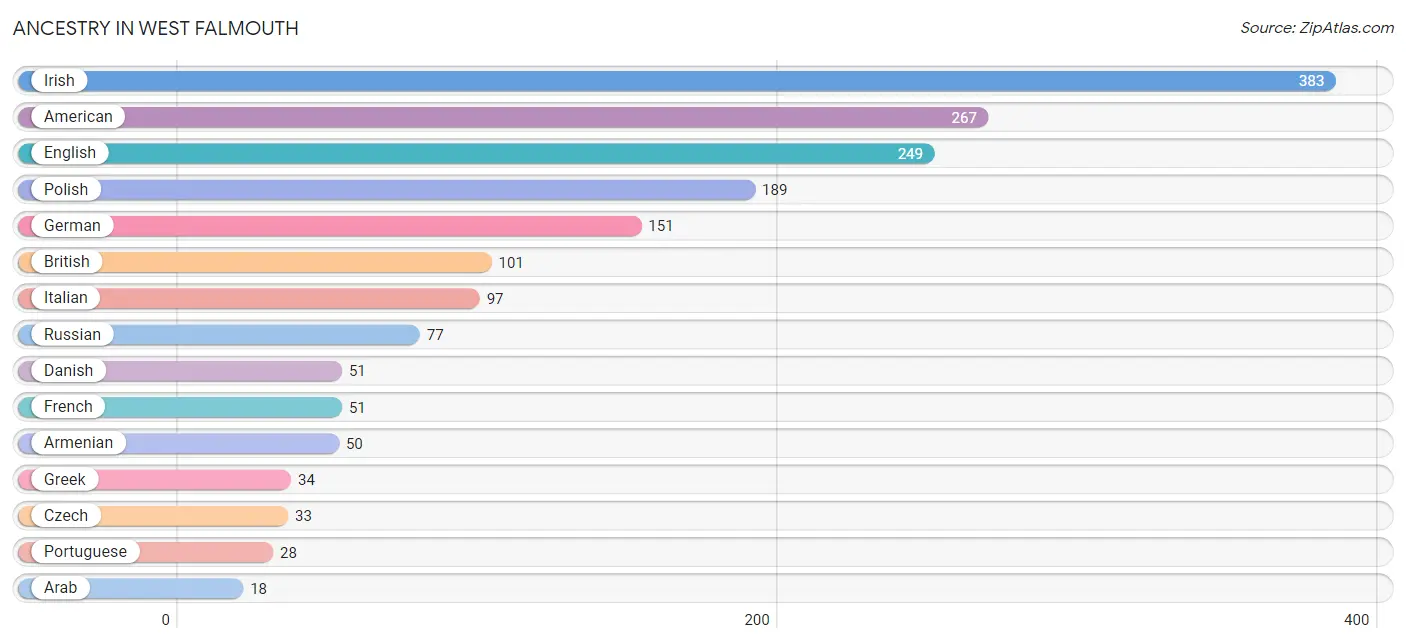
| Ancestry | # Population | % Population |
| American | 267 | 14.9% |
| Arab | 18 | 1.0% |
| Armenian | 50 | 2.8% |
| British | 101 | 5.6% |
| Czech | 33 | 1.8% |
| Danish | 51 | 2.8% |
| Eastern European | 17 | 0.9% |
| English | 249 | 13.9% |
| European | 7 | 0.4% |
| French | 51 | 2.8% |
| German | 151 | 8.4% |
| Greek | 34 | 1.9% |
| Irish | 383 | 21.4% |
| Italian | 97 | 5.4% |
| Laotian | 5 | 0.3% |
| Mexican | 8 | 0.4% |
| Polish | 189 | 10.5% |
| Portuguese | 28 | 1.6% |
| Russian | 77 | 4.3% |
| Scottish | 13 | 0.7% |
| Swedish | 3 | 0.2% | View All 21 Rows |
Immigrants in West Falmouth
The most numerous immigrant groups reported in West Falmouth came from Europe (109 | 6.1%), England (101 | 5.6%), Northern Europe (101 | 5.6%), Asia (35 | 1.9%), and Western Asia (35 | 1.9%), together accounting for 21.2% of all West Falmouth residents.
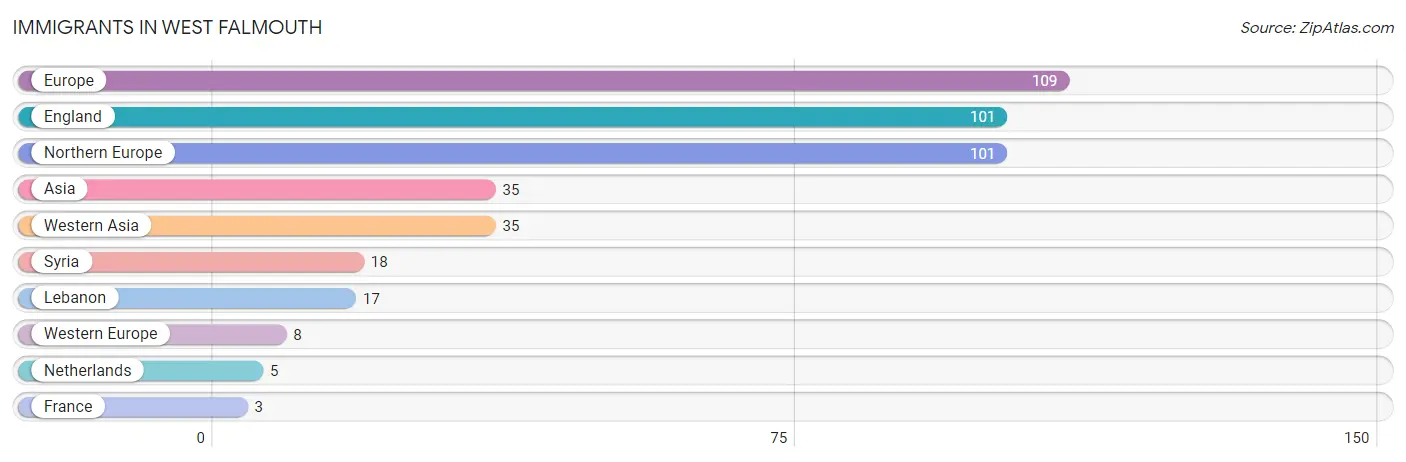
| Immigration Origin | # Population | % Population |
| Asia | 35 | 1.9% |
| England | 101 | 5.6% |
| Europe | 109 | 6.1% |
| France | 3 | 0.2% |
| Lebanon | 17 | 0.9% |
| Netherlands | 5 | 0.3% |
| Northern Europe | 101 | 5.6% |
| Syria | 18 | 1.0% |
| Western Asia | 35 | 1.9% |
| Western Europe | 8 | 0.4% | View All 10 Rows |
Sex and Age in West Falmouth
Sex and Age in West Falmouth
The most populous age groups in West Falmouth are 60 to 64 Years (148 | 18.3%) for men and 85 Years and over (238 | 24.2%) for women.
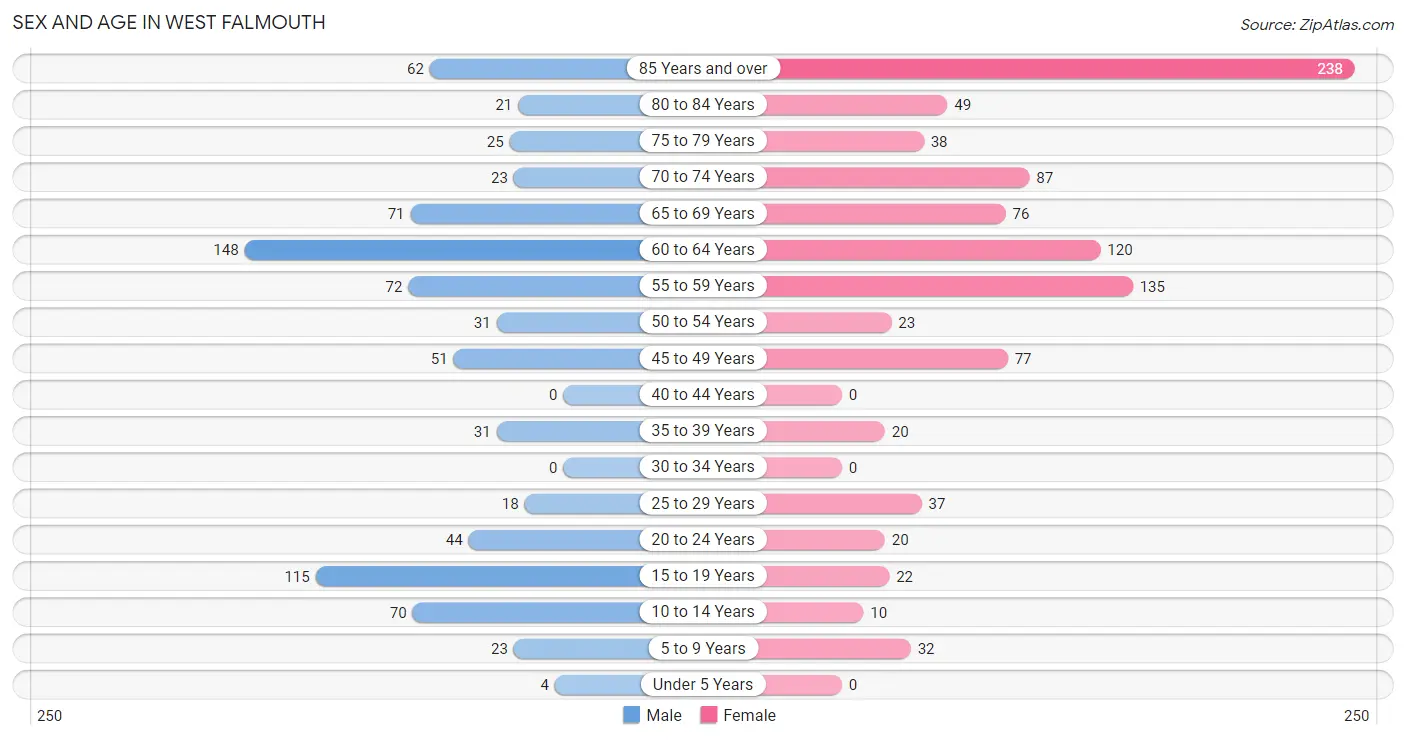
| Age Bracket | Male | Female |
| Under 5 Years | 4 (0.5%) | 0 (0.0%) |
| 5 to 9 Years | 23 (2.8%) | 32 (3.3%) |
| 10 to 14 Years | 70 (8.6%) | 10 (1.0%) |
| 15 to 19 Years | 115 (14.2%) | 22 (2.2%) |
| 20 to 24 Years | 44 (5.4%) | 20 (2.0%) |
| 25 to 29 Years | 18 (2.2%) | 37 (3.8%) |
| 30 to 34 Years | 0 (0.0%) | 0 (0.0%) |
| 35 to 39 Years | 31 (3.8%) | 20 (2.0%) |
| 40 to 44 Years | 0 (0.0%) | 0 (0.0%) |
| 45 to 49 Years | 51 (6.3%) | 77 (7.8%) |
| 50 to 54 Years | 31 (3.8%) | 23 (2.3%) |
| 55 to 59 Years | 72 (8.9%) | 135 (13.7%) |
| 60 to 64 Years | 148 (18.3%) | 120 (12.2%) |
| 65 to 69 Years | 71 (8.8%) | 76 (7.7%) |
| 70 to 74 Years | 23 (2.8%) | 87 (8.8%) |
| 75 to 79 Years | 25 (3.1%) | 38 (3.9%) |
| 80 to 84 Years | 21 (2.6%) | 49 (5.0%) |
| 85 Years and over | 62 (7.7%) | 238 (24.2%) |
| Total | 809 (100.0%) | 984 (100.0%) |
Families and Households in West Falmouth
Median Family Size in West Falmouth
The median family size in West Falmouth is 2.68 persons per family, with married-couple families (434 | 76.9%) accounting for the largest median family size of 2.73 persons per family. On the other hand, single female/mother families (95 | 16.8%) represent the smallest median family size with 2.44 persons per family.
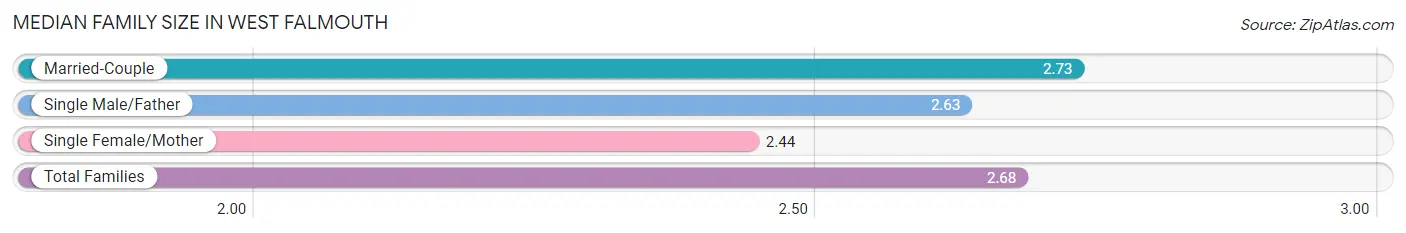
| Family Type | # Families | Family Size |
| Married-Couple | 434 (76.9%) | 2.73 |
| Single Male/Father | 35 (6.2%) | 2.63 |
| Single Female/Mother | 95 (16.8%) | 2.44 |
| Total Families | 564 (100.0%) | 2.68 |
Median Household Size in West Falmouth
The median household size in West Falmouth is 2.36 persons per household, with married-couple households (434 | 57.9%) accounting for the largest median household size of 2.73 persons per household. non-family households (186 | 24.8%) represent the smallest median household size with 1.41 persons per household.
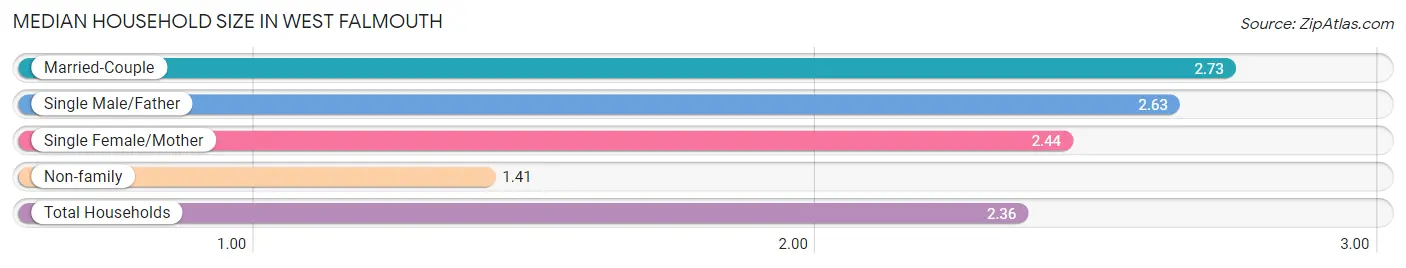
| Household Type | # Households | Household Size |
| Married-Couple | 434 (57.9%) | 2.73 |
| Single Male/Father | 35 (4.7%) | 2.63 |
| Single Female/Mother | 95 (12.7%) | 2.44 |
| Non-family | 186 (24.8%) | 1.41 |
| Total Households | 750 (100.0%) | 2.36 |
Household Size by Marriage Status in West Falmouth
Out of a total of 750 households in West Falmouth, 564 (75.2%) are family households, while 186 (24.8%) are nonfamily households. The most numerous type of family households are 2-person households, comprising 359, and the most common type of nonfamily households are 1-person households, comprising 134.
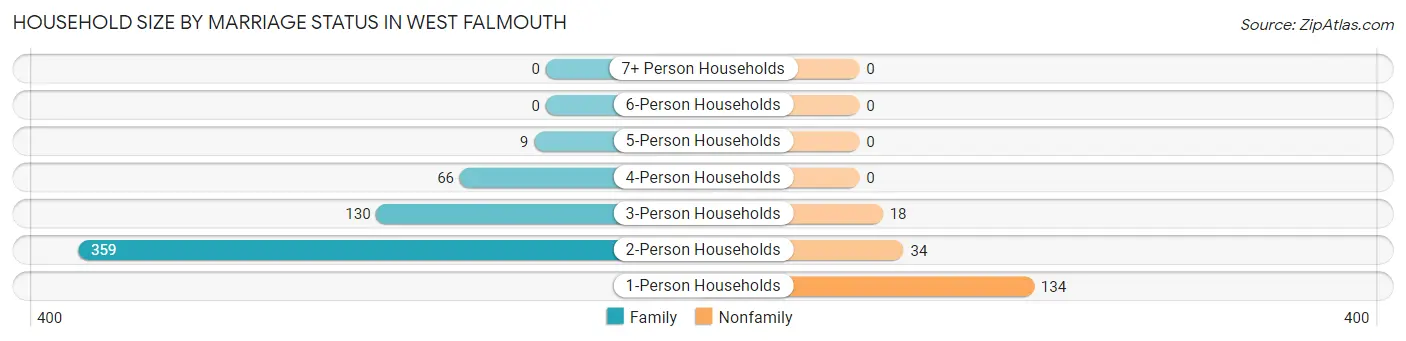
| Household Size | Family Households | Nonfamily Households |
| 1-Person Households | - | 134 (17.9%) |
| 2-Person Households | 359 (47.9%) | 34 (4.5%) |
| 3-Person Households | 130 (17.3%) | 18 (2.4%) |
| 4-Person Households | 66 (8.8%) | 0 (0.0%) |
| 5-Person Households | 9 (1.2%) | 0 (0.0%) |
| 6-Person Households | 0 (0.0%) | 0 (0.0%) |
| 7+ Person Households | 0 (0.0%) | 0 (0.0%) |
| Total | 564 (75.2%) | 186 (24.8%) |
Female Fertility in West Falmouth
Fertility by Age in West Falmouth
| Age Bracket | Women with Births | Births / 1,000 Women |
| 15 to 19 years | 0 (0.0%) | 0.0 |
| 20 to 34 years | 0 (0.0%) | 0.0 |
| 35 to 50 years | 0 (0.0%) | 0.0 |
| Total | 0 (0.0%) | 0.0 |
Fertility by Age by Marriage Status in West Falmouth
| Age Bracket | Married | Unmarried |
| 15 to 19 years | 0 (0.0%) | 0 (0.0%) |
| 20 to 34 years | 0 (0.0%) | 0 (0.0%) |
| 35 to 50 years | 0 (0.0%) | 0 (0.0%) |
| Total | 0 (0.0%) | 0 (0.0%) |
Fertility by Education in West Falmouth
| Educational Attainment | Women with Births | Births / 1,000 Women |
| Less than High School | 0 (0.0%) | 0.0 |
| High School Diploma | 0 (0.0%) | 0.0 |
| College or Associate's Degree | 0 (0.0%) | 0.0 |
| Bachelor's Degree | 0 (0.0%) | 0.0 |
| Graduate Degree | 0 (0.0%) | 0.0 |
| Total | 0 (0.0%) | 0.0 |
Fertility by Education by Marriage Status in West Falmouth
| Educational Attainment | Married | Unmarried |
| Less than High School | 0 (0.0%) | 0 (0.0%) |
| High School Diploma | 0 (0.0%) | 0 (0.0%) |
| College or Associate's Degree | 0 (0.0%) | 0 (0.0%) |
| Bachelor's Degree | 0 (0.0%) | 0 (0.0%) |
| Graduate Degree | 0 (0.0%) | 0 (0.0%) |
| Total | 0 (0.0%) | 0 (0.0%) |
Income in West Falmouth
Income Overview in West Falmouth
Per Capita Income in West Falmouth is $83,057, while median incomes of families and households are $182,262 and $167,083 respectively.
| Characteristic | Number | Measure |
| Per Capita Income | 1,793 | $83,057 |
| Median Family Income | 564 | $182,262 |
| Mean Family Income | 564 | $211,771 |
| Median Household Income | 750 | $167,083 |
| Mean Household Income | 750 | $189,998 |
| Income Deficit | 564 | $0 |
| Wage / Income Gap (%) | 1,793 | 0.00% |
| Wage / Income Gap ($) | 1,793 | 100.00¢ per $1 |
| Gini / Inequality Index | 1,793 | 0.44 |
Earnings by Sex in West Falmouth
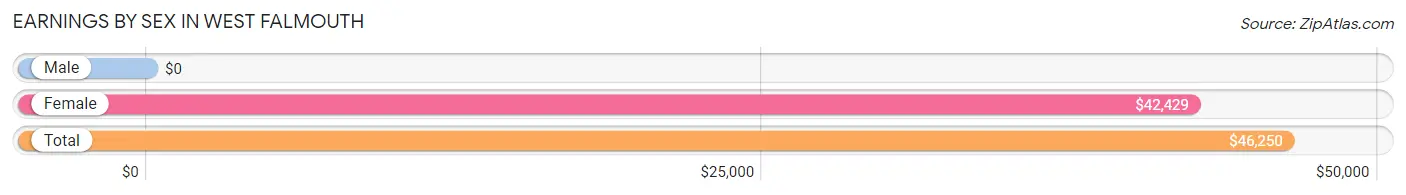
| Sex | Number | Average Earnings |
| Male | 505 (56.6%) | $0 |
| Female | 388 (43.4%) | $42,429 |
| Total | 893 (100.0%) | $46,250 |
Earnings by Sex by Income Bracket in West Falmouth
The most common earnings brackets in West Falmouth are $100,000+ for men (222 | 44.0%) and $40,000 to $44,999 for women (83 | 21.4%).
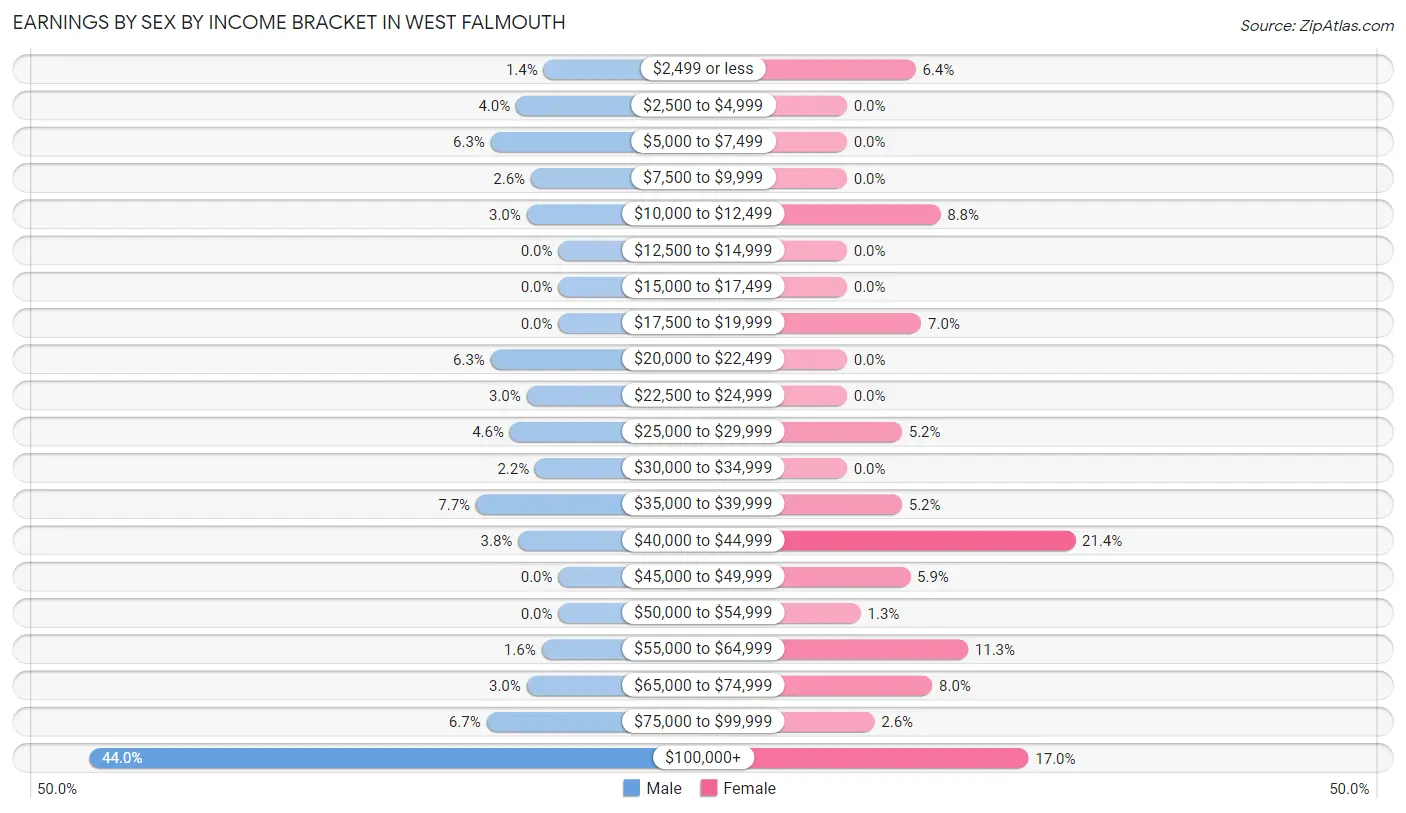
| Income | Male | Female |
| $2,499 or less | 7 (1.4%) | 25 (6.4%) |
| $2,500 to $4,999 | 20 (4.0%) | 0 (0.0%) |
| $5,000 to $7,499 | 32 (6.3%) | 0 (0.0%) |
| $7,500 to $9,999 | 13 (2.6%) | 0 (0.0%) |
| $10,000 to $12,499 | 15 (3.0%) | 34 (8.8%) |
| $12,500 to $14,999 | 0 (0.0%) | 0 (0.0%) |
| $15,000 to $17,499 | 0 (0.0%) | 0 (0.0%) |
| $17,500 to $19,999 | 0 (0.0%) | 27 (7.0%) |
| $20,000 to $22,499 | 32 (6.3%) | 0 (0.0%) |
| $22,500 to $24,999 | 15 (3.0%) | 0 (0.0%) |
| $25,000 to $29,999 | 23 (4.5%) | 20 (5.1%) |
| $30,000 to $34,999 | 11 (2.2%) | 0 (0.0%) |
| $35,000 to $39,999 | 39 (7.7%) | 20 (5.1%) |
| $40,000 to $44,999 | 19 (3.8%) | 83 (21.4%) |
| $45,000 to $49,999 | 0 (0.0%) | 23 (5.9%) |
| $50,000 to $54,999 | 0 (0.0%) | 5 (1.3%) |
| $55,000 to $64,999 | 8 (1.6%) | 44 (11.3%) |
| $65,000 to $74,999 | 15 (3.0%) | 31 (8.0%) |
| $75,000 to $99,999 | 34 (6.7%) | 10 (2.6%) |
| $100,000+ | 222 (44.0%) | 66 (17.0%) |
| Total | 505 (100.0%) | 388 (100.0%) |
Earnings by Sex by Educational Attainment in West Falmouth
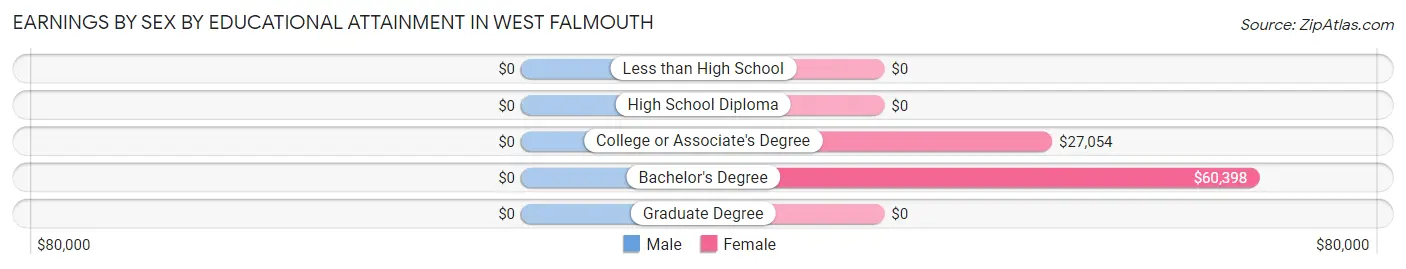
| Educational Attainment | Male Income | Female Income |
| Less than High School | - | - |
| High School Diploma | - | - |
| College or Associate's Degree | - | - |
| Bachelor's Degree | - | - |
| Graduate Degree | - | - |
| Total | $134,000 | $45,109 |
Family Income in West Falmouth
Family Income Brackets in West Falmouth
According to the West Falmouth family income data, there are 216 families falling into the $200,000+ income range, which is the most common income bracket and makes up 38.3% of all families.
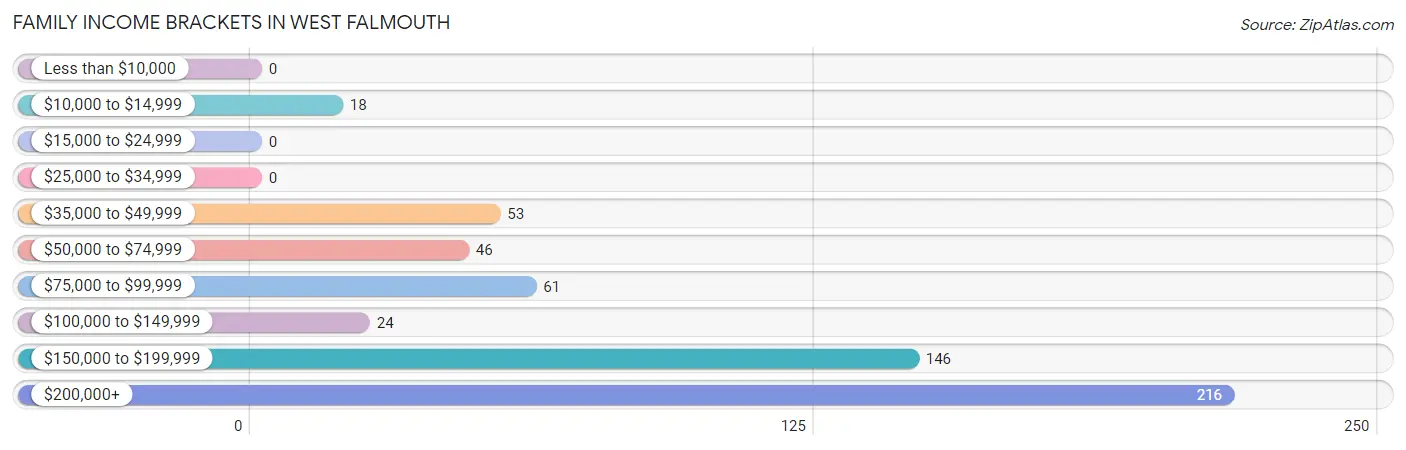
| Income Bracket | # Families | % Families |
| Less than $10,000 | 0 | 0.0% |
| $10,000 to $14,999 | 18 | 3.2% |
| $15,000 to $24,999 | 0 | 0.0% |
| $25,000 to $34,999 | 0 | 0.0% |
| $35,000 to $49,999 | 53 | 9.4% |
| $50,000 to $74,999 | 46 | 8.2% |
| $75,000 to $99,999 | 61 | 10.8% |
| $100,000 to $149,999 | 24 | 4.3% |
| $150,000 to $199,999 | 146 | 25.9% |
| $200,000+ | 216 | 38.3% |
Family Income by Famaliy Size in West Falmouth
3-person families (130 | 23.1%) account for the highest median family income in West Falmouth with $242,500 per family, while 2-person families (359 | 63.6%) have the highest median income of $90,529 per family member.
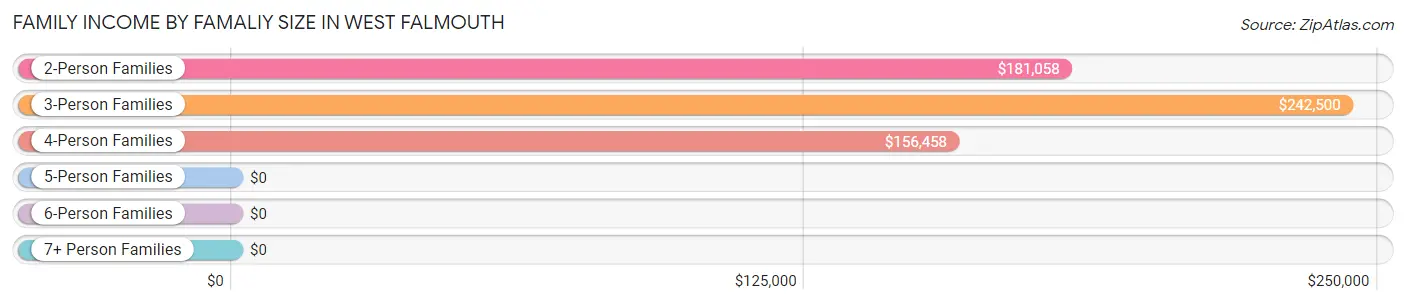
| Income Bracket | # Families | Median Income |
| 2-Person Families | 359 (63.6%) | $181,058 |
| 3-Person Families | 130 (23.1%) | $242,500 |
| 4-Person Families | 66 (11.7%) | $156,458 |
| 5-Person Families | 9 (1.6%) | $0 |
| 6-Person Families | 0 (0.0%) | $0 |
| 7+ Person Families | 0 (0.0%) | $0 |
| Total | 564 (100.0%) | $182,262 |
Family Income by Number of Earners in West Falmouth
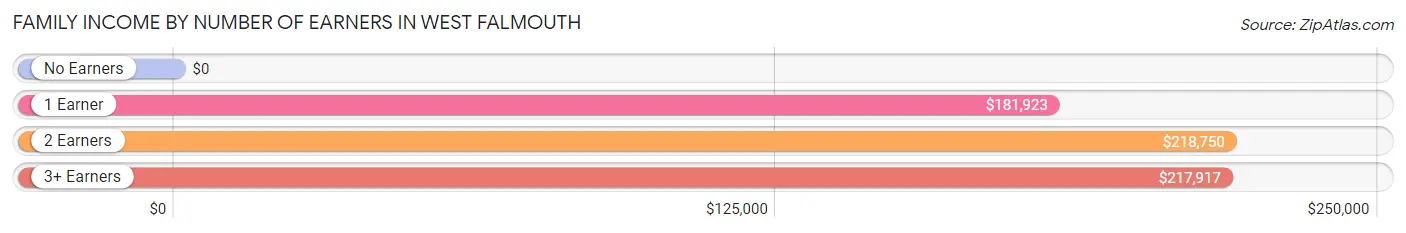
| Number of Earners | # Families | Median Income |
| No Earners | 167 (29.6%) | $0 |
| 1 Earner | 124 (22.0%) | $181,923 |
| 2 Earners | 224 (39.7%) | $218,750 |
| 3+ Earners | 49 (8.7%) | $217,917 |
| Total | 564 (100.0%) | $182,262 |
Household Income in West Falmouth
Household Income Brackets in West Falmouth
With 268 households falling in the category, the $200,000+ income range is the most frequent in West Falmouth, accounting for 35.7% of all households.
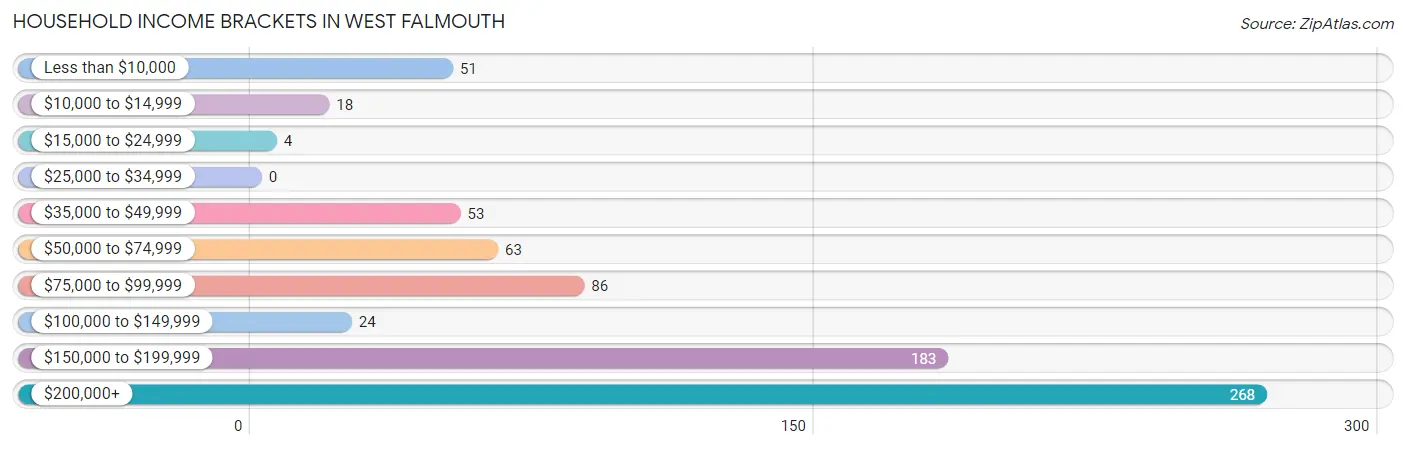
| Income Bracket | # Households | % Households |
| Less than $10,000 | 51 | 6.8% |
| $10,000 to $14,999 | 18 | 2.4% |
| $15,000 to $24,999 | 4 | 0.5% |
| $25,000 to $34,999 | 0 | 0.0% |
| $35,000 to $49,999 | 53 | 7.1% |
| $50,000 to $74,999 | 63 | 8.4% |
| $75,000 to $99,999 | 86 | 11.5% |
| $100,000 to $149,999 | 24 | 3.2% |
| $150,000 to $199,999 | 183 | 24.4% |
| $200,000+ | 268 | 35.7% |
Household Income by Householder Age in West Falmouth
The median household income in West Falmouth is $167,083, with the highest median household income of $194,423 found in the 45 to 64 years age bracket for the primary householder. A total of 382 households (50.9%) fall into this category.
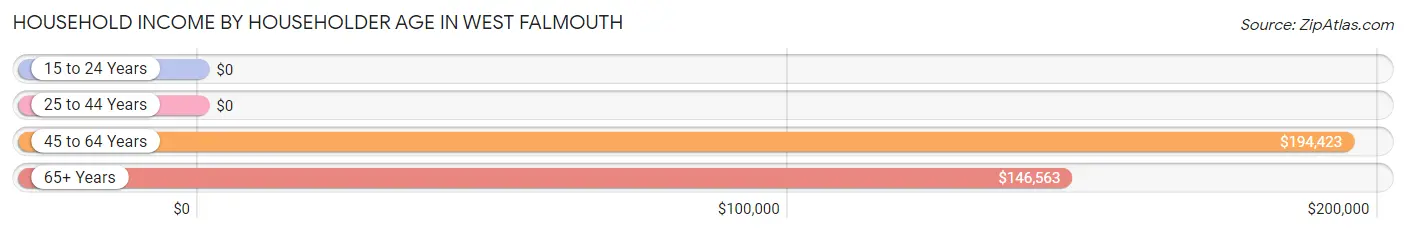
| Income Bracket | # Households | Median Income |
| 15 to 24 Years | 0 (0.0%) | $0 |
| 25 to 44 Years | 3 (0.4%) | $0 |
| 45 to 64 Years | 382 (50.9%) | $194,423 |
| 65+ Years | 365 (48.7%) | $146,563 |
| Total | 750 (100.0%) | $167,083 |
Poverty in West Falmouth
Income Below Poverty by Sex and Age in West Falmouth
With 1.8% poverty level for males and 12.3% for females among the residents of West Falmouth, 35 to 44 year old males and 75 year old and over females are the most vulnerable to poverty, with 8 males (25.8%) and 70 females (21.5%) in their respective age groups living below the poverty level.
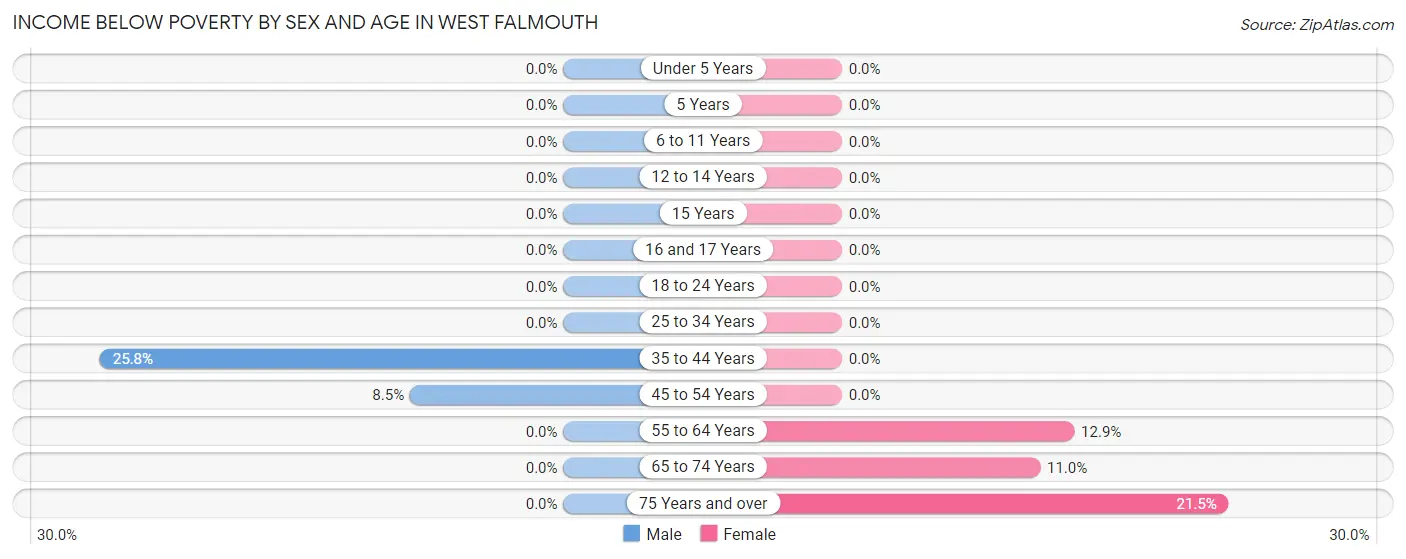
| Age Bracket | Male | Female |
| Under 5 Years | 0 (0.0%) | 0 (0.0%) |
| 5 Years | 0 (0.0%) | 0 (0.0%) |
| 6 to 11 Years | 0 (0.0%) | 0 (0.0%) |
| 12 to 14 Years | 0 (0.0%) | 0 (0.0%) |
| 15 Years | 0 (0.0%) | 0 (0.0%) |
| 16 and 17 Years | 0 (0.0%) | 0 (0.0%) |
| 18 to 24 Years | 0 (0.0%) | 0 (0.0%) |
| 25 to 34 Years | 0 (0.0%) | 0 (0.0%) |
| 35 to 44 Years | 8 (25.8%) | 0 (0.0%) |
| 45 to 54 Years | 7 (8.5%) | 0 (0.0%) |
| 55 to 64 Years | 0 (0.0%) | 33 (12.9%) |
| 65 to 74 Years | 0 (0.0%) | 18 (11.0%) |
| 75 Years and over | 0 (0.0%) | 70 (21.5%) |
| Total | 15 (1.8%) | 121 (12.3%) |
Income Above Poverty by Sex and Age in West Falmouth
According to the poverty statistics in West Falmouth, males aged under 5 years and females aged 6 to 11 years are the age groups that are most secure financially, with 100.0% of males and 100.0% of females in these age groups living above the poverty line.
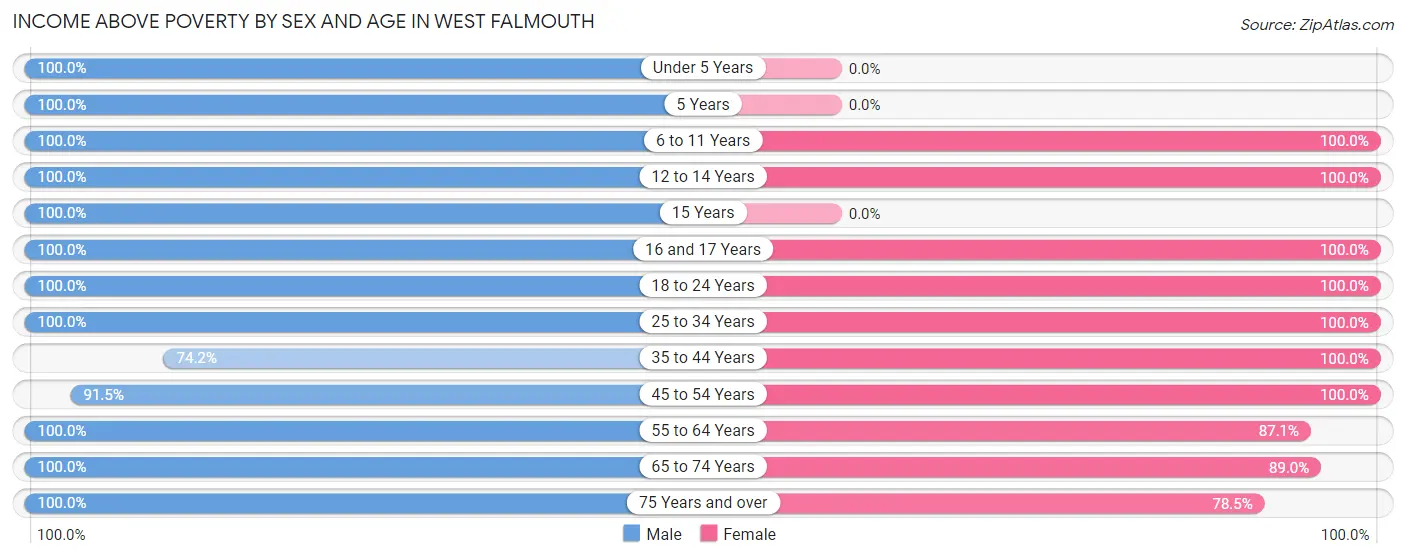
| Age Bracket | Male | Female |
| Under 5 Years | 4 (100.0%) | 0 (0.0%) |
| 5 Years | 14 (100.0%) | 0 (0.0%) |
| 6 to 11 Years | 66 (100.0%) | 32 (100.0%) |
| 12 to 14 Years | 13 (100.0%) | 10 (100.0%) |
| 15 Years | 48 (100.0%) | 0 (0.0%) |
| 16 and 17 Years | 32 (100.0%) | 22 (100.0%) |
| 18 to 24 Years | 79 (100.0%) | 20 (100.0%) |
| 25 to 34 Years | 18 (100.0%) | 37 (100.0%) |
| 35 to 44 Years | 23 (74.2%) | 20 (100.0%) |
| 45 to 54 Years | 75 (91.5%) | 100 (100.0%) |
| 55 to 64 Years | 220 (100.0%) | 222 (87.1%) |
| 65 to 74 Years | 94 (100.0%) | 145 (89.0%) |
| 75 Years and over | 108 (100.0%) | 255 (78.5%) |
| Total | 794 (98.2%) | 863 (87.7%) |
Income Below Poverty Among Married-Couple Families in West Falmouth
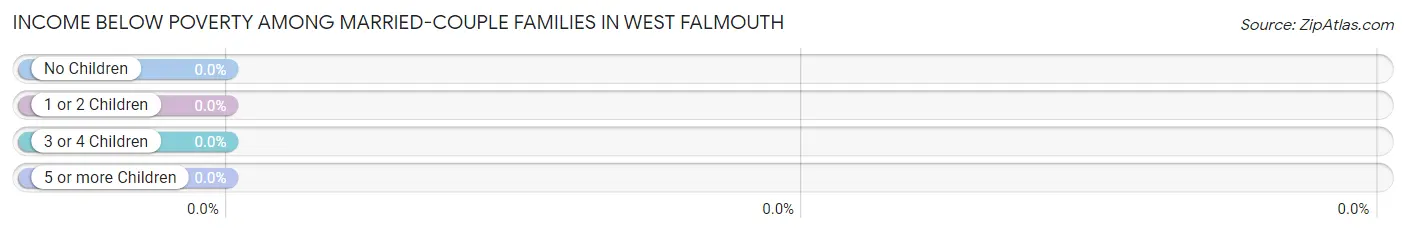
| Children | Above Poverty | Below Poverty |
| No Children | 322 (100.0%) | 0 (0.0%) |
| 1 or 2 Children | 112 (100.0%) | 0 (0.0%) |
| 3 or 4 Children | 0 (0.0%) | 0 (0.0%) |
| 5 or more Children | 0 (0.0%) | 0 (0.0%) |
| Total | 434 (100.0%) | 0 (0.0%) |
Income Below Poverty Among Single-Parent Households in West Falmouth
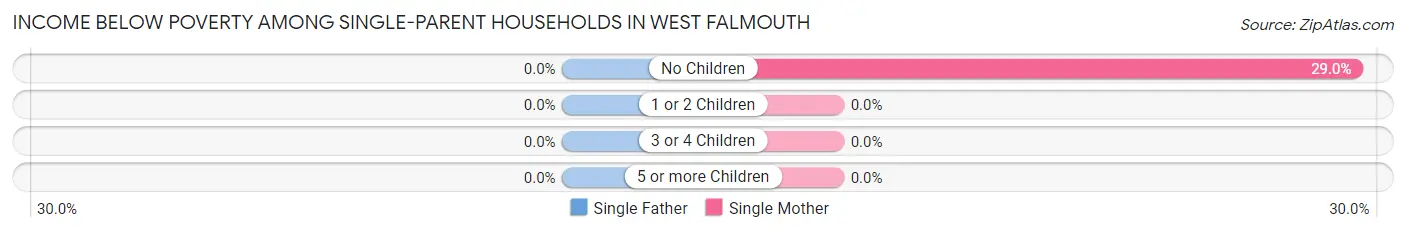
| Children | Single Father | Single Mother |
| No Children | 0 (0.0%) | 18 (29.0%) |
| 1 or 2 Children | 0 (0.0%) | 0 (0.0%) |
| 3 or 4 Children | 0 (0.0%) | 0 (0.0%) |
| 5 or more Children | 0 (0.0%) | 0 (0.0%) |
| Total | 0 (0.0%) | 18 (19.0%) |
Income Below Poverty Among Married-Couple vs Single-Parent Households in West Falmouth
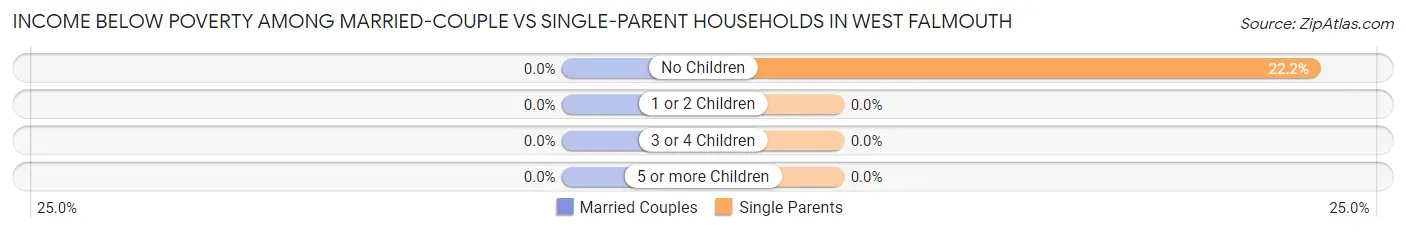
| Children | Married-Couple Families | Single-Parent Households |
| No Children | 0 (0.0%) | 18 (22.2%) |
| 1 or 2 Children | 0 (0.0%) | 0 (0.0%) |
| 3 or 4 Children | 0 (0.0%) | 0 (0.0%) |
| 5 or more Children | 0 (0.0%) | 0 (0.0%) |
| Total | 0 (0.0%) | 18 (13.9%) |
Employment Characteristics in West Falmouth
Employment by Class of Employer in West Falmouth
Among the 799 employed individuals in West Falmouth, private company employees (398 | 49.8%), not-for-profit organizations (212 | 26.5%), and self-employed (not incorporated) (61 | 7.6%) make up the most common classes of employment.
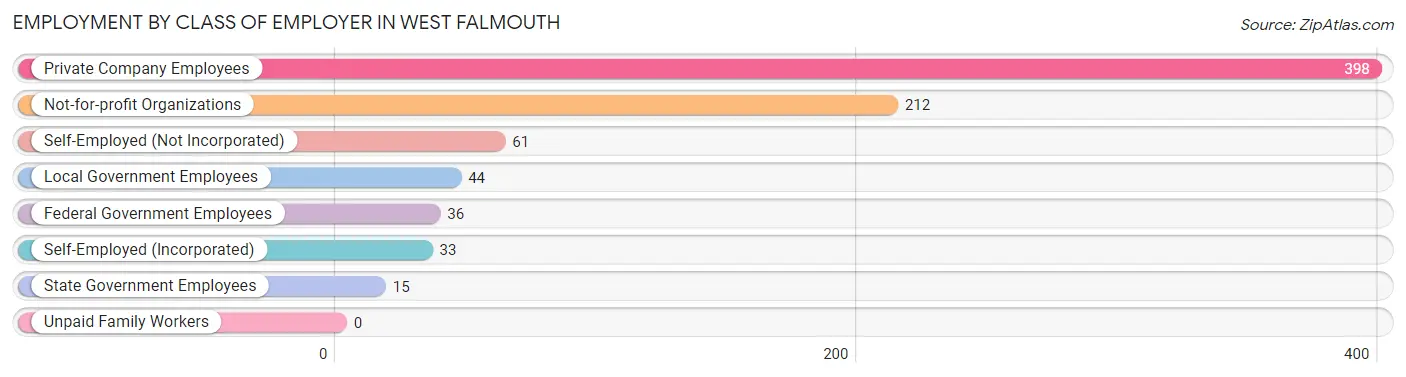
| Employer Class | # Employees | % Employees |
| Private Company Employees | 398 | 49.8% |
| Self-Employed (Incorporated) | 33 | 4.1% |
| Self-Employed (Not Incorporated) | 61 | 7.6% |
| Not-for-profit Organizations | 212 | 26.5% |
| Local Government Employees | 44 | 5.5% |
| State Government Employees | 15 | 1.9% |
| Federal Government Employees | 36 | 4.5% |
| Unpaid Family Workers | 0 | 0.0% |
| Total | 799 | 100.0% |
Employment Status by Age in West Falmouth
According to the labor force statistics for West Falmouth, out of the total population over 16 years of age (1,606), 54.5% or 875 individuals are in the labor force, with 8.7% or 76 of them unemployed. The age group with the highest labor force participation rate is 20 to 24 years, with 100.0% or 64 individuals in the labor force. Within the labor force, the 75 years and over age range has the highest percentage of unemployed individuals, with 100.0% or 17 of them being unemployed.
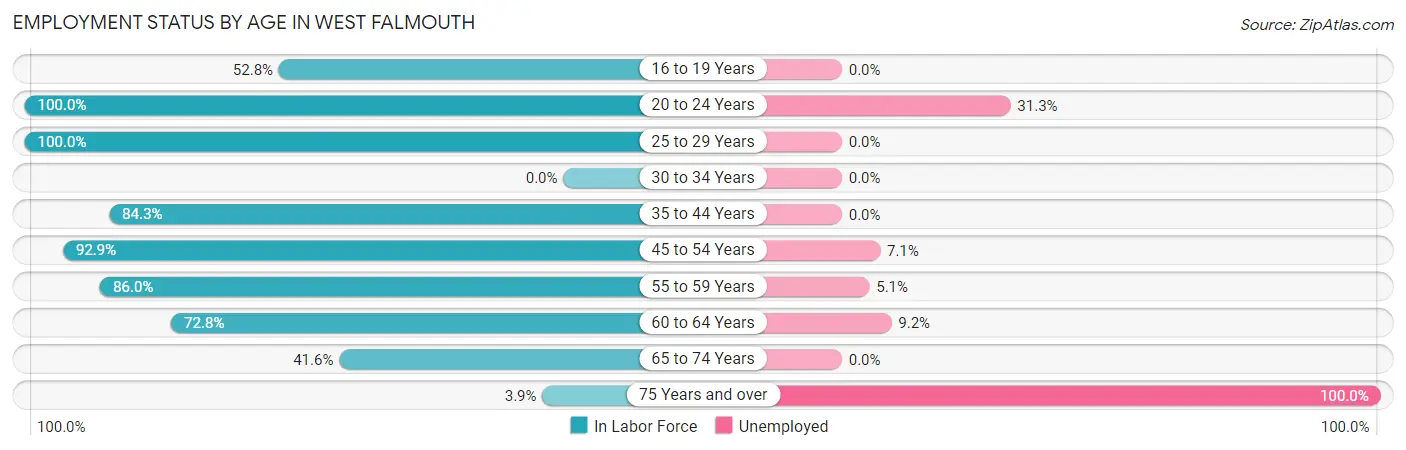
| Age Bracket | In Labor Force | Unemployed |
| 16 to 19 Years | 47 (52.8%) | 0 (0.0%) |
| 20 to 24 Years | 64 (100.0%) | 20 (31.3%) |
| 25 to 29 Years | 55 (100.0%) | 0 (0.0%) |
| 30 to 34 Years | 0 (0.0%) | 0 (0.0%) |
| 35 to 44 Years | 43 (84.3%) | 0 (0.0%) |
| 45 to 54 Years | 169 (92.9%) | 12 (7.1%) |
| 55 to 59 Years | 178 (86.0%) | 9 (5.1%) |
| 60 to 64 Years | 195 (72.8%) | 18 (9.2%) |
| 65 to 74 Years | 107 (41.6%) | 0 (0.0%) |
| 75 Years and over | 17 (3.9%) | 17 (100.0%) |
| Total | 875 (54.5%) | 76 (8.7%) |
Employment Status by Educational Attainment in West Falmouth
According to labor force statistics for West Falmouth, 83.9% of individuals (640) out of the total population between 25 and 64 years of age (763) are in the labor force, with 6.1% or 39 of them being unemployed. The group with the highest labor force participation rate are those with the educational attainment of college / associate degree, with 86.4% or 127 individuals in the labor force. Within the labor force, individuals with college / associate degree education have the highest percentage of unemployment, with 14.2% or 18 of them being unemployed.
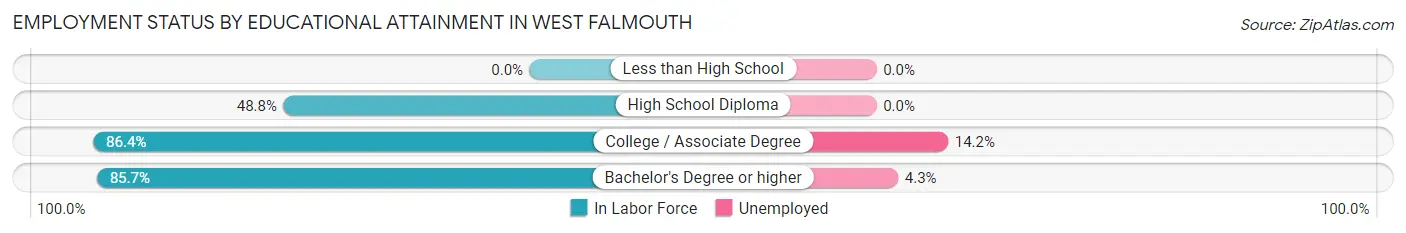
| Educational Attainment | In Labor Force | Unemployed |
| Less than High School | 0 (0.0%) | 0 (0.0%) |
| High School Diploma | 20 (48.8%) | 0 (0.0%) |
| College / Associate Degree | 127 (86.4%) | 21 (14.2%) |
| Bachelor's Degree or higher | 493 (85.7%) | 25 (4.3%) |
| Total | 640 (83.9%) | 47 (6.1%) |
Employment Occupations by Sex in West Falmouth
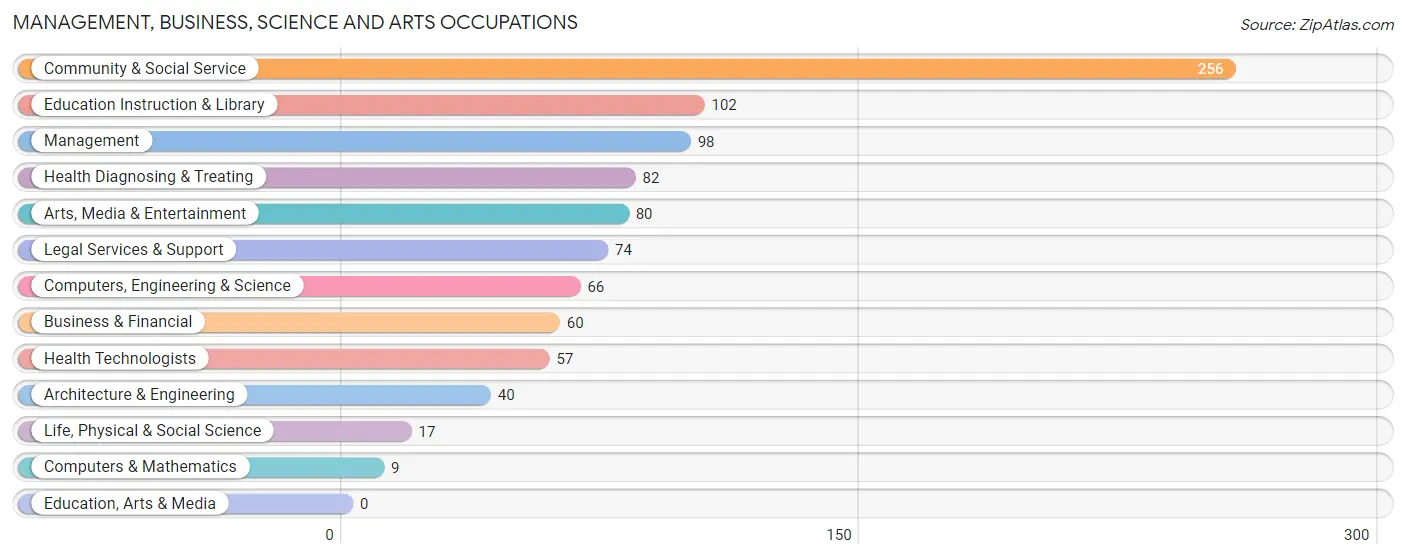
Management, Business, Science and Arts Occupations
The most common Management, Business, Science and Arts occupations in West Falmouth are Community & Social Service (256 | 32.0%), Education Instruction & Library (102 | 12.8%), Management (98 | 12.3%), Health Diagnosing & Treating (82 | 10.3%), and Arts, Media & Entertainment (80 | 10.0%).
Management, Business, Science and Arts Occupations by Sex
Within the Management, Business, Science and Arts occupations in West Falmouth, the most male-oriented occupations are Architecture & Engineering (100.0%), Life, Physical & Social Science (100.0%), and Management (94.9%), while the most female-oriented occupations are Business & Financial (100.0%), Computers & Mathematics (100.0%), and Education Instruction & Library (67.6%).

| Occupation | Male | Female |
| Management | 93 (94.9%) | 5 (5.1%) |
| Business & Financial | 0 (0.0%) | 60 (100.0%) |
| Computers, Engineering & Science | 57 (86.4%) | 9 (13.6%) |
| Computers & Mathematics | 0 (0.0%) | 9 (100.0%) |
| Architecture & Engineering | 40 (100.0%) | 0 (0.0%) |
| Life, Physical & Social Science | 17 (100.0%) | 0 (0.0%) |
| Community & Social Service | 122 (47.7%) | 134 (52.3%) |
| Education, Arts & Media | 0 (0.0%) | 0 (0.0%) |
| Legal Services & Support | 55 (74.3%) | 19 (25.7%) |
| Education Instruction & Library | 33 (32.4%) | 69 (67.6%) |
| Arts, Media & Entertainment | 34 (42.5%) | 46 (57.5%) |
| Health Diagnosing & Treating | 33 (40.2%) | 49 (59.8%) |
| Health Technologists | 33 (57.9%) | 24 (42.1%) |
| Total (Category) | 305 (54.3%) | 257 (45.7%) |
| Total (Overall) | 456 (57.1%) | 343 (42.9%) |
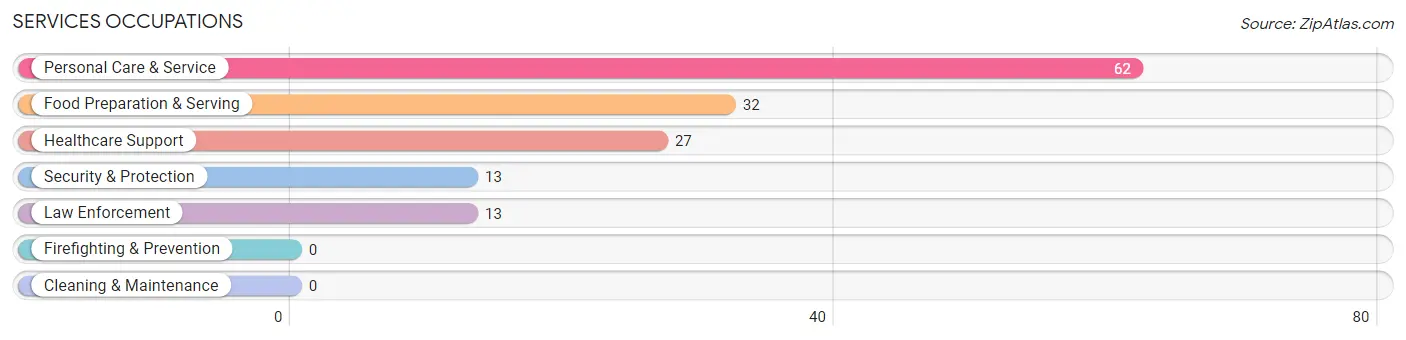
Services Occupations
The most common Services occupations in West Falmouth are Personal Care & Service (62 | 7.8%), Food Preparation & Serving (32 | 4.0%), Healthcare Support (27 | 3.4%), Security & Protection (13 | 1.6%), and Law Enforcement (13 | 1.6%).
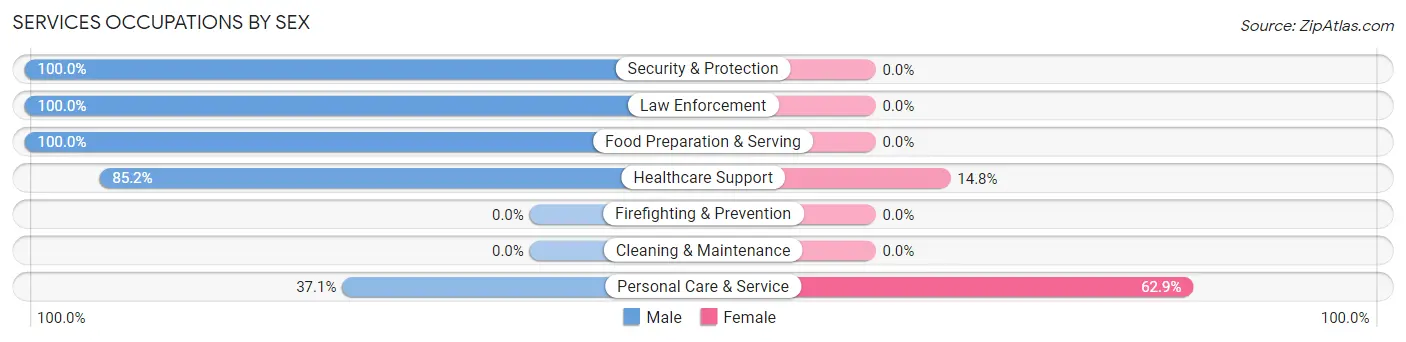
Services Occupations by Sex
Within the Services occupations in West Falmouth, the most male-oriented occupations are Security & Protection (100.0%), Law Enforcement (100.0%), and Food Preparation & Serving (100.0%), while the most female-oriented occupations are Personal Care & Service (62.9%), and Healthcare Support (14.8%).
| Occupation | Male | Female |
| Healthcare Support | 23 (85.2%) | 4 (14.8%) |
| Security & Protection | 13 (100.0%) | 0 (0.0%) |
| Firefighting & Prevention | 0 (0.0%) | 0 (0.0%) |
| Law Enforcement | 13 (100.0%) | 0 (0.0%) |
| Food Preparation & Serving | 32 (100.0%) | 0 (0.0%) |
| Cleaning & Maintenance | 0 (0.0%) | 0 (0.0%) |
| Personal Care & Service | 23 (37.1%) | 39 (62.9%) |
| Total (Category) | 91 (67.9%) | 43 (32.1%) |
| Total (Overall) | 456 (57.1%) | 343 (42.9%) |
Sales and Office Occupations
The most common Sales and Office occupations in West Falmouth are Sales & Related (40 | 5.0%), and Office & Administration (26 | 3.3%).

Sales and Office Occupations by Sex

| Occupation | Male | Female |
| Sales & Related | 23 (57.5%) | 17 (42.5%) |
| Office & Administration | 0 (0.0%) | 26 (100.0%) |
| Total (Category) | 23 (34.8%) | 43 (65.1%) |
| Total (Overall) | 456 (57.1%) | 343 (42.9%) |
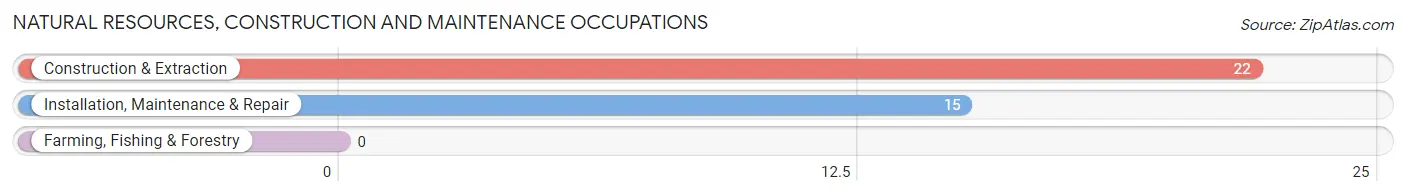
Natural Resources, Construction and Maintenance Occupations
The most common Natural Resources, Construction and Maintenance occupations in West Falmouth are Construction & Extraction (22 | 2.8%), and Installation, Maintenance & Repair (15 | 1.9%).
Natural Resources, Construction and Maintenance Occupations by Sex
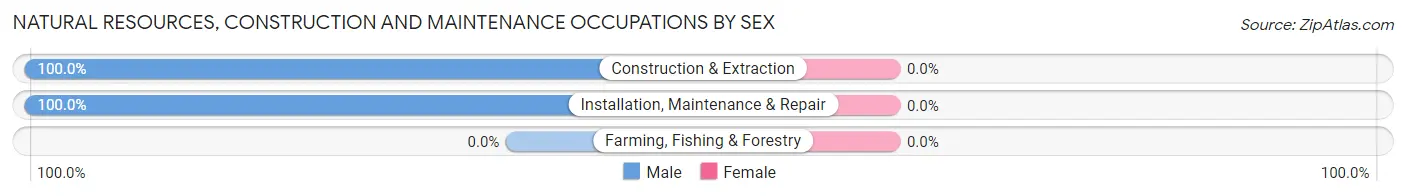
| Occupation | Male | Female |
| Farming, Fishing & Forestry | 0 (0.0%) | 0 (0.0%) |
| Construction & Extraction | 22 (100.0%) | 0 (0.0%) |
| Installation, Maintenance & Repair | 15 (100.0%) | 0 (0.0%) |
| Total (Category) | 37 (100.0%) | 0 (0.0%) |
| Total (Overall) | 456 (57.1%) | 343 (42.9%) |
Production, Transportation and Moving Occupations
Production, Transportation and Moving Occupations by Sex
| Occupation | Male | Female |
| Production | 0 (0.0%) | 0 (0.0%) |
| Transportation | 0 (0.0%) | 0 (0.0%) |
| Material Moving | 0 (0.0%) | 0 (0.0%) |
| Total (Category) | 0 (0.0%) | 0 (0.0%) |
| Total (Overall) | 456 (57.1%) | 343 (42.9%) |
Employment Industries by Sex in West Falmouth
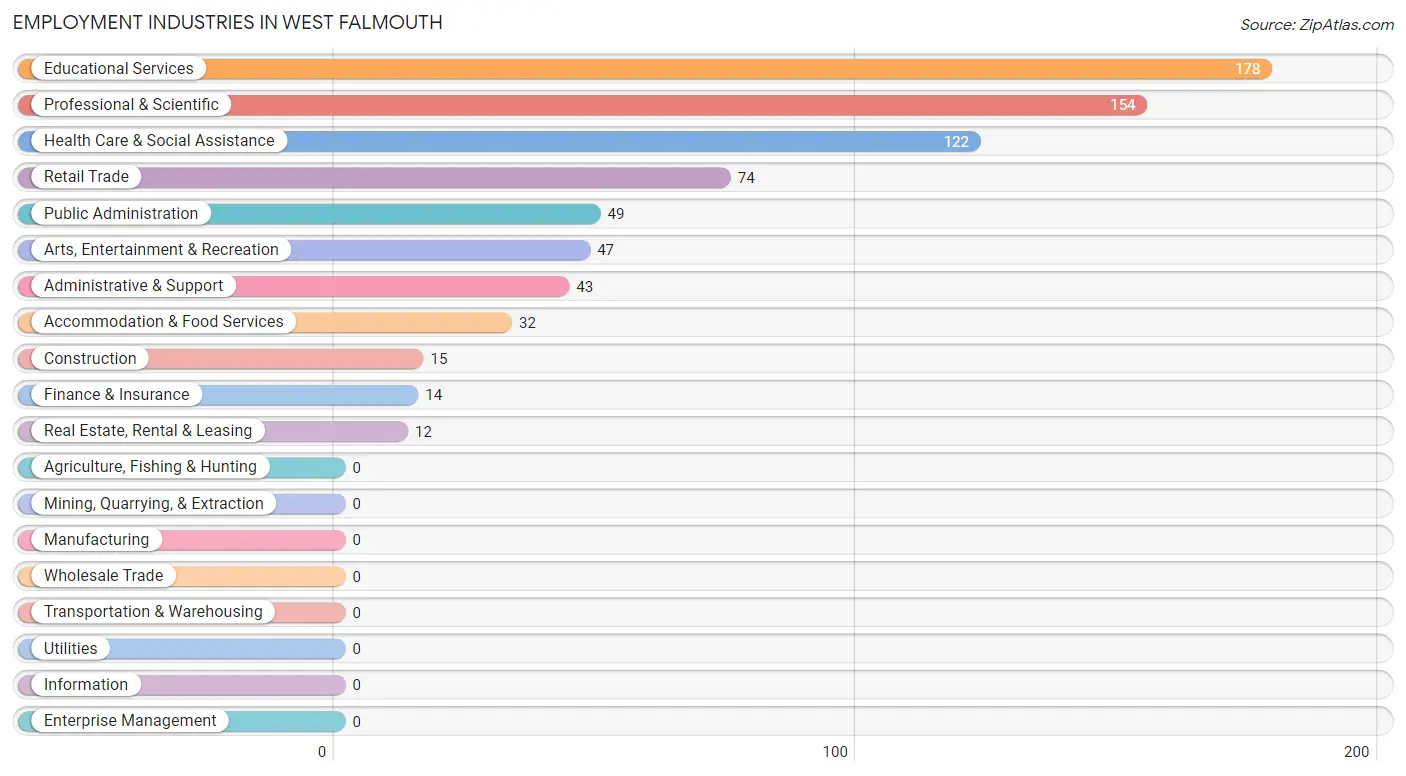
Employment Industries in West Falmouth
The major employment industries in West Falmouth include Educational Services (178 | 22.3%), Professional & Scientific (154 | 19.3%), Health Care & Social Assistance (122 | 15.3%), Retail Trade (74 | 9.3%), and Public Administration (49 | 6.1%).
Employment Industries by Sex in West Falmouth
The West Falmouth industries that see more men than women are Construction (100.0%), Administrative & Support (100.0%), and Accommodation & Food Services (100.0%), whereas the industries that tend to have a higher number of women are Finance & Insurance (100.0%), Educational Services (70.8%), and Retail Trade (68.9%).
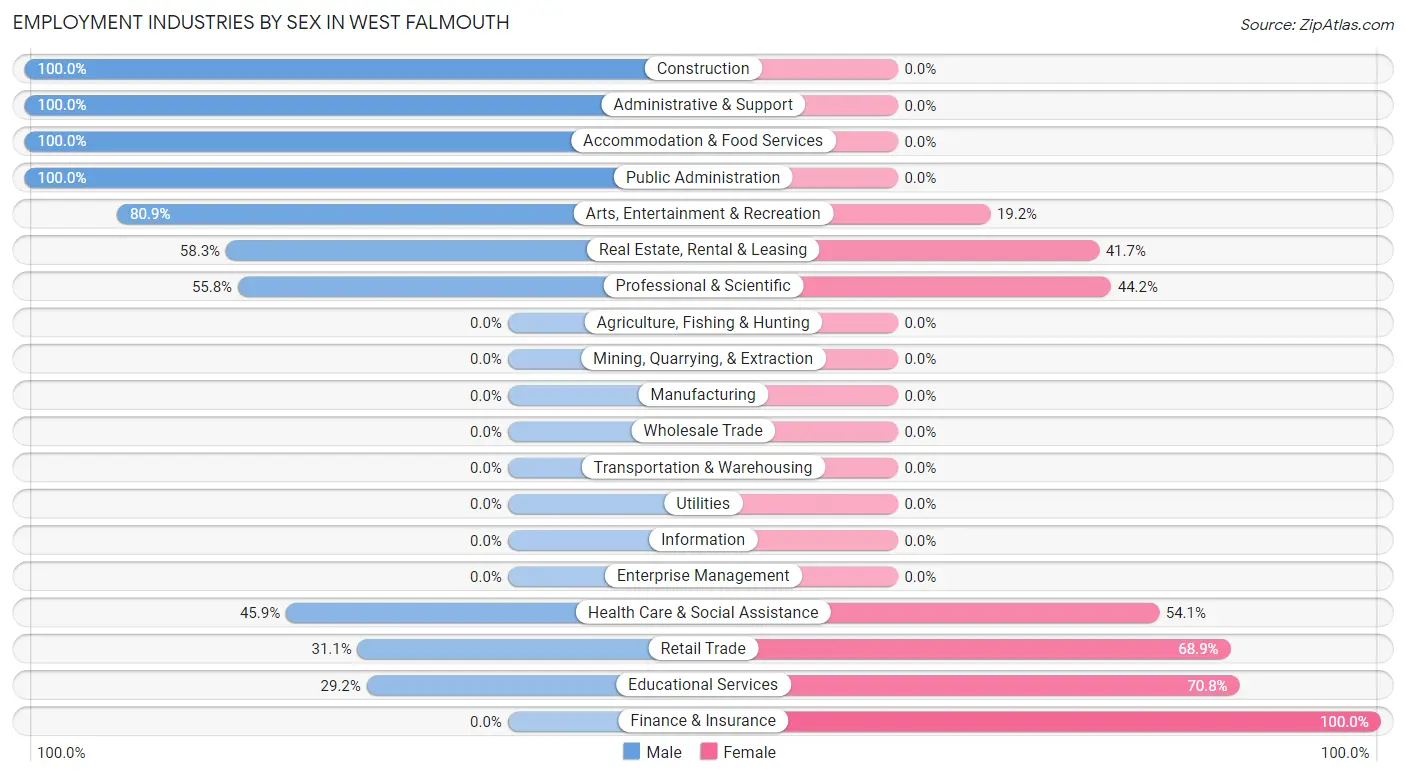
| Industry | Male | Female |
| Agriculture, Fishing & Hunting | 0 (0.0%) | 0 (0.0%) |
| Mining, Quarrying, & Extraction | 0 (0.0%) | 0 (0.0%) |
| Construction | 15 (100.0%) | 0 (0.0%) |
| Manufacturing | 0 (0.0%) | 0 (0.0%) |
| Wholesale Trade | 0 (0.0%) | 0 (0.0%) |
| Retail Trade | 23 (31.1%) | 51 (68.9%) |
| Transportation & Warehousing | 0 (0.0%) | 0 (0.0%) |
| Utilities | 0 (0.0%) | 0 (0.0%) |
| Information | 0 (0.0%) | 0 (0.0%) |
| Finance & Insurance | 0 (0.0%) | 14 (100.0%) |
| Real Estate, Rental & Leasing | 7 (58.3%) | 5 (41.7%) |
| Professional & Scientific | 86 (55.8%) | 68 (44.2%) |
| Enterprise Management | 0 (0.0%) | 0 (0.0%) |
| Administrative & Support | 43 (100.0%) | 0 (0.0%) |
| Educational Services | 52 (29.2%) | 126 (70.8%) |
| Health Care & Social Assistance | 56 (45.9%) | 66 (54.1%) |
| Arts, Entertainment & Recreation | 38 (80.8%) | 9 (19.2%) |
| Accommodation & Food Services | 32 (100.0%) | 0 (0.0%) |
| Public Administration | 49 (100.0%) | 0 (0.0%) |
| Total | 456 (57.1%) | 343 (42.9%) |
Education in West Falmouth
School Enrollment in West Falmouth
The most common levels of schooling among the 308 students in West Falmouth are high school (137 | 44.5%), middle school (71 | 23.1%), and elementary school (34 | 11.0%).
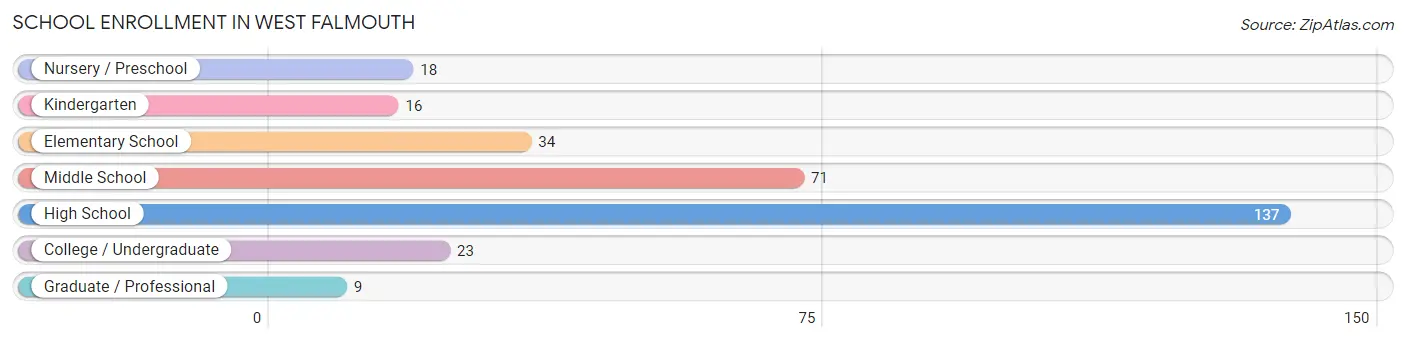
| School Level | # Students | % Students |
| Nursery / Preschool | 18 | 5.8% |
| Kindergarten | 16 | 5.2% |
| Elementary School | 34 | 11.0% |
| Middle School | 71 | 23.1% |
| High School | 137 | 44.5% |
| College / Undergraduate | 23 | 7.5% |
| Graduate / Professional | 9 | 2.9% |
| Total | 308 | 100.0% |
School Enrollment by Age by Funding Source in West Falmouth
Out of a total of 308 students who are enrolled in schools in West Falmouth, 47 (15.3%) attend a private institution, while the remaining 261 (84.7%) are enrolled in public schools. The age group of 3 to 4 year olds has the highest likelihood of being enrolled in private schools, with 4 (100.0% in the age bracket) enrolled. Conversely, the age group of 5 to 9 year old has the lowest likelihood of being enrolled in a private school, with 55 (100.0% in the age bracket) attending a public institution.
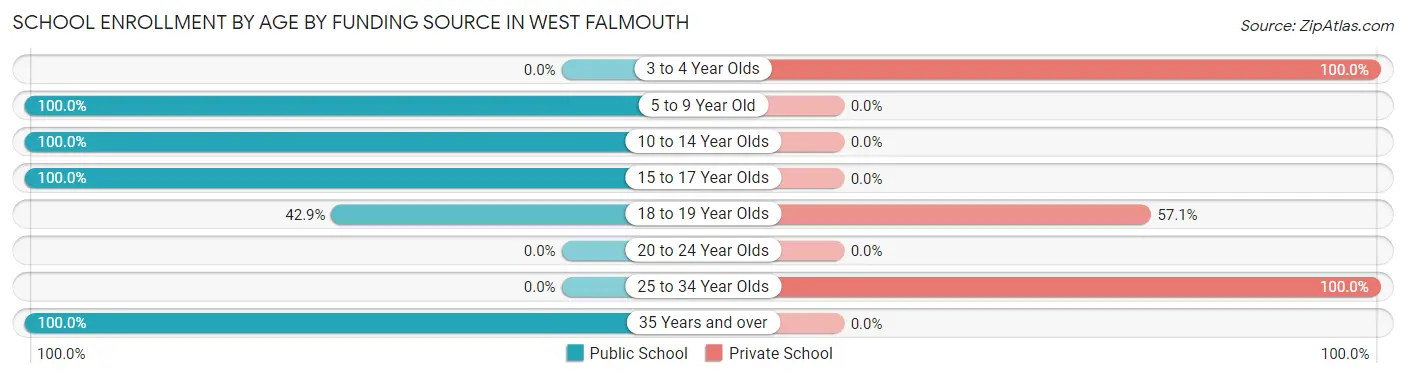
| Age Bracket | Public School | Private School |
| 3 to 4 Year Olds | 0 (0.0%) | 4 (100.0%) |
| 5 to 9 Year Old | 55 (100.0%) | 0 (0.0%) |
| 10 to 14 Year Olds | 80 (100.0%) | 0 (0.0%) |
| 15 to 17 Year Olds | 102 (100.0%) | 0 (0.0%) |
| 18 to 19 Year Olds | 15 (42.9%) | 20 (57.1%) |
| 20 to 24 Year Olds | 0 (0.0%) | 0 (0.0%) |
| 25 to 34 Year Olds | 0 (0.0%) | 23 (100.0%) |
| 35 Years and over | 9 (100.0%) | 0 (0.0%) |
| Total | 261 (84.7%) | 47 (15.3%) |
Educational Attainment by Field of Study in West Falmouth
Physical & health sciences (171 | 15.3%), bio, nature & agricultural (134 | 12.0%), education (123 | 11.0%), science & technology (114 | 10.2%), and business (99 | 8.9%) are the most common fields of study among 1,116 individuals in West Falmouth who have obtained a bachelor's degree or higher.
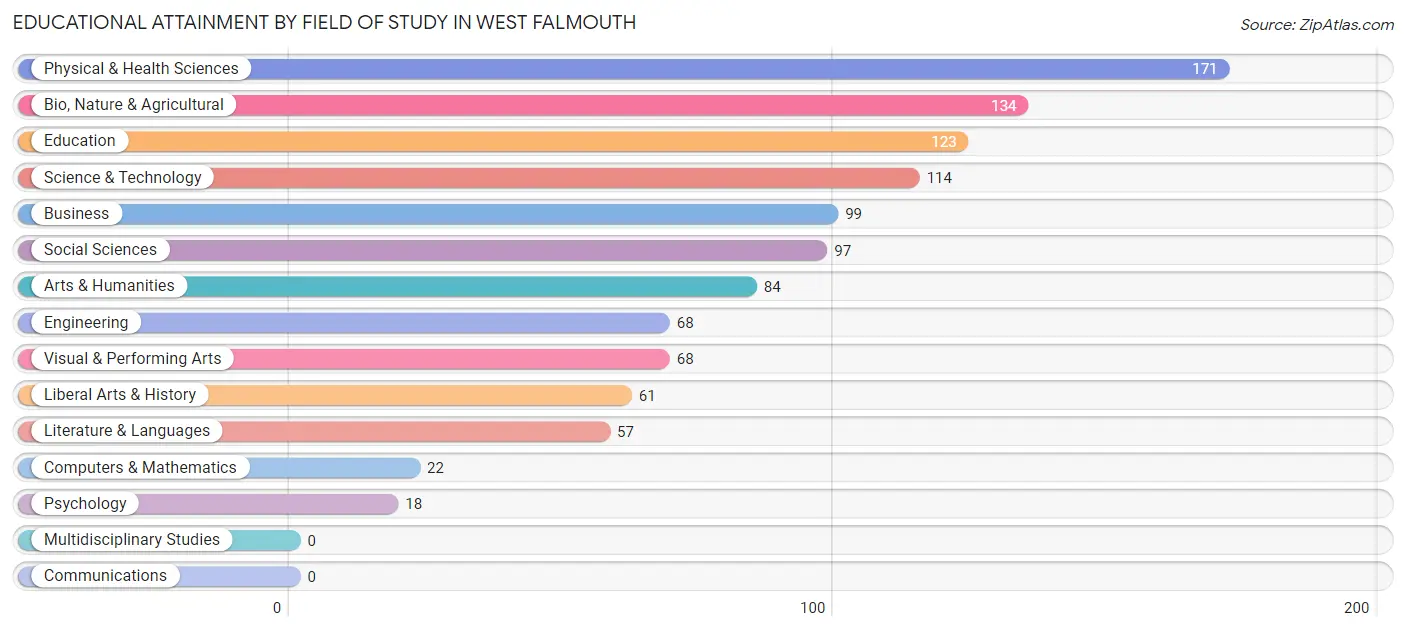
| Field of Study | # Graduates | % Graduates |
| Computers & Mathematics | 22 | 2.0% |
| Bio, Nature & Agricultural | 134 | 12.0% |
| Physical & Health Sciences | 171 | 15.3% |
| Psychology | 18 | 1.6% |
| Social Sciences | 97 | 8.7% |
| Engineering | 68 | 6.1% |
| Multidisciplinary Studies | 0 | 0.0% |
| Science & Technology | 114 | 10.2% |
| Business | 99 | 8.9% |
| Education | 123 | 11.0% |
| Literature & Languages | 57 | 5.1% |
| Liberal Arts & History | 61 | 5.5% |
| Visual & Performing Arts | 68 | 6.1% |
| Communications | 0 | 0.0% |
| Arts & Humanities | 84 | 7.5% |
| Total | 1,116 | 100.0% |
Transportation & Commute in West Falmouth
Vehicle Availability by Sex in West Falmouth
The most prevalent vehicle ownership categories in West Falmouth are males with 3 vehicles (219, accounting for 48.0%) and females with 3 vehicles (162, making up 63.8%).
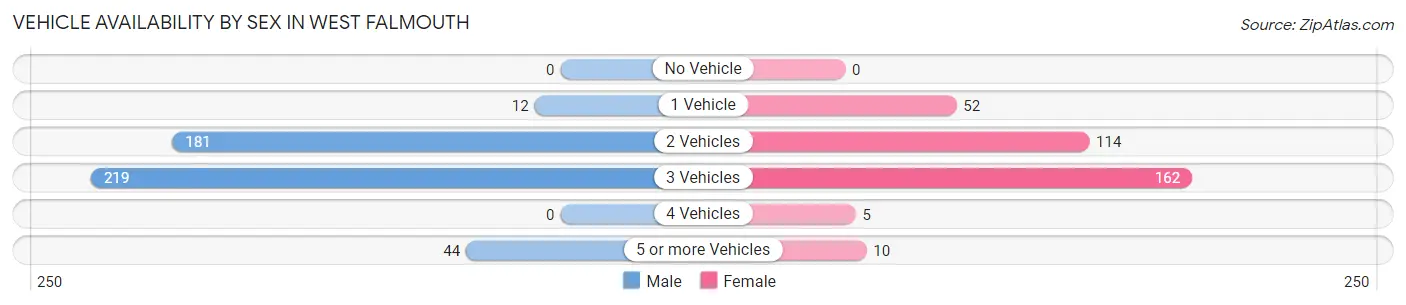
| Vehicles Available | Male | Female |
| No Vehicle | 0 (0.0%) | 0 (0.0%) |
| 1 Vehicle | 12 (2.6%) | 52 (15.2%) |
| 2 Vehicles | 181 (39.7%) | 114 (33.2%) |
| 3 Vehicles | 219 (48.0%) | 162 (47.2%) |
| 4 Vehicles | 0 (0.0%) | 5 (1.5%) |
| 5 or more Vehicles | 44 (9.7%) | 10 (2.9%) |
| Total | 456 (100.0%) | 343 (100.0%) |
Commute Time in West Falmouth
The most frequently occuring commute durations in West Falmouth are 10 to 14 minutes (182 commuters, 31.2%), 15 to 19 minutes (136 commuters, 23.3%), and 5 to 9 minutes (67 commuters, 11.5%).
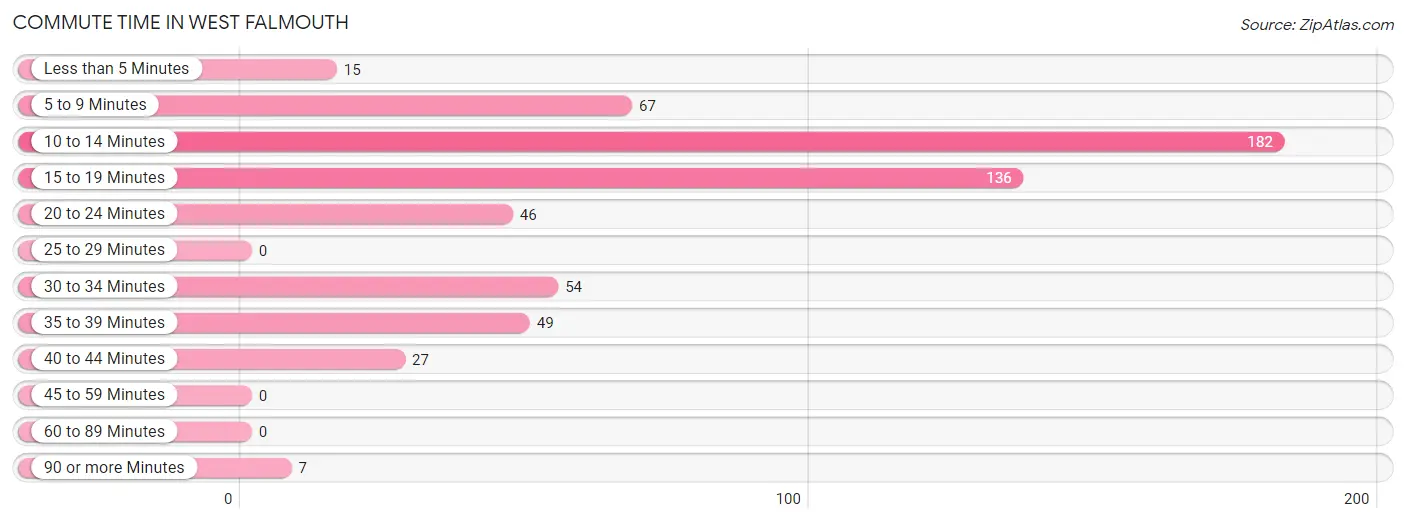
| Commute Time | # Commuters | % Commuters |
| Less than 5 Minutes | 15 | 2.6% |
| 5 to 9 Minutes | 67 | 11.5% |
| 10 to 14 Minutes | 182 | 31.2% |
| 15 to 19 Minutes | 136 | 23.3% |
| 20 to 24 Minutes | 46 | 7.9% |
| 25 to 29 Minutes | 0 | 0.0% |
| 30 to 34 Minutes | 54 | 9.3% |
| 35 to 39 Minutes | 49 | 8.4% |
| 40 to 44 Minutes | 27 | 4.6% |
| 45 to 59 Minutes | 0 | 0.0% |
| 60 to 89 Minutes | 0 | 0.0% |
| 90 or more Minutes | 7 | 1.2% |
Commute Time by Sex in West Falmouth
The most common commute times in West Falmouth are 10 to 14 minutes (121 commuters, 28.6%) for males and 10 to 14 minutes (61 commuters, 38.1%) for females.
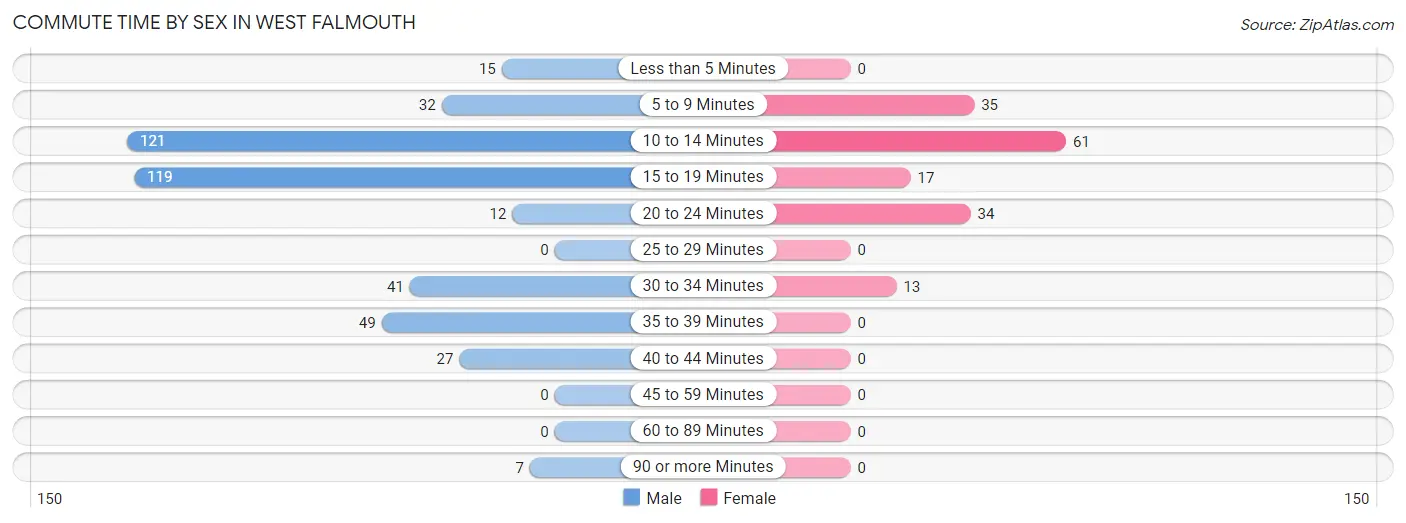
| Commute Time | Male | Female |
| Less than 5 Minutes | 15 (3.5%) | 0 (0.0%) |
| 5 to 9 Minutes | 32 (7.6%) | 35 (21.9%) |
| 10 to 14 Minutes | 121 (28.6%) | 61 (38.1%) |
| 15 to 19 Minutes | 119 (28.1%) | 17 (10.6%) |
| 20 to 24 Minutes | 12 (2.8%) | 34 (21.2%) |
| 25 to 29 Minutes | 0 (0.0%) | 0 (0.0%) |
| 30 to 34 Minutes | 41 (9.7%) | 13 (8.1%) |
| 35 to 39 Minutes | 49 (11.6%) | 0 (0.0%) |
| 40 to 44 Minutes | 27 (6.4%) | 0 (0.0%) |
| 45 to 59 Minutes | 0 (0.0%) | 0 (0.0%) |
| 60 to 89 Minutes | 0 (0.0%) | 0 (0.0%) |
| 90 or more Minutes | 7 (1.7%) | 0 (0.0%) |
Time of Departure to Work by Sex in West Falmouth
The most frequent times of departure to work in West Falmouth are 8:00 AM to 8:29 AM (86, 20.3%) for males and 7:00 AM to 7:29 AM (46, 28.7%) for females.
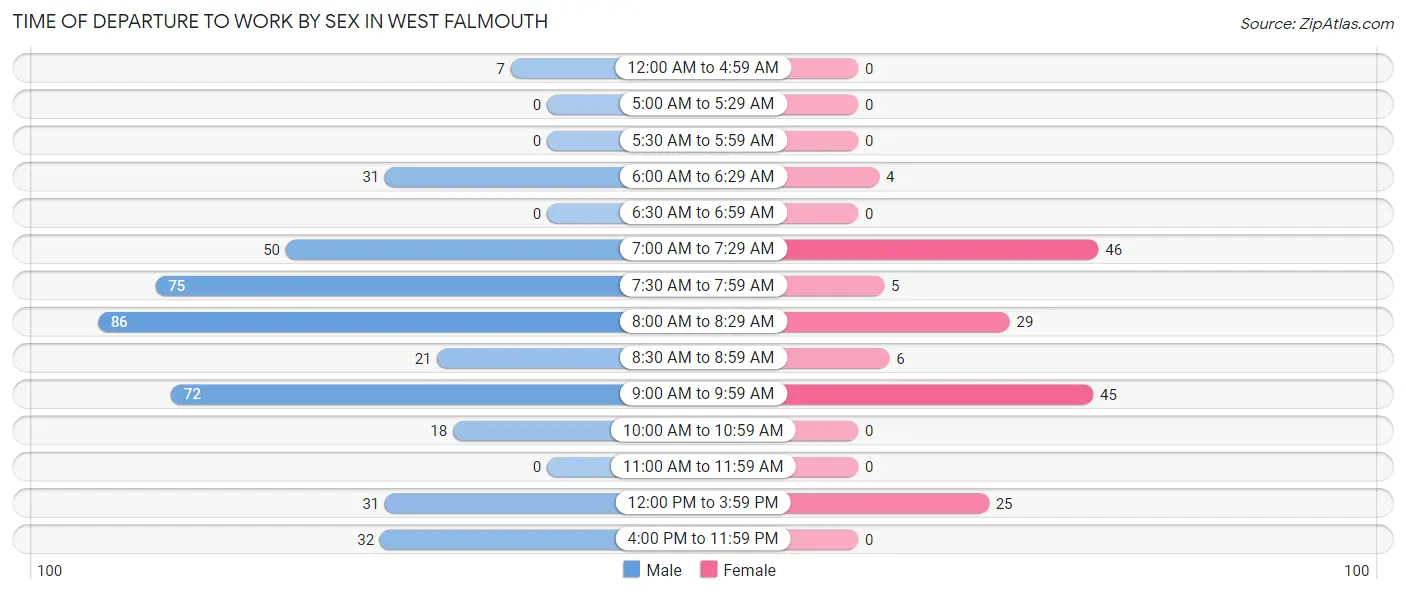
| Time of Departure | Male | Female |
| 12:00 AM to 4:59 AM | 7 (1.7%) | 0 (0.0%) |
| 5:00 AM to 5:29 AM | 0 (0.0%) | 0 (0.0%) |
| 5:30 AM to 5:59 AM | 0 (0.0%) | 0 (0.0%) |
| 6:00 AM to 6:29 AM | 31 (7.3%) | 4 (2.5%) |
| 6:30 AM to 6:59 AM | 0 (0.0%) | 0 (0.0%) |
| 7:00 AM to 7:29 AM | 50 (11.8%) | 46 (28.7%) |
| 7:30 AM to 7:59 AM | 75 (17.7%) | 5 (3.1%) |
| 8:00 AM to 8:29 AM | 86 (20.3%) | 29 (18.1%) |
| 8:30 AM to 8:59 AM | 21 (5.0%) | 6 (3.7%) |
| 9:00 AM to 9:59 AM | 72 (17.0%) | 45 (28.1%) |
| 10:00 AM to 10:59 AM | 18 (4.3%) | 0 (0.0%) |
| 11:00 AM to 11:59 AM | 0 (0.0%) | 0 (0.0%) |
| 12:00 PM to 3:59 PM | 31 (7.3%) | 25 (15.6%) |
| 4:00 PM to 11:59 PM | 32 (7.6%) | 0 (0.0%) |
| Total | 423 (100.0%) | 160 (100.0%) |
Housing Occupancy in West Falmouth
Occupancy by Ownership in West Falmouth
Of the total 750 dwellings in West Falmouth, owner-occupied units account for 750 (100.0%), while renter-occupied units make up 0 (0.0%).
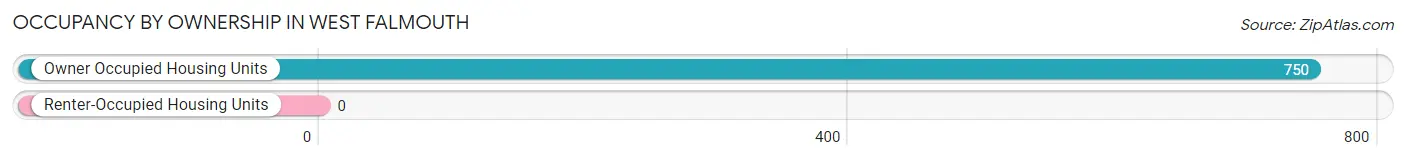
| Occupancy | # Housing Units | % Housing Units |
| Owner Occupied Housing Units | 750 | 100.0% |
| Renter-Occupied Housing Units | 0 | 0.0% |
| Total Occupied Housing Units | 750 | 100.0% |
Occupancy by Household Size in West Falmouth
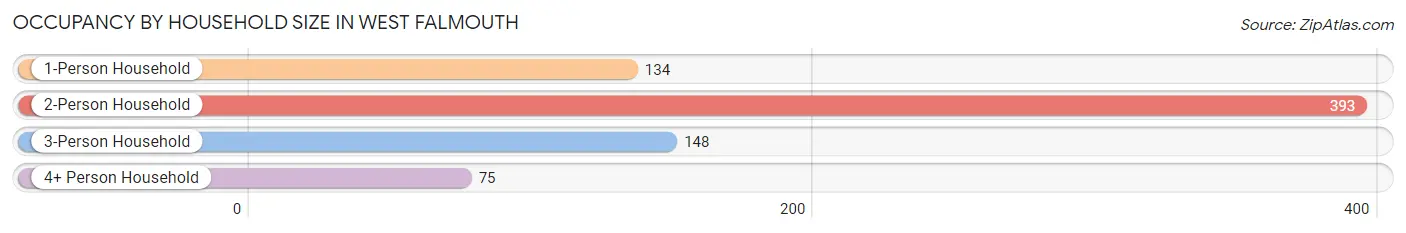
| Household Size | # Housing Units | % Housing Units |
| 1-Person Household | 134 | 17.9% |
| 2-Person Household | 393 | 52.4% |
| 3-Person Household | 148 | 19.7% |
| 4+ Person Household | 75 | 10.0% |
| Total Housing Units | 750 | 100.0% |
Occupancy by Ownership by Household Size in West Falmouth
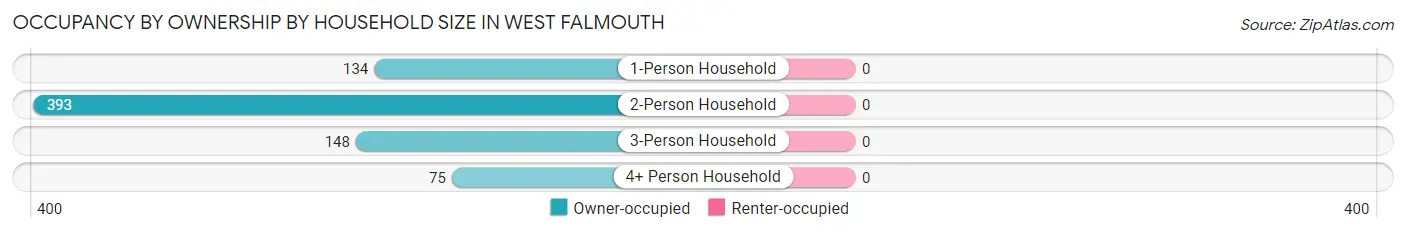
| Household Size | Owner-occupied | Renter-occupied |
| 1-Person Household | 134 (100.0%) | 0 (0.0%) |
| 2-Person Household | 393 (100.0%) | 0 (0.0%) |
| 3-Person Household | 148 (100.0%) | 0 (0.0%) |
| 4+ Person Household | 75 (100.0%) | 0 (0.0%) |
| Total Housing Units | 750 (100.0%) | 0 (0.0%) |
Occupancy by Educational Attainment in West Falmouth
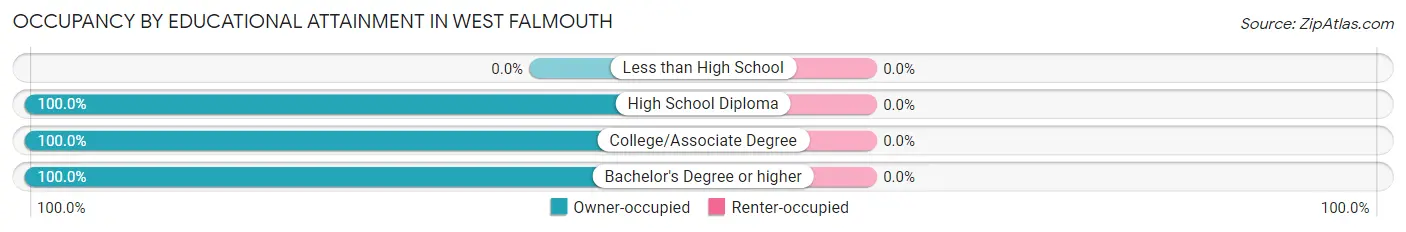
| Household Size | Owner-occupied | Renter-occupied |
| Less than High School | 0 (0.0%) | 0 (0.0%) |
| High School Diploma | 27 (100.0%) | 0 (0.0%) |
| College/Associate Degree | 199 (100.0%) | 0 (0.0%) |
| Bachelor's Degree or higher | 524 (100.0%) | 0 (0.0%) |
Occupancy by Age of Householder in West Falmouth
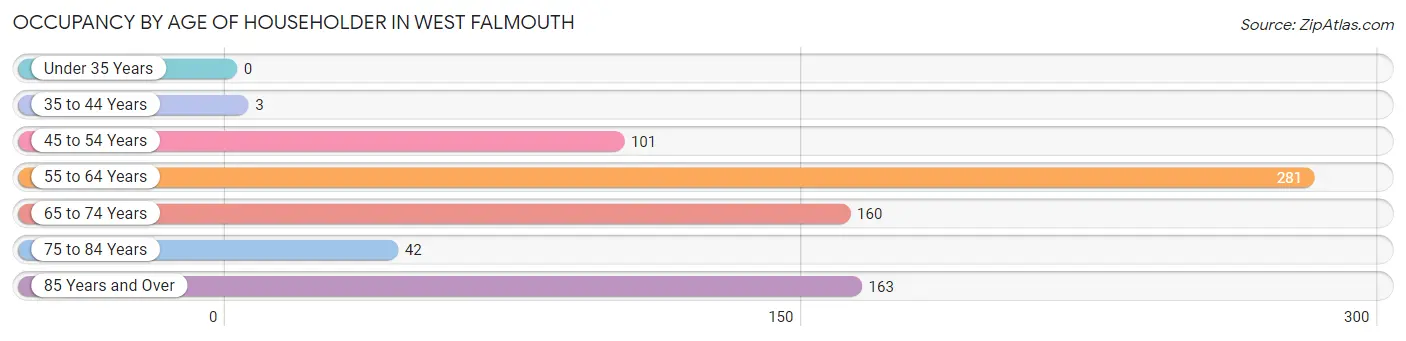
| Age Bracket | # Households | % Households |
| Under 35 Years | 0 | 0.0% |
| 35 to 44 Years | 3 | 0.4% |
| 45 to 54 Years | 101 | 13.5% |
| 55 to 64 Years | 281 | 37.5% |
| 65 to 74 Years | 160 | 21.3% |
| 75 to 84 Years | 42 | 5.6% |
| 85 Years and Over | 163 | 21.7% |
| Total | 750 | 100.0% |
Housing Finances in West Falmouth
Median Income by Occupancy in West Falmouth
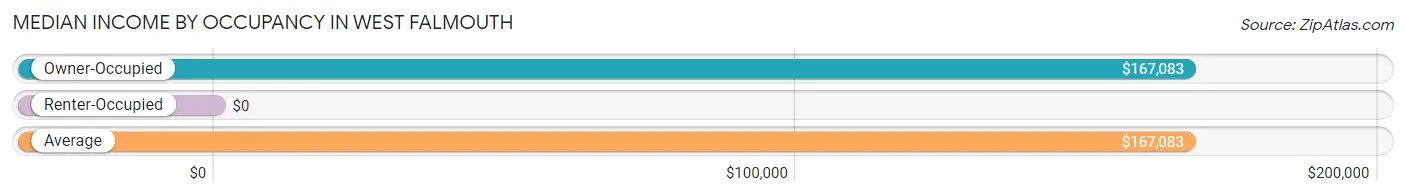
| Occupancy Type | # Households | Median Income |
| Owner-Occupied | 750 (100.0%) | $167,083 |
| Renter-Occupied | 0 (0.0%) | $0 |
| Average | 750 (100.0%) | $167,083 |
Occupancy by Householder Income Bracket in West Falmouth
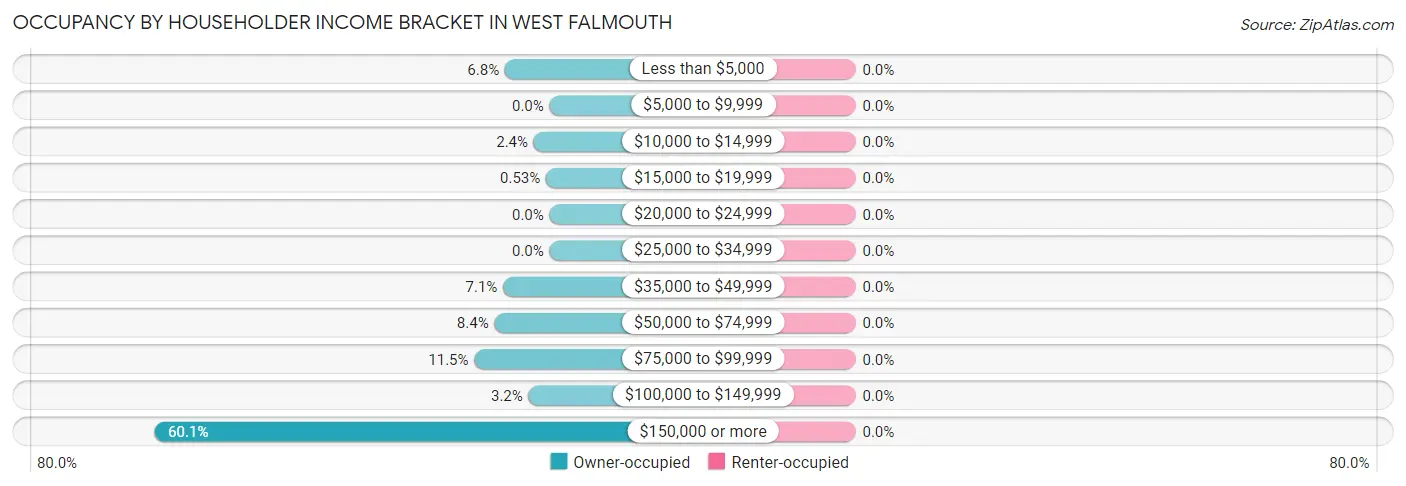
| Income Bracket | Owner-occupied | Renter-occupied |
| Less than $5,000 | 51 (6.8%) | 0 (0.0%) |
| $5,000 to $9,999 | 0 (0.0%) | 0 (0.0%) |
| $10,000 to $14,999 | 18 (2.4%) | 0 (0.0%) |
| $15,000 to $19,999 | 4 (0.5%) | 0 (0.0%) |
| $20,000 to $24,999 | 0 (0.0%) | 0 (0.0%) |
| $25,000 to $34,999 | 0 (0.0%) | 0 (0.0%) |
| $35,000 to $49,999 | 53 (7.1%) | 0 (0.0%) |
| $50,000 to $74,999 | 63 (8.4%) | 0 (0.0%) |
| $75,000 to $99,999 | 86 (11.5%) | 0 (0.0%) |
| $100,000 to $149,999 | 24 (3.2%) | 0 (0.0%) |
| $150,000 or more | 451 (60.1%) | 0 (0.0%) |
| Total | 750 (100.0%) | 0 (0.0%) |
Monthly Housing Cost Tiers in West Falmouth
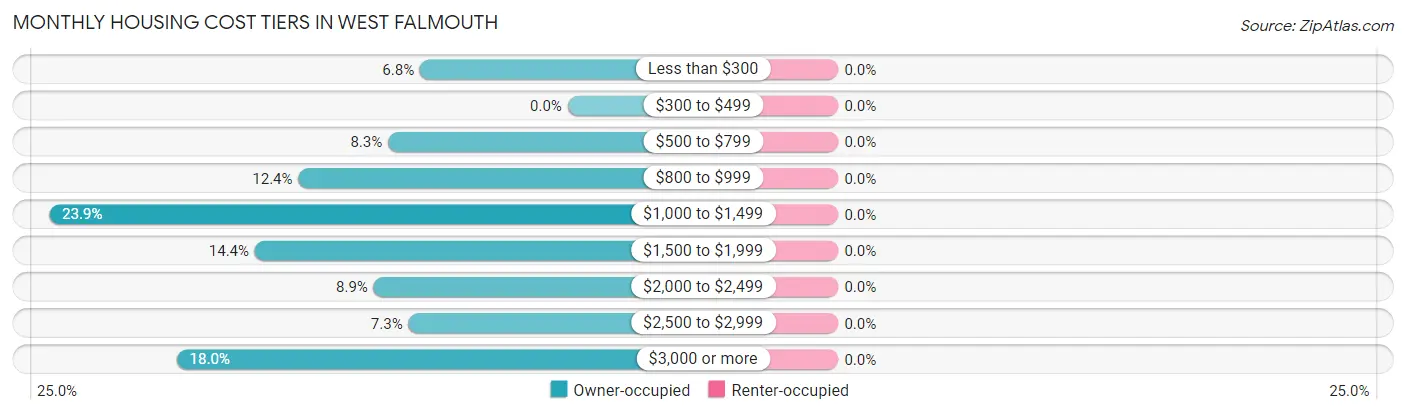
| Monthly Cost | Owner-occupied | Renter-occupied |
| Less than $300 | 51 (6.8%) | 0 (0.0%) |
| $300 to $499 | 0 (0.0%) | 0 (0.0%) |
| $500 to $799 | 62 (8.3%) | 0 (0.0%) |
| $800 to $999 | 93 (12.4%) | 0 (0.0%) |
| $1,000 to $1,499 | 179 (23.9%) | 0 (0.0%) |
| $1,500 to $1,999 | 108 (14.4%) | 0 (0.0%) |
| $2,000 to $2,499 | 67 (8.9%) | 0 (0.0%) |
| $2,500 to $2,999 | 55 (7.3%) | 0 (0.0%) |
| $3,000 or more | 135 (18.0%) | 0 (0.0%) |
| Total | 750 (100.0%) | 0 (0.0%) |
Physical Housing Characteristics in West Falmouth
Housing Structures in West Falmouth
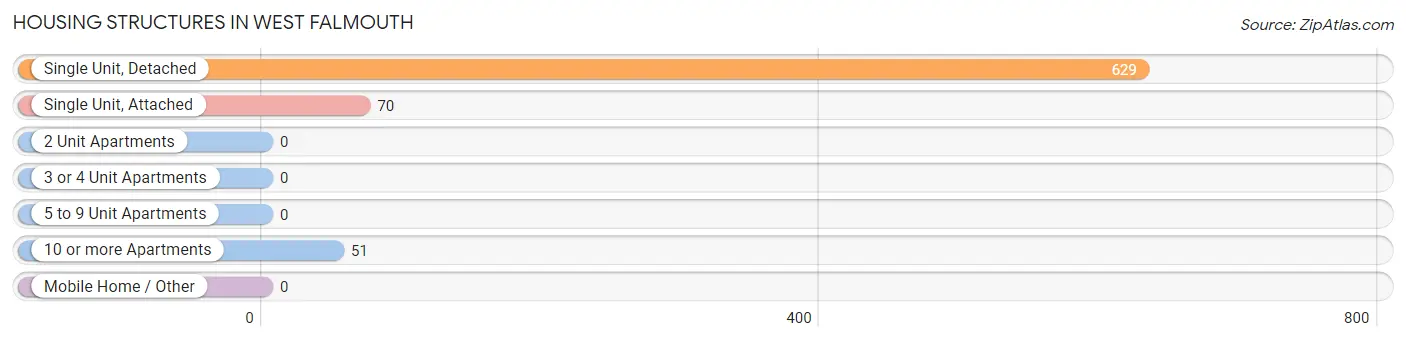
| Structure Type | # Housing Units | % Housing Units |
| Single Unit, Detached | 629 | 83.9% |
| Single Unit, Attached | 70 | 9.3% |
| 2 Unit Apartments | 0 | 0.0% |
| 3 or 4 Unit Apartments | 0 | 0.0% |
| 5 to 9 Unit Apartments | 0 | 0.0% |
| 10 or more Apartments | 51 | 6.8% |
| Mobile Home / Other | 0 | 0.0% |
| Total | 750 | 100.0% |
Housing Structures by Occupancy in West Falmouth
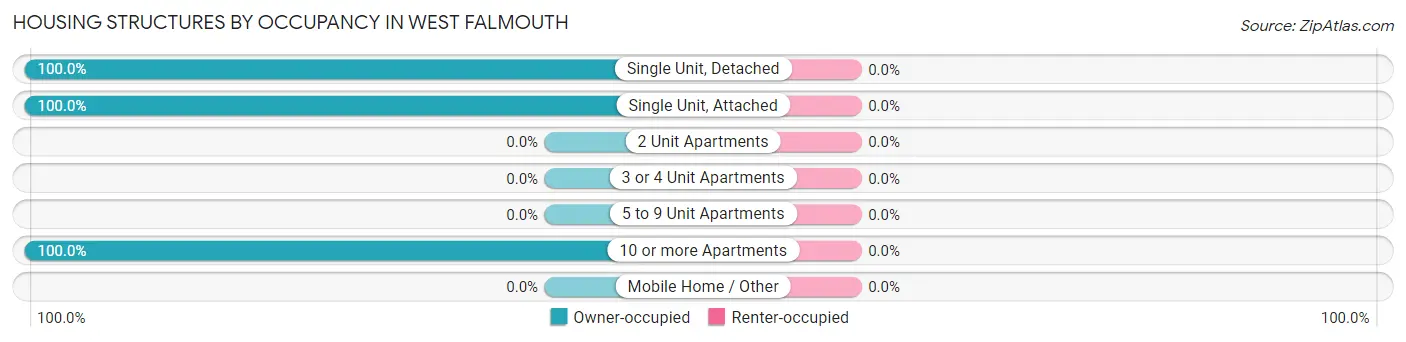
| Structure Type | Owner-occupied | Renter-occupied |
| Single Unit, Detached | 629 (100.0%) | 0 (0.0%) |
| Single Unit, Attached | 70 (100.0%) | 0 (0.0%) |
| 2 Unit Apartments | 0 (0.0%) | 0 (0.0%) |
| 3 or 4 Unit Apartments | 0 (0.0%) | 0 (0.0%) |
| 5 to 9 Unit Apartments | 0 (0.0%) | 0 (0.0%) |
| 10 or more Apartments | 51 (100.0%) | 0 (0.0%) |
| Mobile Home / Other | 0 (0.0%) | 0 (0.0%) |
| Total | 750 (100.0%) | 0 (0.0%) |
Housing Structures by Number of Rooms in West Falmouth
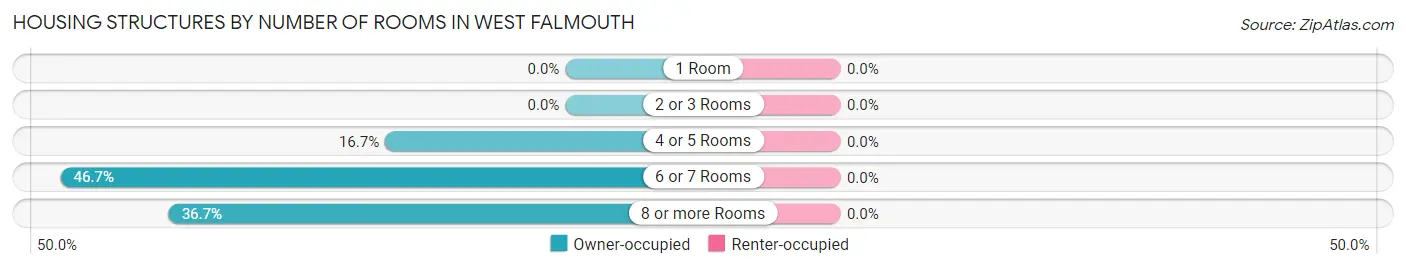
| Number of Rooms | Owner-occupied | Renter-occupied |
| 1 Room | 0 (0.0%) | 0 (0.0%) |
| 2 or 3 Rooms | 0 (0.0%) | 0 (0.0%) |
| 4 or 5 Rooms | 125 (16.7%) | 0 (0.0%) |
| 6 or 7 Rooms | 350 (46.7%) | 0 (0.0%) |
| 8 or more Rooms | 275 (36.7%) | 0 (0.0%) |
| Total | 750 (100.0%) | 0 (0.0%) |
Housing Structure by Heating Type in West Falmouth
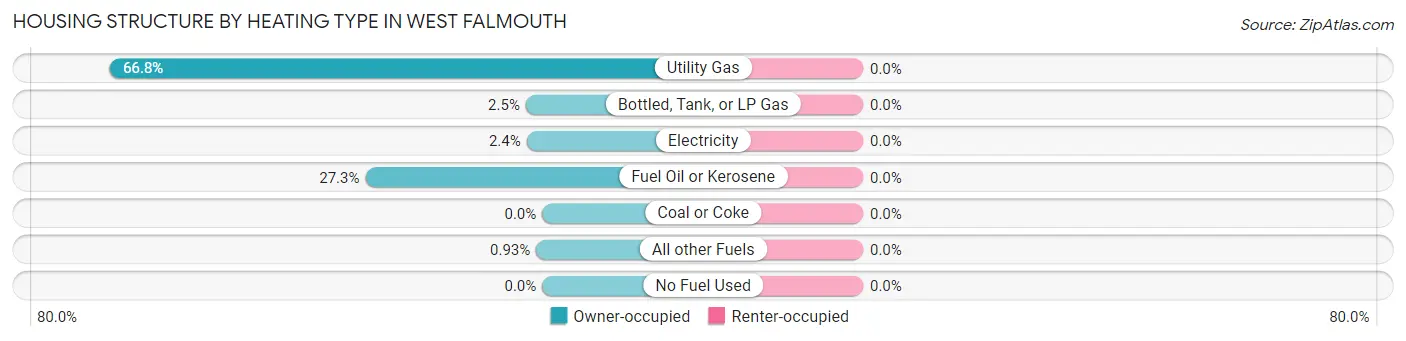
| Heating Type | Owner-occupied | Renter-occupied |
| Utility Gas | 501 (66.8%) | 0 (0.0%) |
| Bottled, Tank, or LP Gas | 19 (2.5%) | 0 (0.0%) |
| Electricity | 18 (2.4%) | 0 (0.0%) |
| Fuel Oil or Kerosene | 205 (27.3%) | 0 (0.0%) |
| Coal or Coke | 0 (0.0%) | 0 (0.0%) |
| All other Fuels | 7 (0.9%) | 0 (0.0%) |
| No Fuel Used | 0 (0.0%) | 0 (0.0%) |
| Total | 750 (100.0%) | 0 (0.0%) |
Household Vehicle Usage in West Falmouth
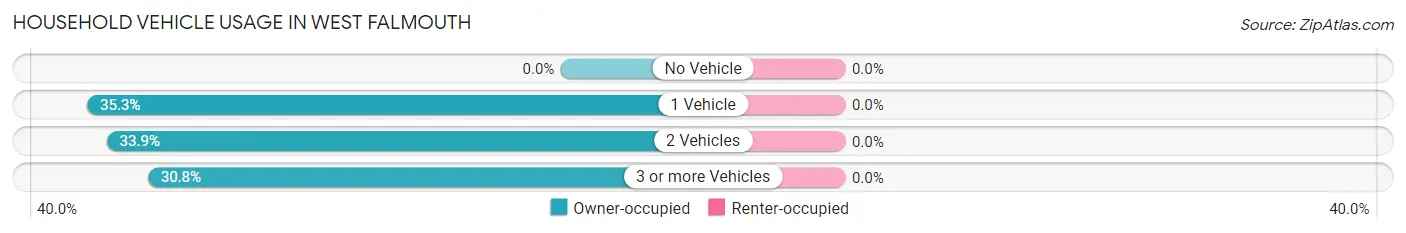
| Vehicles per Household | Owner-occupied | Renter-occupied |
| No Vehicle | 0 (0.0%) | 0 (0.0%) |
| 1 Vehicle | 265 (35.3%) | 0 (0.0%) |
| 2 Vehicles | 254 (33.9%) | 0 (0.0%) |
| 3 or more Vehicles | 231 (30.8%) | 0 (0.0%) |
| Total | 750 (100.0%) | 0 (0.0%) |
Real Estate & Mortgages in West Falmouth
Real Estate and Mortgage Overview in West Falmouth
| Characteristic | Without Mortgage | With Mortgage |
| Housing Units | 405 | 345 |
| Median Property Value | $638,700 | $745,500 |
| Median Household Income | $145,938 | $256 |
| Monthly Housing Costs | $1,041 | $135 |
| Real Estate Taxes | $5,557 | $0 |
Property Value by Mortgage Status in West Falmouth

| Property Value | Without Mortgage | With Mortgage |
| Less than $50,000 | 0 (0.0%) | 0 (0.0%) |
| $50,000 to $99,999 | 0 (0.0%) | 0 (0.0%) |
| $100,000 to $299,999 | 0 (0.0%) | 0 (0.0%) |
| $300,000 to $499,999 | 76 (18.8%) | 91 (26.4%) |
| $500,000 to $749,999 | 228 (56.3%) | 83 (24.1%) |
| $750,000 to $999,999 | 80 (19.8%) | 104 (30.1%) |
| $1,000,000 or more | 21 (5.2%) | 67 (19.4%) |
| Total | 405 (100.0%) | 345 (100.0%) |
Household Income by Mortgage Status in West Falmouth
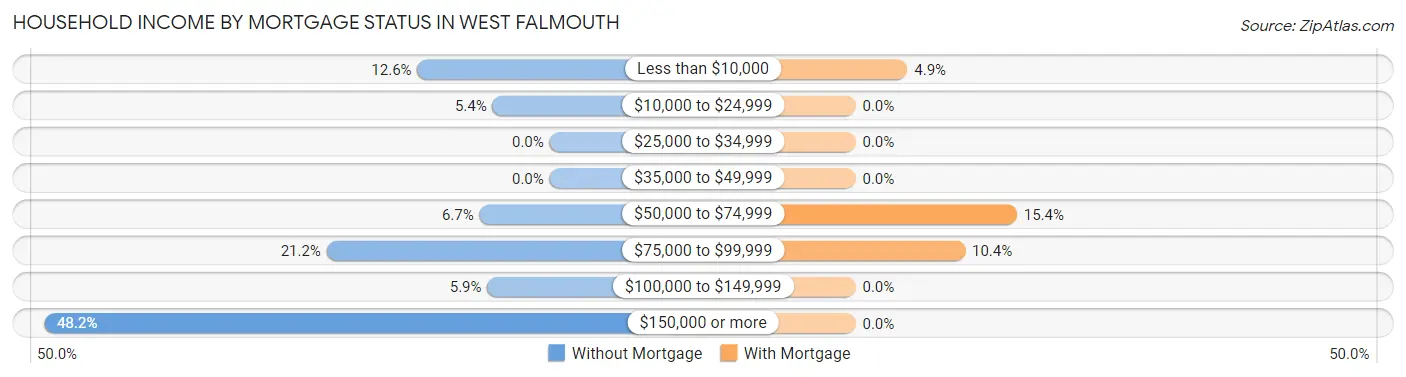
| Household Income | Without Mortgage | With Mortgage |
| Less than $10,000 | 51 (12.6%) | 17 (4.9%) |
| $10,000 to $24,999 | 22 (5.4%) | 0 (0.0%) |
| $25,000 to $34,999 | 0 (0.0%) | 0 (0.0%) |
| $35,000 to $49,999 | 0 (0.0%) | 0 (0.0%) |
| $50,000 to $74,999 | 27 (6.7%) | 53 (15.4%) |
| $75,000 to $99,999 | 86 (21.2%) | 36 (10.4%) |
| $100,000 to $149,999 | 24 (5.9%) | 0 (0.0%) |
| $150,000 or more | 195 (48.1%) | 0 (0.0%) |
| Total | 405 (100.0%) | 345 (100.0%) |
Property Value to Household Income Ratio in West Falmouth
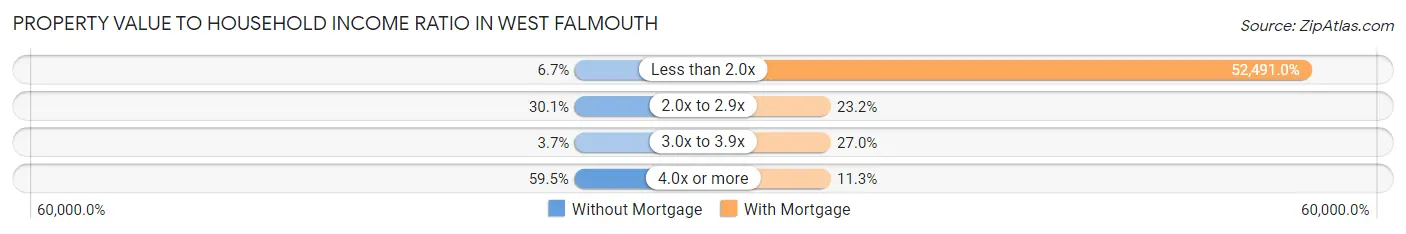
| Value-to-Income Ratio | Without Mortgage | With Mortgage |
| Less than 2.0x | 27 (6.7%) | 181,094 (52,491.0%) |
| 2.0x to 2.9x | 122 (30.1%) | 80 (23.2%) |
| 3.0x to 3.9x | 15 (3.7%) | 93 (27.0%) |
| 4.0x or more | 241 (59.5%) | 39 (11.3%) |
| Total | 405 (100.0%) | 345 (100.0%) |
Real Estate Taxes by Mortgage Status in West Falmouth

| Property Taxes | Without Mortgage | With Mortgage |
| Less than $800 | 0 (0.0%) | 0 (0.0%) |
| $800 to $1,499 | 0 (0.0%) | 0 (0.0%) |
| $800 to $1,499 | 354 (87.4%) | 0 (0.0%) |
| Total | 405 (100.0%) | 345 (100.0%) |
Health & Disability in West Falmouth
Health Insurance Coverage by Age in West Falmouth
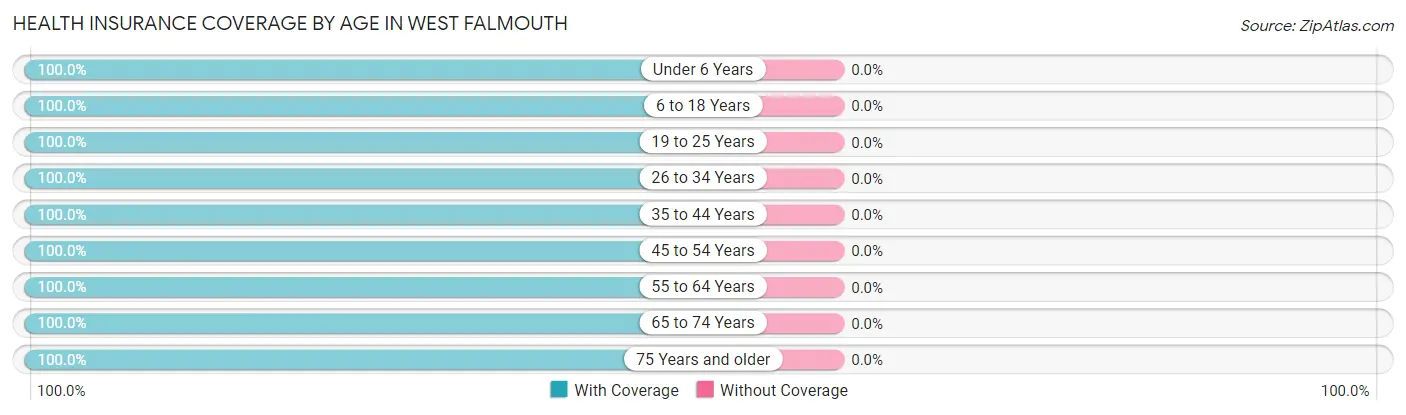
| Age Bracket | With Coverage | Without Coverage |
| Under 6 Years | 18 (100.0%) | 0 (0.0%) |
| 6 to 18 Years | 258 (100.0%) | 0 (0.0%) |
| 19 to 25 Years | 78 (100.0%) | 0 (0.0%) |
| 26 to 34 Years | 41 (100.0%) | 0 (0.0%) |
| 35 to 44 Years | 51 (100.0%) | 0 (0.0%) |
| 45 to 54 Years | 182 (100.0%) | 0 (0.0%) |
| 55 to 64 Years | 475 (100.0%) | 0 (0.0%) |
| 65 to 74 Years | 257 (100.0%) | 0 (0.0%) |
| 75 Years and older | 433 (100.0%) | 0 (0.0%) |
| Total | 1,793 (100.0%) | 0 (0.0%) |
Health Insurance Coverage by Citizenship Status in West Falmouth
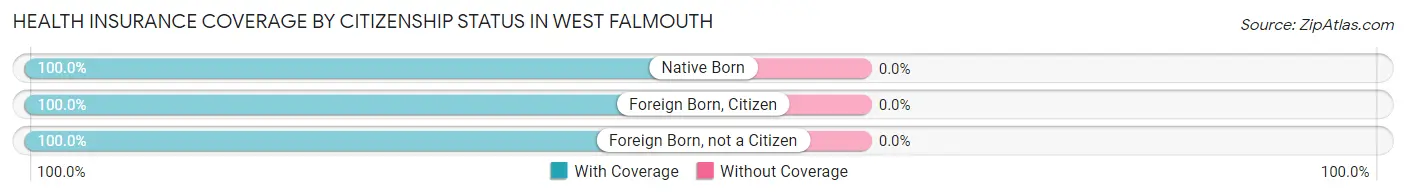
| Citizenship Status | With Coverage | Without Coverage |
| Native Born | 18 (100.0%) | 0 (0.0%) |
| Foreign Born, Citizen | 258 (100.0%) | 0 (0.0%) |
| Foreign Born, not a Citizen | 78 (100.0%) | 0 (0.0%) |
Health Insurance Coverage by Household Income in West Falmouth
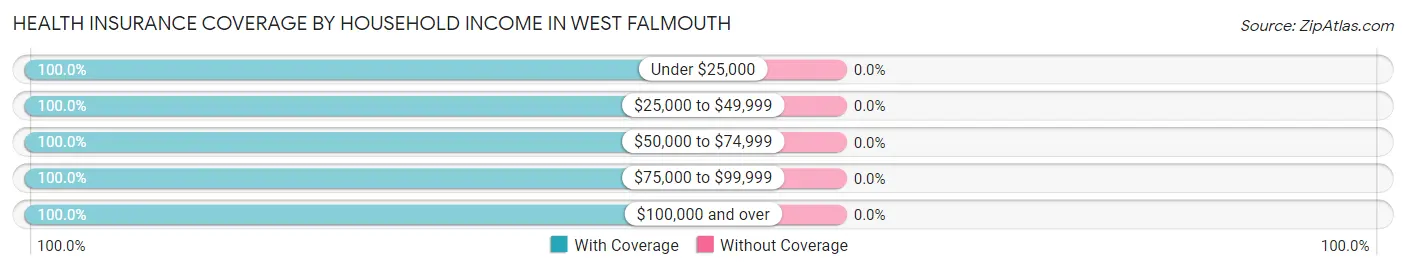
| Household Income | With Coverage | Without Coverage |
| Under $25,000 | 92 (100.0%) | 0 (0.0%) |
| $25,000 to $49,999 | 140 (100.0%) | 0 (0.0%) |
| $50,000 to $74,999 | 111 (100.0%) | 0 (0.0%) |
| $75,000 to $99,999 | 174 (100.0%) | 0 (0.0%) |
| $100,000 and over | 1,255 (100.0%) | 0 (0.0%) |
Public vs Private Health Insurance Coverage by Age in West Falmouth
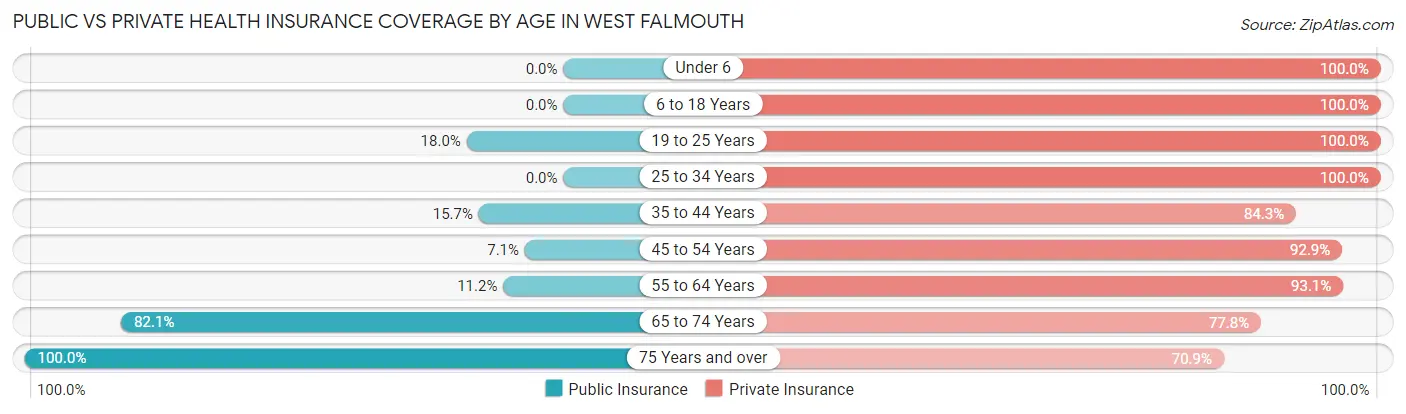
| Age Bracket | Public Insurance | Private Insurance |
| Under 6 | 0 (0.0%) | 18 (100.0%) |
| 6 to 18 Years | 0 (0.0%) | 258 (100.0%) |
| 19 to 25 Years | 14 (17.9%) | 78 (100.0%) |
| 25 to 34 Years | 0 (0.0%) | 41 (100.0%) |
| 35 to 44 Years | 8 (15.7%) | 43 (84.3%) |
| 45 to 54 Years | 13 (7.1%) | 169 (92.9%) |
| 55 to 64 Years | 53 (11.2%) | 442 (93.0%) |
| 65 to 74 Years | 211 (82.1%) | 200 (77.8%) |
| 75 Years and over | 433 (100.0%) | 307 (70.9%) |
| Total | 732 (40.8%) | 1,556 (86.8%) |
Disability Status by Sex by Age in West Falmouth
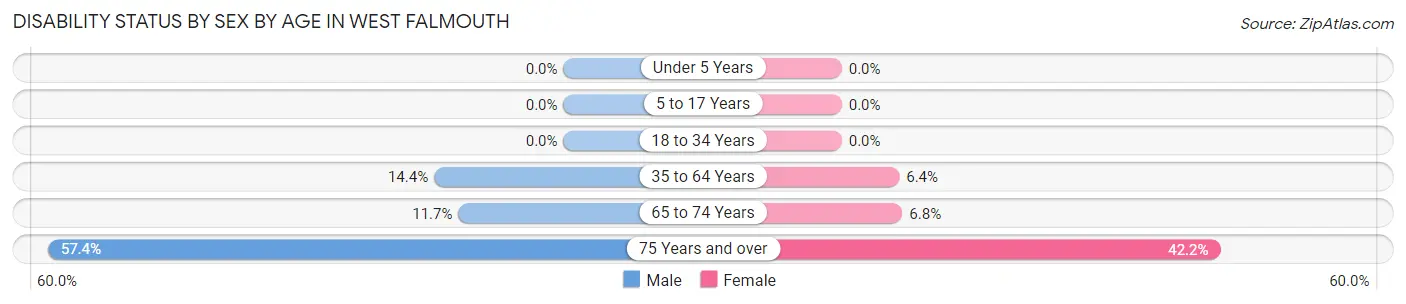
| Age Bracket | Male | Female |
| Under 5 Years | 0 (0.0%) | 0 (0.0%) |
| 5 to 17 Years | 0 (0.0%) | 0 (0.0%) |
| 18 to 34 Years | 0 (0.0%) | 0 (0.0%) |
| 35 to 64 Years | 48 (14.4%) | 24 (6.4%) |
| 65 to 74 Years | 11 (11.7%) | 11 (6.8%) |
| 75 Years and over | 62 (57.4%) | 137 (42.1%) |
Disability Class by Sex by Age in West Falmouth
Disability Class: Hearing Difficulty
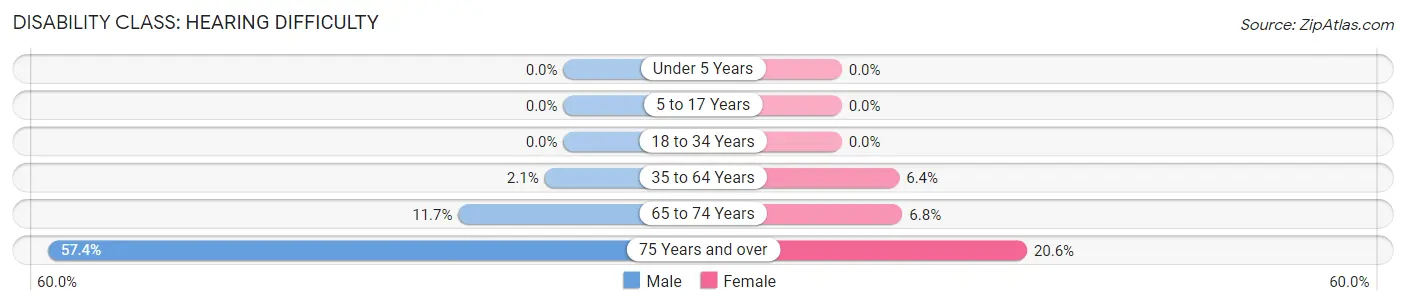
| Age Bracket | Male | Female |
| Under 5 Years | 0 (0.0%) | 0 (0.0%) |
| 5 to 17 Years | 0 (0.0%) | 0 (0.0%) |
| 18 to 34 Years | 0 (0.0%) | 0 (0.0%) |
| 35 to 64 Years | 7 (2.1%) | 24 (6.4%) |
| 65 to 74 Years | 11 (11.7%) | 11 (6.8%) |
| 75 Years and over | 62 (57.4%) | 67 (20.6%) |
Disability Class: Vision Difficulty
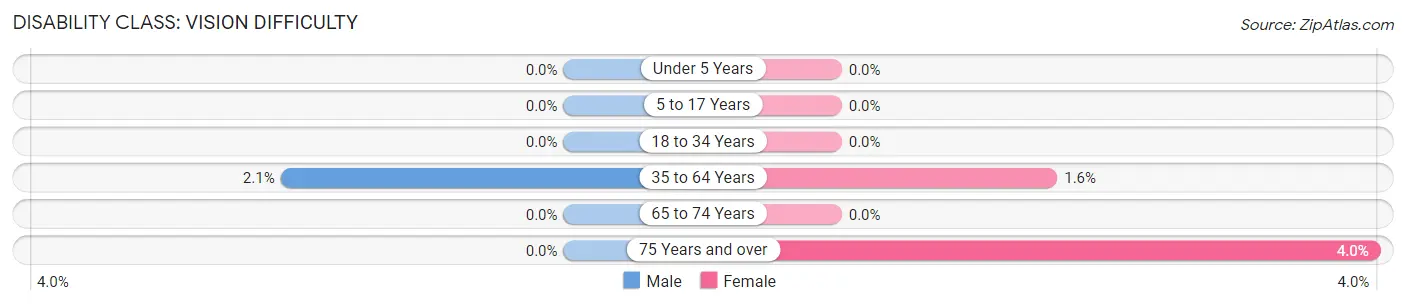
| Age Bracket | Male | Female |
| Under 5 Years | 0 (0.0%) | 0 (0.0%) |
| 5 to 17 Years | 0 (0.0%) | 0 (0.0%) |
| 18 to 34 Years | 0 (0.0%) | 0 (0.0%) |
| 35 to 64 Years | 7 (2.1%) | 6 (1.6%) |
| 65 to 74 Years | 0 (0.0%) | 0 (0.0%) |
| 75 Years and over | 0 (0.0%) | 13 (4.0%) |
Disability Class: Cognitive Difficulty

| Age Bracket | Male | Female |
| 5 to 17 Years | 0 (0.0%) | 0 (0.0%) |
| 18 to 34 Years | 0 (0.0%) | 0 (0.0%) |
| 35 to 64 Years | 41 (12.3%) | 0 (0.0%) |
| 65 to 74 Years | 0 (0.0%) | 0 (0.0%) |
| 75 Years and over | 0 (0.0%) | 13 (4.0%) |
Disability Class: Ambulatory Difficulty
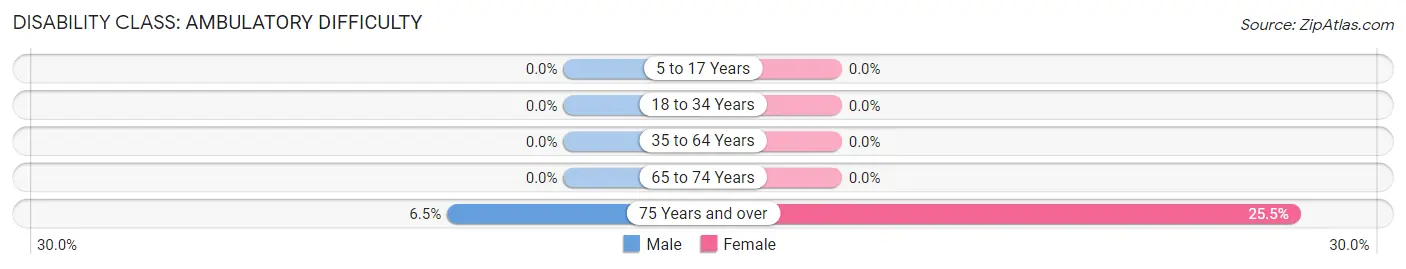
| Age Bracket | Male | Female |
| 5 to 17 Years | 0 (0.0%) | 0 (0.0%) |
| 18 to 34 Years | 0 (0.0%) | 0 (0.0%) |
| 35 to 64 Years | 0 (0.0%) | 0 (0.0%) |
| 65 to 74 Years | 0 (0.0%) | 0 (0.0%) |
| 75 Years and over | 7 (6.5%) | 83 (25.5%) |
Disability Class: Self-Care Difficulty

| Age Bracket | Male | Female |
| 5 to 17 Years | 0 (0.0%) | 0 (0.0%) |
| 18 to 34 Years | 0 (0.0%) | 0 (0.0%) |
| 35 to 64 Years | 0 (0.0%) | 0 (0.0%) |
| 65 to 74 Years | 0 (0.0%) | 0 (0.0%) |
| 75 Years and over | 0 (0.0%) | 32 (9.9%) |
Technology Access in West Falmouth
Computing Device Access in West Falmouth
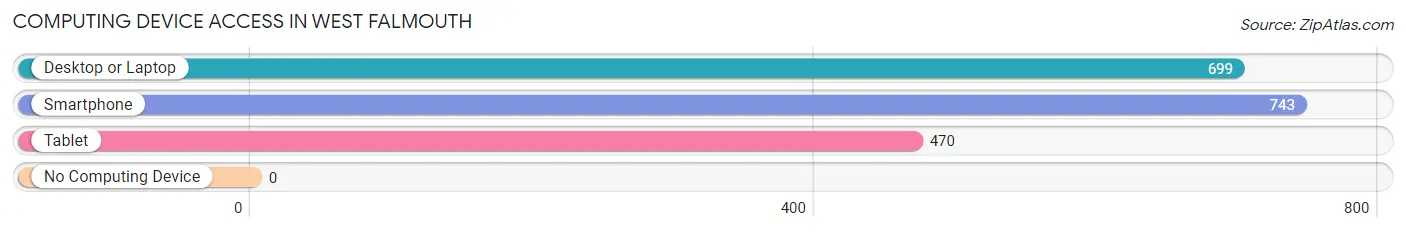
| Device Type | # Households | % Households |
| Desktop or Laptop | 699 | 93.2% |
| Smartphone | 743 | 99.1% |
| Tablet | 470 | 62.7% |
| No Computing Device | 0 | 0.0% |
| Total | 750 | 100.0% |
Internet Access in West Falmouth
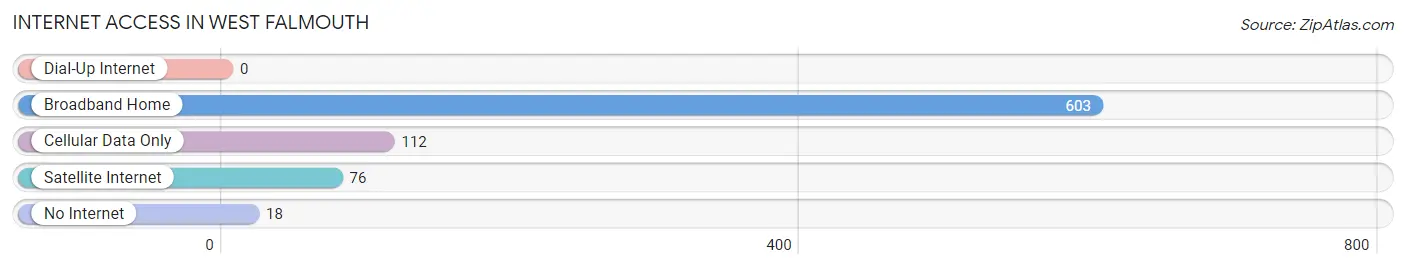
| Internet Type | # Households | % Households |
| Dial-Up Internet | 0 | 0.0% |
| Broadband Home | 603 | 80.4% |
| Cellular Data Only | 112 | 14.9% |
| Satellite Internet | 76 | 10.1% |
| No Internet | 18 | 2.4% |
| Total | 750 | 100.0% |
West Falmouth Summary
History
West Falmouth is a small village located in the town of Falmouth, Massachusetts, on the southwestern tip of Cape Cod. The area was first settled in 1660 by a group of English settlers from the Plymouth Colony. The settlers named the area West Falmouth, as it was the westernmost settlement in the town of Falmouth. The area was primarily used for farming and fishing, and the settlers built a small fishing village on the shore of Buzzards Bay.
In the late 19th century, West Falmouth began to develop as a summer resort destination. The area was known for its beautiful beaches, and wealthy families from Boston and New York began to build large summer homes in the area. The village also became a popular destination for artists, writers, and musicians, who were drawn to the area's natural beauty and peaceful atmosphere.
In the early 20th century, West Falmouth began to develop as a year-round community. The village was home to a number of small businesses, including a general store, a post office, and a few restaurants. The village also had a small school, which served the local children.
Geography
West Falmouth is located in the town of Falmouth, Massachusetts, on the southwestern tip of Cape Cod. The village is situated on the shore of Buzzards Bay, and is bordered by the towns of Bourne and Mashpee to the north, and Sandwich to the east. The village is approximately 25 miles from the city of Boston, and is accessible by car via Route 28.
The village of West Falmouth is located in a coastal plain, and is surrounded by rolling hills and woodlands. The area is known for its beautiful beaches, and is home to a number of parks and nature preserves. The village is also home to a number of small ponds and streams, which provide a habitat for a variety of wildlife.
Economy
The economy of West Falmouth is largely based on tourism and the service industry. The village is home to a number of small businesses, including restaurants, shops, and galleries. The village is also home to a number of bed and breakfasts, which cater to tourists and visitors to the area.
West Falmouth is also home to a number of marinas, which provide services to boaters and fishermen. The village is also home to a number of charter fishing boats, which offer deep-sea fishing trips to visitors.
Demographics
As of the 2010 census, the population of West Falmouth was 2,845. The population is primarily white (94.3%), with a small percentage of African Americans (2.2%) and Hispanics (2.1%). The median household income in the village is $68,944, and the median home value is $521,400.
The village is home to a number of churches, including the West Falmouth Congregational Church, the West Falmouth Methodist Church, and the West Falmouth Baptist Church. The village is also home to a number of schools, including the West Falmouth Elementary School, the West Falmouth Middle School, and the West Falmouth High School.
Common Questions
What is the Total Population of West Falmouth?
Total Population of West Falmouth is 1,793.
What is the Total Male Population of West Falmouth?
Total Male Population of West Falmouth is 809.
What is the Total Female Population of West Falmouth?
Total Female Population of West Falmouth is 984.
What is the Ratio of Males per 100 Females in West Falmouth?
There are 82.22 Males per 100 Females in West Falmouth.
What is the Ratio of Females per 100 Males in West Falmouth?
There are 121.63 Females per 100 Males in West Falmouth.
What is the Median Population Age in West Falmouth?
Median Population Age in West Falmouth is 61.4 Years.
What is the Average Family Size in West Falmouth
Average Family Size in West Falmouth is 2.7 People.
What is the Average Household Size in West Falmouth
Average Household Size in West Falmouth is 2.4 People.
What is Per Capita Income in West Falmouth?
Per Capita income in West Falmouth is $83,057.
What is the Median Family Income in West Falmouth?
Median Family Income in West Falmouth is $182,262.
What is the Median Household income in West Falmouth?
Median Household Income in West Falmouth is $167,083.
What is Inequality or Gini Index in West Falmouth?
Inequality or Gini Index in West Falmouth is 0.44.
How Large is the Labor Force in West Falmouth?
There are 875 People in the Labor Forcein in West Falmouth.
What is the Percentage of People in the Labor Force in West Falmouth?
54.5% of People are in the Labor Force in West Falmouth.
What is the Unemployment Rate in West Falmouth?
Unemployment Rate in West Falmouth is 8.7%.