Immigrants from Sri Lanka vs Immigrants from Bolivia 2 or more Vehicles in Household

COMPARE

Immigrants from Sri Lanka
Race
Ancestry
AfghanAfricanAlaska NativeAlaskan AthabascanAlbanianAleutAlsatianAmericanApacheArabArapahoArgentineanArmenianAssyrian/Chaldean/SyriacAustralianAustrianBahamianBangladeshiBarbadianBasqueBelgianBelizeanBermudanBhutaneseBlackfeetBolivianBrazilianBritishBritish West IndianBulgarianBurmeseCajunCambodianCanadianCape VerdeanCarpatho RusynCelticCentral AmericanCentral American IndianCherokeeCheyenneChickasawChileanChineseChippewaChoctawColombianColvilleComancheCosta RicanCreeCreekCroatianCrowCubanCypriotCzechCzechoslovakianDanishDelawareDominicanDutchDutch West IndianEastern EuropeanEcuadorianEgyptianEnglishEstonianEthiopianEuropeanFijianFilipinoFinnishFrenchFrench American IndianFrench CanadianGermanGerman RussianGhanaianGreekGuamanian/ChamorroGuatemalanGuyaneseHaitianHmongHonduranHopiHoumaHungarianIcelanderIndian (Asian)IndonesianInupiatIranianIraqiIrishIroquoisIsraeliItalianJamaicanJapaneseJordanianKenyanKiowaKoreanLaotianLatvianLebaneseLiberianLithuanianLumbeeLuxembourgerMacedonianMalaysianMalteseMarshalleseMenomineeMexicanMexican American IndianMongolianMoroccanNative HawaiianNavajoNepaleseNew ZealanderNicaraguanNigerianNorthern EuropeanNorwegianOkinawanOsageOttawaPaiutePakistaniPalestinianPanamanianParaguayanPennsylvania GermanPeruvianPimaPolishPortuguesePotawatomiPuebloPuerto RicanPuget Sound SalishRomanianRussianSalvadoranSamoanScandinavianScotch-IrishScottishSeminoleSenegaleseSerbianShoshoneSierra LeoneanSiouxSlavicSlovakSloveneSomaliSouth AfricanSouth AmericanSouth American IndianSoviet UnionSpaniardSpanishSpanish AmericanSpanish American IndianSri LankanSubsaharan AfricanSudaneseSwedishSwissSyrianTaiwaneseThaiTlingit-HaidaTohono O'OdhamTonganTrinidadian and TobagonianTsimshianTurkishU.S. Virgin IslanderUgandanUkrainianUruguayanUteVenezuelanVietnameseWelshWest IndianYakamaYaquiYugoslavianYumanYup'ikZimbabwean
Immigration
NonimmigrantsImmigrantsAfghanistanAfricaAlbaniaArgentinaArmeniaAsiaAustraliaAustriaBahamasBangladeshBarbadosBelarusBelgiumBelizeBosnia and HerzegovinaBrazilBulgariaBurma/MyanmarCabo VerdeCambodiaCameroonCanadaCaribbeanCentral AmericaChileChinaColombiaCongoCosta RicaCroatiaCubaCzechoslovakiaDenmarkDominicaDominican RepublicEastern AfricaEastern AsiaEastern EuropeEcuadorEgyptEl SalvadorEnglandEritreaEthiopiaEuropeFijiFranceGermanyGhanaGreeceGrenadaGuatemalaGuyanaHaitiHondurasHong KongHungaryIndiaIndonesiaIranIraqIrelandIsraelItalyJamaicaJapanJordanKazakhstanKenyaKoreaKuwaitLaosLatin AmericaLatviaLebanonLiberiaLithuaniaMalaysiaMexicoMicronesiaMiddle AfricaMoldovaMoroccoNepalNetherlandsNicaraguaNigeriaNorth AmericaNorth MacedoniaNorthern AfricaNorthern EuropeNorwayOceaniaPakistanPanamaPeruPhilippinesPolandPortugalRomaniaRussiaSaudi ArabiaScotlandSenegalSerbiaSierra LeoneSingaporeSomaliaSouth AfricaSouth AmericaSouth Central AsiaSouth Eastern AsiaSouthern EuropeSpainSri LankaSt. Vincent and the GrenadinesSudanSwedenSwitzerlandSyriaTaiwanThailandTrinidad and TobagoTurkeyUgandaUkraineUruguayUzbekistanVenezuelaVietnamWest IndiesWestern AfricaWestern AsiaWestern EuropeYemenZaireZimbabweAzores
Immigrants from Bolivia
Race
Ancestry
AfghanAfricanAlaska NativeAlaskan AthabascanAlbanianAleutAlsatianAmericanApacheArabArapahoArgentineanArmenianAssyrian/Chaldean/SyriacAustralianAustrianBahamianBangladeshiBarbadianBasqueBelgianBelizeanBermudanBhutaneseBlackfeetBolivianBrazilianBritishBritish West IndianBulgarianBurmeseCajunCambodianCanadianCape VerdeanCarpatho RusynCelticCentral AmericanCentral American IndianCherokeeCheyenneChickasawChileanChineseChippewaChoctawColombianColvilleComancheCosta RicanCreeCreekCroatianCrowCubanCypriotCzechCzechoslovakianDanishDelawareDominicanDutchDutch West IndianEastern EuropeanEcuadorianEgyptianEnglishEstonianEthiopianEuropeanFijianFilipinoFinnishFrenchFrench American IndianFrench CanadianGermanGerman RussianGhanaianGreekGuamanian/ChamorroGuatemalanGuyaneseHaitianHmongHonduranHopiHoumaHungarianIcelanderIndian (Asian)IndonesianInupiatIranianIraqiIrishIroquoisIsraeliItalianJamaicanJapaneseJordanianKenyanKiowaKoreanLaotianLatvianLebaneseLiberianLithuanianLumbeeLuxembourgerMacedonianMalaysianMalteseMarshalleseMenomineeMexicanMexican American IndianMongolianMoroccanNative HawaiianNavajoNepaleseNew ZealanderNicaraguanNigerianNorthern EuropeanNorwegianOkinawanOsageOttawaPaiutePakistaniPalestinianPanamanianParaguayanPennsylvania GermanPeruvianPimaPolishPortuguesePotawatomiPuebloPuerto RicanPuget Sound SalishRomanianRussianSalvadoranSamoanScandinavianScotch-IrishScottishSeminoleSenegaleseSerbianShoshoneSierra LeoneanSiouxSlavicSlovakSloveneSomaliSouth AfricanSouth AmericanSouth American IndianSoviet UnionSpaniardSpanishSpanish AmericanSpanish American IndianSri LankanSubsaharan AfricanSudaneseSwedishSwissSyrianTaiwaneseThaiTlingit-HaidaTohono O'OdhamTonganTrinidadian and TobagonianTsimshianTurkishU.S. Virgin IslanderUgandanUkrainianUruguayanUteVenezuelanVietnameseWelshWest IndianYakamaYaquiYugoslavianYumanYup'ikZimbabwean
Immigration
NonimmigrantsImmigrantsAfghanistanAfricaAlbaniaArgentinaArmeniaAsiaAustraliaAustriaBahamasBangladeshBarbadosBelarusBelgiumBelizeBoliviaBosnia and HerzegovinaBrazilBulgariaBurma/MyanmarCabo VerdeCambodiaCameroonCanadaCaribbeanCentral AmericaChileChinaColombiaCongoCosta RicaCroatiaCubaCzechoslovakiaDenmarkDominicaDominican RepublicEastern AfricaEastern AsiaEastern EuropeEcuadorEgyptEl SalvadorEnglandEritreaEthiopiaEuropeFijiFranceGermanyGhanaGreeceGrenadaGuatemalaGuyanaHaitiHondurasHong KongHungaryIndiaIndonesiaIranIraqIrelandIsraelItalyJamaicaJapanJordanKazakhstanKenyaKoreaKuwaitLaosLatin AmericaLatviaLebanonLiberiaLithuaniaMalaysiaMexicoMicronesiaMiddle AfricaMoldovaMoroccoNepalNetherlandsNicaraguaNigeriaNorth AmericaNorth MacedoniaNorthern AfricaNorthern EuropeNorwayOceaniaPakistanPanamaPeruPhilippinesPolandPortugalRomaniaRussiaSaudi ArabiaScotlandSenegalSerbiaSierra LeoneSingaporeSomaliaSouth AfricaSouth AmericaSouth Central AsiaSouth Eastern AsiaSouthern EuropeSpainSt. Vincent and the GrenadinesSudanSwedenSwitzerlandSyriaTaiwanThailandTrinidad and TobagoTurkeyUgandaUkraineUruguayUzbekistanVenezuelaVietnamWest IndiesWestern AfricaWestern AsiaWestern EuropeYemenZaireZimbabweAzores
2 or more Vehicles in Household
Income
Poverty
Unemployment
Labor Participation
Family Structure
Vehicle Availability
Education Level
Disability

2 or more Vehicles in Household Comparison

Immigrants from Sri Lanka

Immigrants from Bolivia

Average
Exceptional
55.5%
2 OR MORE VEHICLES IN HOUSEHOLD
58.3/ 100
METRIC RATING
166th/ 347
METRIC RANK
57.6%
2 OR MORE VEHICLES IN HOUSEHOLD
98.2/ 100
METRIC RATING
102nd/ 347
METRIC RANK

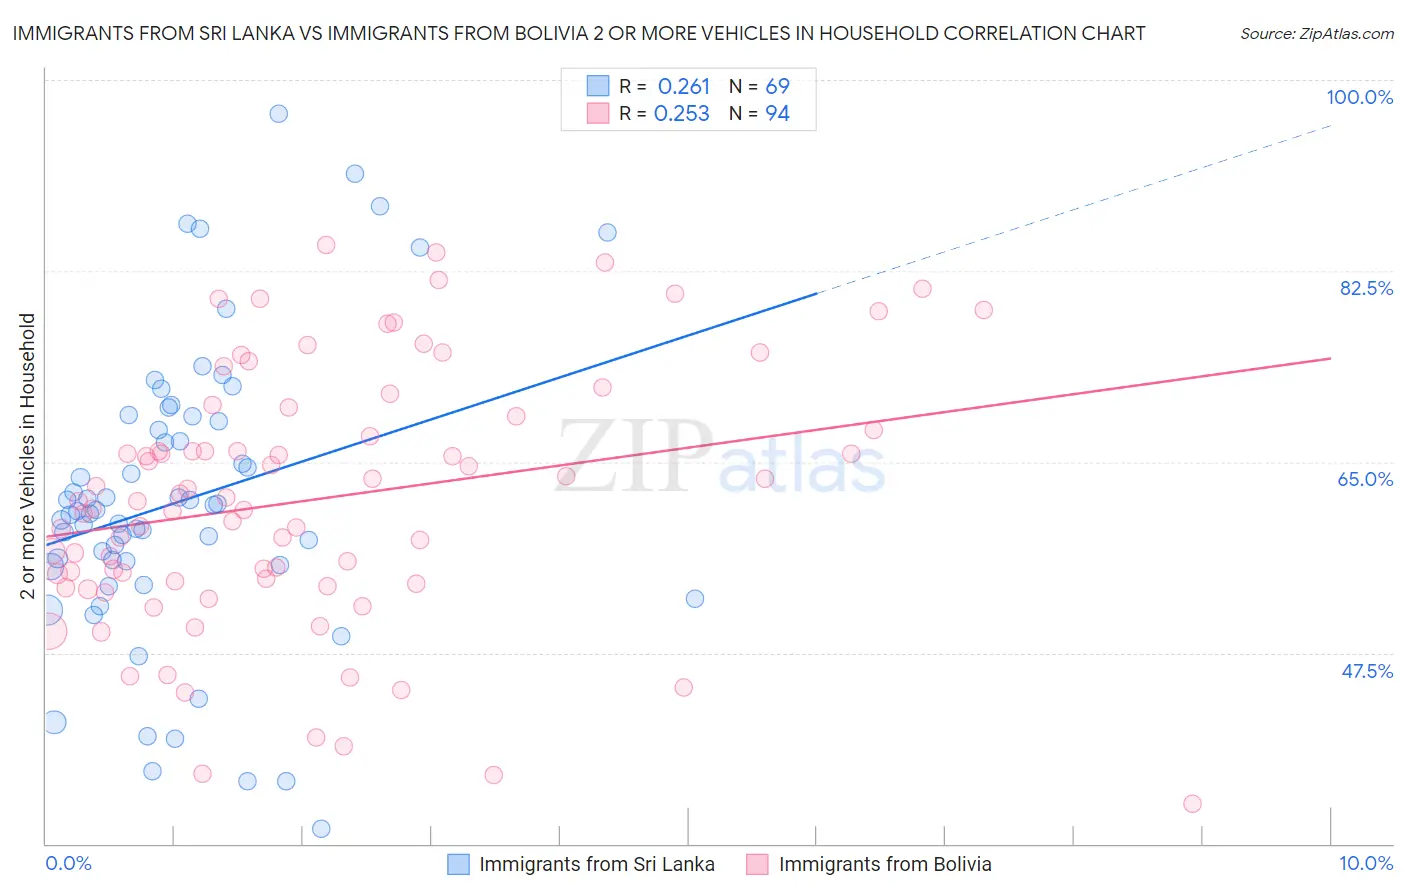
Immigrants from Sri Lanka vs Immigrants from Bolivia 2 or more Vehicles in Household Correlation Chart

The statistical analysis conducted on geographies consisting of 149,689,488 people shows a weak positive correlation between the proportion of Immigrants from Sri Lanka and percentage of households with 2 or more vehicles available in the United States with a correlation coefficient (R) of 0.261 and weighted average of 55.5%. Similarly, the statistical analysis conducted on geographies consisting of 158,713,360 people shows a weak positive correlation between the proportion of Immigrants from Bolivia and percentage of households with 2 or more vehicles available in the United States with a correlation coefficient (R) of 0.253 and weighted average of 57.6%, a difference of 3.6%.
Immigrants from Sri Lanka vs Immigrants from Bolivia 2 or more Vehicles in Household

2 or more Vehicles in Household Correlation Summary

MeasurementImmigrants from Sri LankaImmigrants from Bolivia
Minimum31.3%33.7%
Maximum96.9%84.8%
Range65.5%51.2%
Mean61.4%61.6%
Median60.5%61.4%
Interquartile 25% (IQ1)55.5%54.1%
Interquartile 75% (IQ3)69.0%69.1%
Interquartile Range (IQR)13.5%15.1%
Standard Deviation (Sample)13.5%11.8%
Standard Deviation (Population)13.4%11.7%

Similar Demographics by 2 or more Vehicles in Household

Demographics Similar to Immigrants from Sri Lanka by 2 or more Vehicles in Household

In terms of 2 or more vehicles in household, the demographic groups most similar to Immigrants from Sri Lanka are Kenyan (55.5%, a difference of 0.010%), Immigrants from El Salvador (55.6%, a difference of 0.040%), Dutch West Indian (55.6%, a difference of 0.060%), French American Indian (55.5%, a difference of 0.070%), and Immigrants from Zimbabwe (55.6%, a difference of 0.080%).
DemographicsRating | Rank2 or more Vehicles in Household
Paiute
68.0
/100
|
#159
Good
55.8%
Crow
67.0
/100
|
#160
Good
55.7%
Colville
61.1
/100
|
#161
Good
55.6%
German Russians
60.9
/100
|
#162
Good
55.6%
Immigrants | Zimbabwe
60.2
/100
|
#163
Good
55.6%
Dutch West Indians
59.8
/100
|
#164
Average
55.6%
Immigrants | El Salvador
59.4
/100
|
#165
Average
55.6%
Immigrants | Sri Lanka
58.3
/100
|
#166
Average
55.5%
Kenyans
58.1
/100
|
#167
Average
55.5%
French American Indians
56.7
/100
|
#168
Average
55.5%
Immigrants | Austria
56.3
/100
|
#169
Average
55.5%
Romanians
55.8
/100
|
#170
Average
55.5%
Immigrants | Costa Rica
54.4
/100
|
#171
Average
55.4%
Immigrants | Nicaragua
51.6
/100
|
#172
Average
55.4%
Immigrants | Western Europe
51.4
/100
|
#173
Average
55.4%

Demographics Similar to Immigrants from Bolivia by 2 or more Vehicles in Household

In terms of 2 or more vehicles in household, the demographic groups most similar to Immigrants from Bolivia are Jordanian (57.6%, a difference of 0.0%), Immigrants from Indonesia (57.6%, a difference of 0.0%), Immigrants from Korea (57.6%, a difference of 0.010%), Immigrants from Oceania (57.5%, a difference of 0.020%), and Immigrants from Netherlands (57.5%, a difference of 0.040%).
DemographicsRating | Rank2 or more Vehicles in Household
Hmong
98.9
/100
|
#95
Exceptional
57.8%
Burmese
98.8
/100
|
#96
Exceptional
57.8%
Slavs
98.8
/100
|
#97
Exceptional
57.8%
Palestinians
98.6
/100
|
#98
Exceptional
57.7%
Cajuns
98.5
/100
|
#99
Exceptional
57.7%
Fijians
98.4
/100
|
#100
Exceptional
57.6%
Lebanese
98.3
/100
|
#101
Exceptional
57.6%
Immigrants | Bolivia
98.2
/100
|
#102
Exceptional
57.6%
Jordanians
98.2
/100
|
#103
Exceptional
57.6%
Immigrants | Indonesia
98.2
/100
|
#104
Exceptional
57.6%
Immigrants | Korea
98.2
/100
|
#105
Exceptional
57.6%
Immigrants | Oceania
98.2
/100
|
#106
Exceptional
57.5%
Immigrants | Netherlands
98.2
/100
|
#107
Exceptional
57.5%
Immigrants | Canada
98.1
/100
|
#108
Exceptional
57.5%
Immigrants | North America
98.1
/100
|
#109
Exceptional
57.5%