Cities with the Most Immigrants from Southern Europe in Utah
RELATED REPORTS & OPTIONS
Southern Europe
Utah
Compare Cities
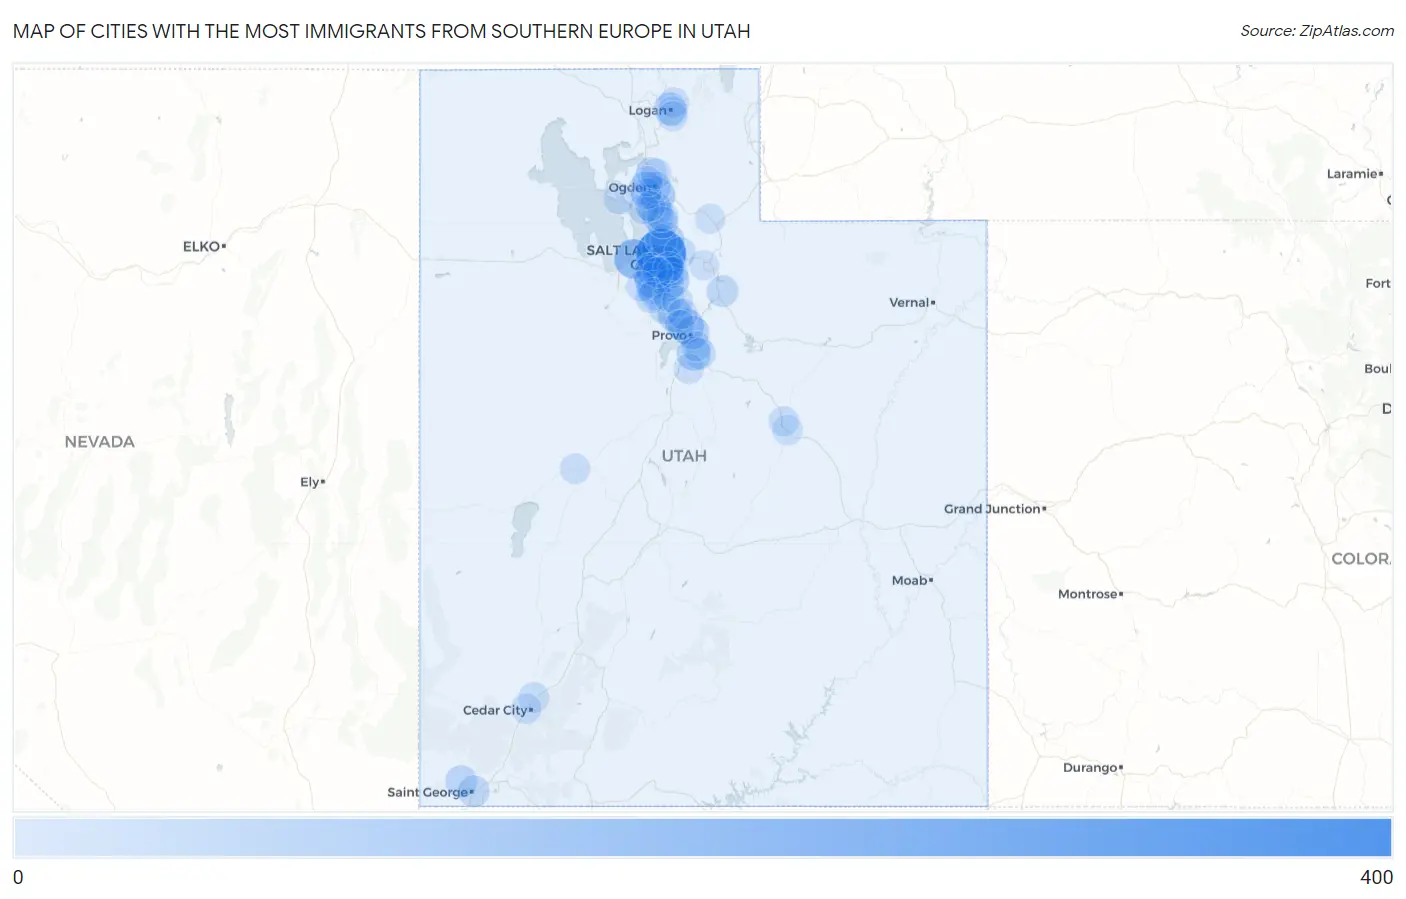
Map of Cities with the Most Immigrants from Southern Europe in Utah
0
400
Cities with the Most Immigrants from Southern Europe in Utah
| City | Southern Europe | vs State | vs National | |
| 1. | Salt Lake City | 381 | 2,555(14.91%)#1 | 728,588(0.05%)#244 |
| 2. | Magna | 173 | 2,555(6.77%)#2 | 728,588(0.02%)#627 |
| 3. | South Salt Lake | 168 | 2,555(6.58%)#3 | 728,588(0.02%)#647 |
| 4. | Murray | 136 | 2,555(5.32%)#4 | 728,588(0.02%)#795 |
| 5. | West Jordan | 109 | 2,555(4.27%)#5 | 728,588(0.01%)#956 |
| 6. | Orem | 100 | 2,555(3.91%)#6 | 728,588(0.01%)#1,036 |
| 7. | South Ogden | 98 | 2,555(3.84%)#7 | 728,588(0.01%)#1,060 |
| 8. | Layton | 79 | 2,555(3.09%)#8 | 728,588(0.01%)#1,255 |
| 9. | American Fork | 79 | 2,555(3.09%)#9 | 728,588(0.01%)#1,257 |
| 10. | West Haven | 79 | 2,555(3.09%)#10 | 728,588(0.01%)#1,259 |
| 11. | Kearns | 73 | 2,555(2.86%)#11 | 728,588(0.01%)#1,342 |
| 12. | Cottonwood Heights | 73 | 2,555(2.86%)#12 | 728,588(0.01%)#1,344 |
| 13. | Spanish Fork | 70 | 2,555(2.74%)#13 | 728,588(0.01%)#1,389 |
| 14. | South Jordan | 64 | 2,555(2.50%)#14 | 728,588(0.01%)#1,497 |
| 15. | Bountiful | 62 | 2,555(2.43%)#15 | 728,588(0.01%)#1,538 |
| 16. | Provo | 61 | 2,555(2.39%)#16 | 728,588(0.01%)#1,550 |
| 17. | Logan | 45 | 2,555(1.76%)#17 | 728,588(0.01%)#1,924 |
| 18. | Ivins | 38 | 2,555(1.49%)#18 | 728,588(0.01%)#2,141 |
| 19. | Kaysville | 37 | 2,555(1.45%)#19 | 728,588(0.01%)#2,171 |
| 20. | West Valley City | 35 | 2,555(1.37%)#20 | 728,588(0.00%)#2,245 |
| 21. | Ogden | 33 | 2,555(1.29%)#21 | 728,588(0.00%)#2,325 |
| 22. | Riverton | 31 | 2,555(1.21%)#22 | 728,588(0.00%)#2,399 |
| 23. | Woods Cross | 30 | 2,555(1.17%)#23 | 728,588(0.00%)#2,451 |
| 24. | St George | 29 | 2,555(1.14%)#24 | 728,588(0.00%)#2,474 |
| 25. | Farmington | 29 | 2,555(1.14%)#25 | 728,588(0.00%)#2,484 |
| 26. | Heber | 29 | 2,555(1.14%)#26 | 728,588(0.00%)#2,495 |
| 27. | Sandy | 27 | 2,555(1.06%)#27 | 728,588(0.00%)#2,574 |
| 28. | Lehi | 24 | 2,555(0.94%)#28 | 728,588(0.00%)#2,718 |
| 29. | Herriman | 23 | 2,555(0.90%)#29 | 728,588(0.00%)#2,778 |
| 30. | Fruit Heights | 23 | 2,555(0.90%)#30 | 728,588(0.00%)#2,815 |
| 31. | Emigration Canyon | 22 | 2,555(0.86%)#31 | 728,588(0.00%)#2,901 |
| 32. | Draper | 21 | 2,555(0.82%)#32 | 728,588(0.00%)#2,915 |
| 33. | Mapleton | 19 | 2,555(0.74%)#33 | 728,588(0.00%)#3,072 |
| 34. | Holladay | 16 | 2,555(0.63%)#34 | 728,588(0.00%)#3,295 |
| 35. | Hooper | 15 | 2,555(0.59%)#35 | 728,588(0.00%)#3,416 |
| 36. | Enoch | 15 | 2,555(0.59%)#36 | 728,588(0.00%)#3,426 |
| 37. | Millcreek | 14 | 2,555(0.55%)#37 | 728,588(0.00%)#3,480 |
| 38. | Pleasant View | 14 | 2,555(0.55%)#38 | 728,588(0.00%)#3,507 |
| 39. | Alpine | 14 | 2,555(0.55%)#39 | 728,588(0.00%)#3,508 |
| 40. | Roy | 12 | 2,555(0.47%)#40 | 728,588(0.00%)#3,667 |
| 41. | Syracuse | 12 | 2,555(0.47%)#41 | 728,588(0.00%)#3,670 |
| 42. | North Ogden | 10 | 2,555(0.39%)#42 | 728,588(0.00%)#3,916 |
| 43. | Cedar City | 8 | 2,555(0.31%)#43 | 728,588(0.00%)#4,212 |
| 44. | Taylorsville | 7 | 2,555(0.27%)#44 | 728,588(0.00%)#4,345 |
| 45. | Price | 7 | 2,555(0.27%)#45 | 728,588(0.00%)#4,381 |
| 46. | Elk Ridge | 7 | 2,555(0.27%)#46 | 728,588(0.00%)#4,407 |
| 47. | Pleasant Grove | 6 | 2,555(0.23%)#47 | 728,588(0.00%)#4,482 |
| 48. | Springville | 6 | 2,555(0.23%)#48 | 728,588(0.00%)#4,484 |
| 49. | North Logan | 6 | 2,555(0.23%)#49 | 728,588(0.00%)#4,512 |
| 50. | Copperton | 6 | 2,555(0.23%)#50 | 728,588(0.00%)#4,591 |
| 51. | Hinckley | 6 | 2,555(0.23%)#51 | 728,588(0.00%)#4,602 |
| 52. | Spring Glen | 5 | 2,555(0.20%)#52 | 728,588(0.00%)#4,740 |
| 53. | Clearfield | 4 | 2,555(0.16%)#53 | 728,588(0.00%)#4,772 |
| 54. | Marriott Slaterville | 4 | 2,555(0.16%)#54 | 728,588(0.00%)#4,835 |
| 55. | River Heights | 3 | 2,555(0.12%)#55 | 728,588(0.00%)#4,954 |
| 56. | Millville | 3 | 2,555(0.12%)#56 | 728,588(0.00%)#4,964 |
| 57. | Vineyard | 2 | 2,555(0.08%)#57 | 728,588(0.00%)#5,061 |
| 58. | Snyderville | 2 | 2,555(0.08%)#58 | 728,588(0.00%)#5,072 |
| 59. | Henefer | 2 | 2,555(0.08%)#59 | 728,588(0.00%)#5,148 |
Common Questions
What are the Top 10 Cities with the Most Immigrants from Southern Europe in Utah?
Top 10 Cities with the Most Immigrants from Southern Europe in Utah are:
#1
381
#2
173
#3
168
#4
136
#5
109
#6
100
#7
98
#8
79
#9
79
#10
79
What city has the Most Immigrants from Southern Europe in Utah?
Salt Lake City has the Most Immigrants from Southern Europe in Utah with 381.
What is the Total Immigrants from Southern Europe in the State of Utah?
Total Immigrants from Southern Europe in Utah is 2,555.
What is the Total Immigrants from Southern Europe in the United States?
Total Immigrants from Southern Europe in the United States is 728,588.