Cities with the Most Immigrants from Southern Europe in Texas
RELATED REPORTS & OPTIONS
Southern Europe
Texas
Compare Cities
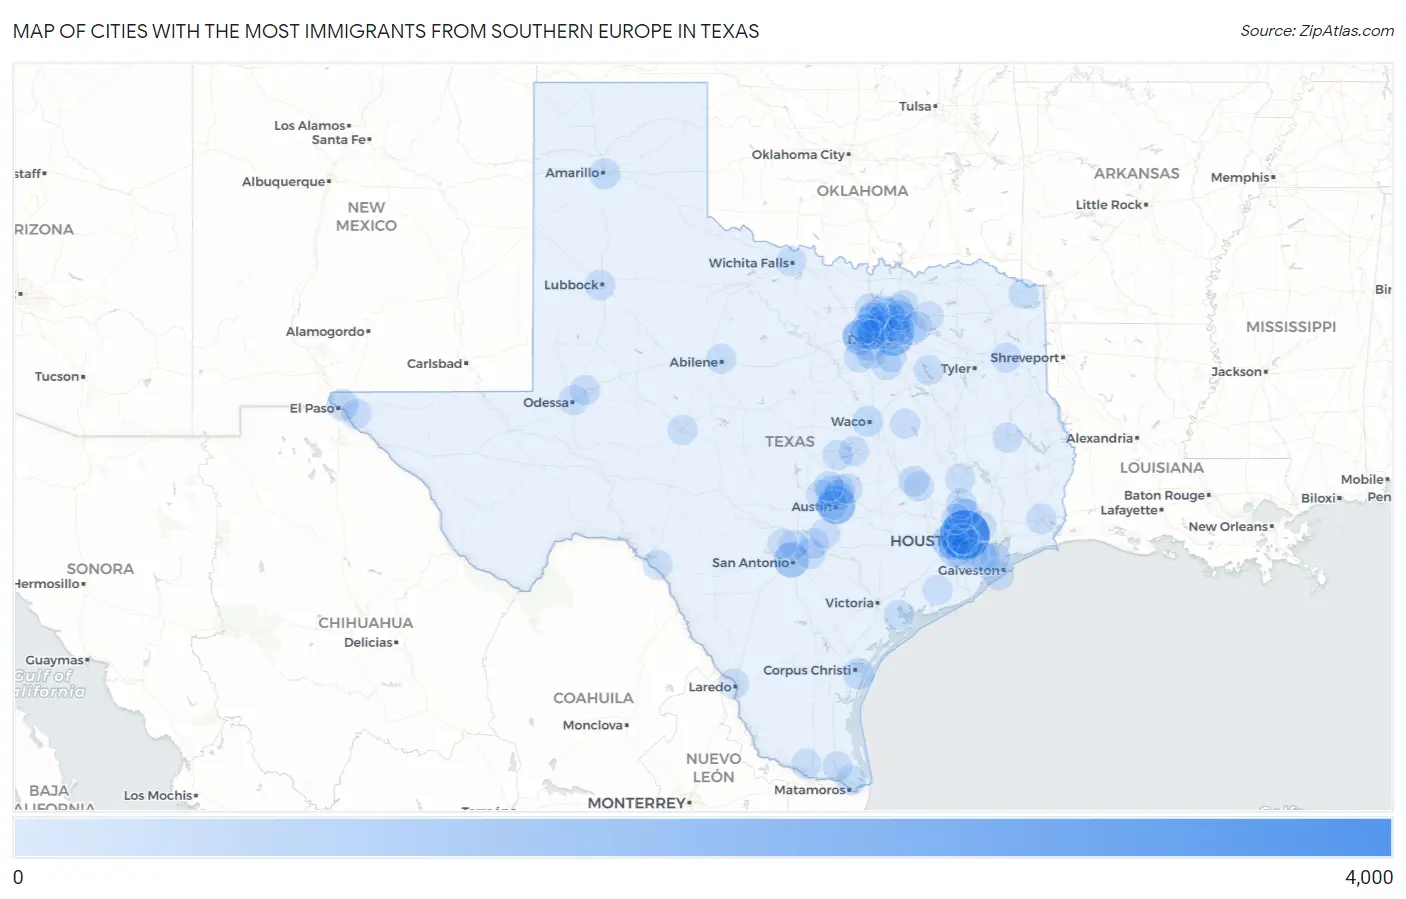
Map of Cities with the Most Immigrants from Southern Europe in Texas
0
4,000
Cities with the Most Immigrants from Southern Europe in Texas
| City | Southern Europe | vs State | vs National | |
| 1. | Houston | 3,744 | 22,897(16.35%)#1 | 728,588(0.51%)#13 |
| 2. | Dallas | 1,700 | 22,897(7.42%)#2 | 728,588(0.23%)#29 |
| 3. | Austin | 1,602 | 22,897(7.00%)#3 | 728,588(0.22%)#34 |
| 4. | San Antonio | 971 | 22,897(4.24%)#4 | 728,588(0.13%)#68 |
| 5. | Fort Worth | 849 | 22,897(3.71%)#5 | 728,588(0.12%)#77 |
| 6. | Cinco Ranch | 714 | 22,897(3.12%)#6 | 728,588(0.10%)#100 |
| 7. | Sugar Land | 418 | 22,897(1.83%)#7 | 728,588(0.06%)#214 |
| 8. | Frisco | 363 | 22,897(1.59%)#8 | 728,588(0.05%)#262 |
| 9. | The Woodlands | 341 | 22,897(1.49%)#9 | 728,588(0.05%)#280 |
| 10. | El Paso | 333 | 22,897(1.45%)#10 | 728,588(0.05%)#291 |
| 11. | Arlington | 328 | 22,897(1.43%)#11 | 728,588(0.05%)#295 |
| 12. | Little Elm | 303 | 22,897(1.32%)#12 | 728,588(0.04%)#322 |
| 13. | Cedar Park | 277 | 22,897(1.21%)#13 | 728,588(0.04%)#364 |
| 14. | Corpus Christi | 258 | 22,897(1.13%)#14 | 728,588(0.04%)#399 |
| 15. | Irving | 247 | 22,897(1.08%)#15 | 728,588(0.03%)#418 |
| 16. | Plano | 233 | 22,897(1.02%)#16 | 728,588(0.03%)#453 |
| 17. | Mckinney | 209 | 22,897(0.91%)#17 | 728,588(0.03%)#514 |
| 18. | Richardson | 203 | 22,897(0.89%)#18 | 728,588(0.03%)#533 |
| 19. | Waco | 195 | 22,897(0.85%)#19 | 728,588(0.03%)#559 |
| 20. | Missouri City | 193 | 22,897(0.84%)#20 | 728,588(0.03%)#567 |
| 21. | Lewisville | 186 | 22,897(0.81%)#21 | 728,588(0.03%)#587 |
| 22. | Jersey Village | 169 | 22,897(0.74%)#22 | 728,588(0.02%)#644 |
| 23. | Amarillo | 165 | 22,897(0.72%)#23 | 728,588(0.02%)#656 |
| 24. | Denton | 143 | 22,897(0.62%)#24 | 728,588(0.02%)#758 |
| 25. | Grapevine | 134 | 22,897(0.59%)#25 | 728,588(0.02%)#807 |
| 26. | Galveston | 126 | 22,897(0.55%)#26 | 728,588(0.02%)#845 |
| 27. | Southlake | 114 | 22,897(0.50%)#27 | 728,588(0.02%)#923 |
| 28. | Mission Bend | 113 | 22,897(0.49%)#28 | 728,588(0.02%)#929 |
| 29. | Rockwall | 109 | 22,897(0.48%)#29 | 728,588(0.01%)#960 |
| 30. | Bryan | 106 | 22,897(0.46%)#30 | 728,588(0.01%)#984 |
| 31. | Cibolo | 102 | 22,897(0.45%)#31 | 728,588(0.01%)#1,019 |
| 32. | Round Rock | 100 | 22,897(0.44%)#32 | 728,588(0.01%)#1,035 |
| 33. | Coppell | 99 | 22,897(0.43%)#33 | 728,588(0.01%)#1,047 |
| 34. | Wells Branch | 99 | 22,897(0.43%)#34 | 728,588(0.01%)#1,053 |
| 35. | Farmers Branch | 93 | 22,897(0.41%)#35 | 728,588(0.01%)#1,113 |
| 36. | Carrollton | 92 | 22,897(0.40%)#36 | 728,588(0.01%)#1,122 |
| 37. | New Braunfels | 92 | 22,897(0.40%)#37 | 728,588(0.01%)#1,123 |
| 38. | Flower Mound | 92 | 22,897(0.40%)#38 | 728,588(0.01%)#1,127 |
| 39. | University Park | 91 | 22,897(0.40%)#39 | 728,588(0.01%)#1,137 |
| 40. | Lago Vista | 85 | 22,897(0.37%)#40 | 728,588(0.01%)#1,190 |
| 41. | Beaumont | 84 | 22,897(0.37%)#41 | 728,588(0.01%)#1,197 |
| 42. | Lucas | 83 | 22,897(0.36%)#42 | 728,588(0.01%)#1,219 |
| 43. | The Colony | 77 | 22,897(0.34%)#43 | 728,588(0.01%)#1,279 |
| 44. | West Lake Hills | 77 | 22,897(0.34%)#44 | 728,588(0.01%)#1,290 |
| 45. | College Station | 73 | 22,897(0.32%)#45 | 728,588(0.01%)#1,339 |
| 46. | Friendswood | 72 | 22,897(0.31%)#46 | 728,588(0.01%)#1,358 |
| 47. | Horizon City | 68 | 22,897(0.30%)#47 | 728,588(0.01%)#1,424 |
| 48. | Lubbock | 67 | 22,897(0.29%)#48 | 728,588(0.01%)#1,434 |
| 49. | Odessa | 64 | 22,897(0.28%)#49 | 728,588(0.01%)#1,495 |
| 50. | Waxahachie | 64 | 22,897(0.28%)#50 | 728,588(0.01%)#1,499 |
| 51. | Fairview | 64 | 22,897(0.28%)#51 | 728,588(0.01%)#1,509 |
| 52. | Laredo | 63 | 22,897(0.28%)#52 | 728,588(0.01%)#1,512 |
| 53. | Timberwood Park | 61 | 22,897(0.27%)#53 | 728,588(0.01%)#1,554 |
| 54. | Corinth | 59 | 22,897(0.26%)#54 | 728,588(0.01%)#1,590 |
| 55. | Conroe | 58 | 22,897(0.25%)#55 | 728,588(0.01%)#1,603 |
| 56. | Garland | 57 | 22,897(0.25%)#56 | 728,588(0.01%)#1,615 |
| 57. | Wichita Falls | 57 | 22,897(0.25%)#57 | 728,588(0.01%)#1,616 |
| 58. | Hutto | 56 | 22,897(0.24%)#58 | 728,588(0.01%)#1,636 |
| 59. | Sienna | 56 | 22,897(0.24%)#59 | 728,588(0.01%)#1,638 |
| 60. | Mansfield | 55 | 22,897(0.24%)#60 | 728,588(0.01%)#1,660 |
| 61. | Saginaw | 55 | 22,897(0.24%)#61 | 728,588(0.01%)#1,666 |
| 62. | New Boston | 55 | 22,897(0.24%)#62 | 728,588(0.01%)#1,676 |
| 63. | Killeen | 54 | 22,897(0.24%)#63 | 728,588(0.01%)#1,683 |
| 64. | Euless | 54 | 22,897(0.24%)#64 | 728,588(0.01%)#1,685 |
| 65. | Abilene | 51 | 22,897(0.22%)#65 | 728,588(0.01%)#1,759 |
| 66. | Gun Barrel City | 48 | 22,897(0.21%)#66 | 728,588(0.01%)#1,851 |
| 67. | Temple | 42 | 22,897(0.18%)#67 | 728,588(0.01%)#2,004 |
| 68. | Longview | 42 | 22,897(0.18%)#68 | 728,588(0.01%)#2,005 |
| 69. | Atascocita | 40 | 22,897(0.17%)#69 | 728,588(0.01%)#2,058 |
| 70. | Port Lavaca | 40 | 22,897(0.17%)#70 | 728,588(0.01%)#2,069 |
| 71. | Brownsville | 39 | 22,897(0.17%)#71 | 728,588(0.01%)#2,087 |
| 72. | San Marcos | 39 | 22,897(0.17%)#72 | 728,588(0.01%)#2,090 |
| 73. | Leander | 39 | 22,897(0.17%)#73 | 728,588(0.01%)#2,091 |
| 74. | Combes | 39 | 22,897(0.17%)#74 | 728,588(0.01%)#2,116 |
| 75. | Melissa | 38 | 22,897(0.17%)#75 | 728,588(0.01%)#2,133 |
| 76. | Midland | 37 | 22,897(0.16%)#76 | 728,588(0.01%)#2,162 |
| 77. | Del Rio | 37 | 22,897(0.16%)#77 | 728,588(0.01%)#2,170 |
| 78. | West University Place | 37 | 22,897(0.16%)#78 | 728,588(0.01%)#2,184 |
| 79. | Pearland | 36 | 22,897(0.16%)#79 | 728,588(0.00%)#2,202 |
| 80. | Hunters Creek Village | 35 | 22,897(0.15%)#80 | 728,588(0.00%)#2,283 |
| 81. | Oak Ridge North | 35 | 22,897(0.15%)#81 | 728,588(0.00%)#2,288 |
| 82. | Hedwig Village | 35 | 22,897(0.15%)#82 | 728,588(0.00%)#2,291 |
| 83. | Groesbeck | 34 | 22,897(0.15%)#83 | 728,588(0.00%)#2,319 |
| 84. | Copper Canyon | 34 | 22,897(0.15%)#84 | 728,588(0.00%)#2,323 |
| 85. | San Leon | 33 | 22,897(0.14%)#85 | 728,588(0.00%)#2,346 |
| 86. | Burleson | 32 | 22,897(0.14%)#86 | 728,588(0.00%)#2,363 |
| 87. | Lufkin | 32 | 22,897(0.14%)#87 | 728,588(0.00%)#2,369 |
| 88. | Mcallen | 31 | 22,897(0.14%)#88 | 728,588(0.00%)#2,396 |
| 89. | North Richland Hills | 30 | 22,897(0.13%)#89 | 728,588(0.00%)#2,433 |
| 90. | Bedford | 30 | 22,897(0.13%)#90 | 728,588(0.00%)#2,435 |
| 91. | Huntsville | 30 | 22,897(0.13%)#91 | 728,588(0.00%)#2,436 |
| 92. | Greenville | 30 | 22,897(0.13%)#92 | 728,588(0.00%)#2,438 |
| 93. | League City | 29 | 22,897(0.13%)#93 | 728,588(0.00%)#2,472 |
| 94. | Bay City | 29 | 22,897(0.13%)#94 | 728,588(0.00%)#2,492 |
| 95. | Royse City | 28 | 22,897(0.12%)#95 | 728,588(0.00%)#2,544 |
| 96. | Scenic Oaks | 28 | 22,897(0.12%)#96 | 728,588(0.00%)#2,553 |
| 97. | Keller | 27 | 22,897(0.12%)#97 | 728,588(0.00%)#2,576 |
| 98. | Red Oak | 27 | 22,897(0.12%)#98 | 728,588(0.00%)#2,593 |
| 99. | Tomball | 27 | 22,897(0.12%)#99 | 728,588(0.00%)#2,596 |
| 100. | San Angelo | 26 | 22,897(0.11%)#100 | 728,588(0.00%)#2,624 |
Common Questions
What are the Top 10 Cities with the Most Immigrants from Southern Europe in Texas?
Top 10 Cities with the Most Immigrants from Southern Europe in Texas are:
#1
3,744
#2
1,700
#3
1,602
#4
971
#5
849
#6
714
#7
418
#8
363
#9
341
#10
333
What city has the Most Immigrants from Southern Europe in Texas?
Houston has the Most Immigrants from Southern Europe in Texas with 3,744.
What is the Total Immigrants from Southern Europe in the State of Texas?
Total Immigrants from Southern Europe in Texas is 22,897.
What is the Total Immigrants from Southern Europe in the United States?
Total Immigrants from Southern Europe in the United States is 728,588.