Cities with the Most Immigrants from Southern Europe in Ohio
RELATED REPORTS & OPTIONS
Southern Europe
Ohio
Compare Cities
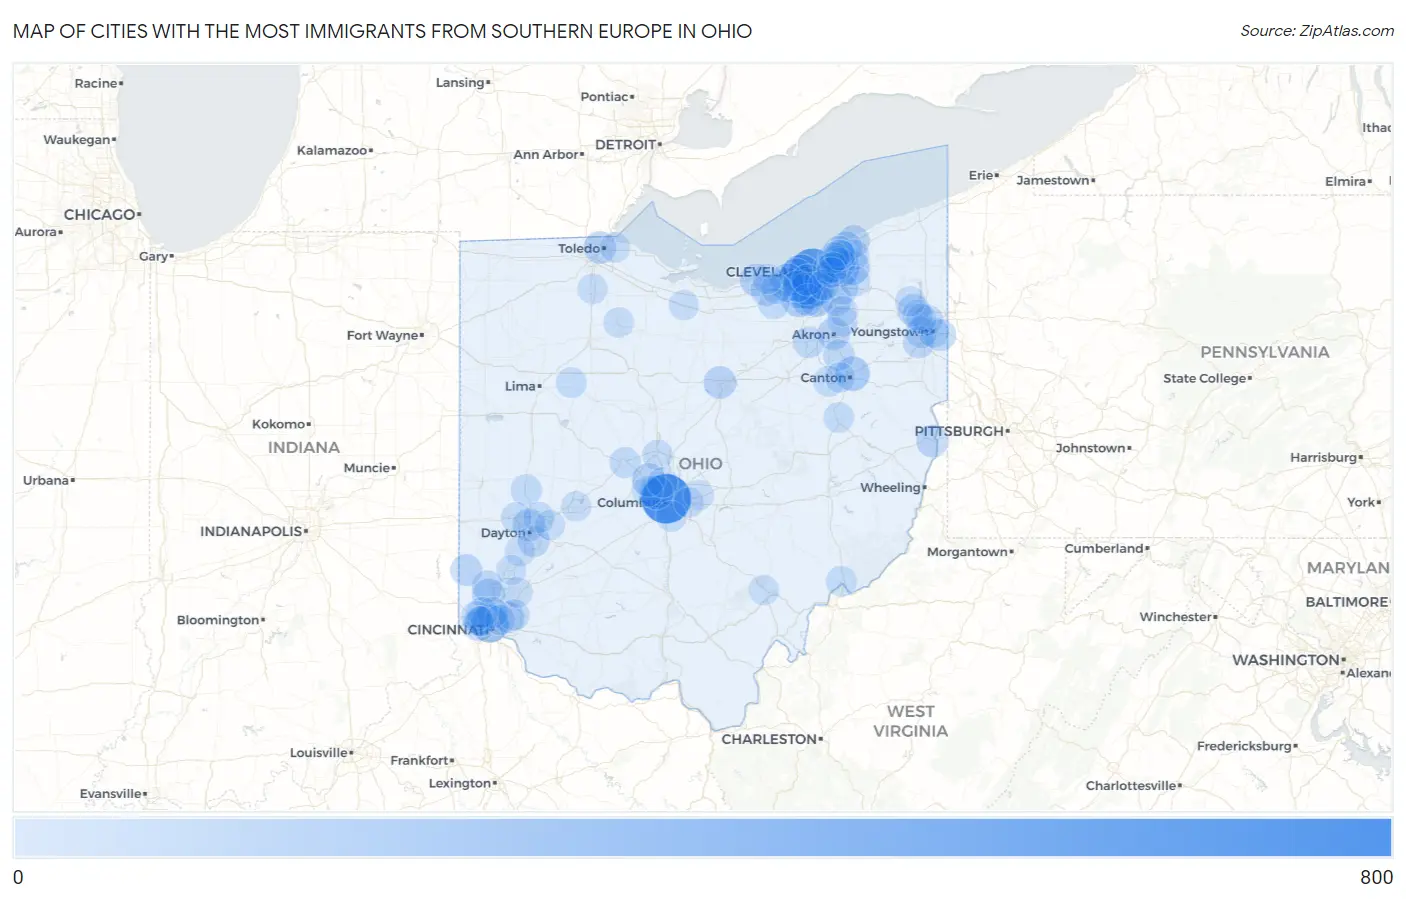
Map of Cities with the Most Immigrants from Southern Europe in Ohio
0
800
Cities with the Most Immigrants from Southern Europe in Ohio
| City | Southern Europe | vs State | vs National | |
| 1. | Columbus | 744 | 11,332(6.57%)#1 | 728,588(0.10%)#94 |
| 2. | Cleveland | 591 | 11,332(5.22%)#2 | 728,588(0.08%)#127 |
| 3. | Parma | 381 | 11,332(3.36%)#3 | 728,588(0.05%)#246 |
| 4. | Lakewood | 323 | 11,332(2.85%)#4 | 728,588(0.04%)#300 |
| 5. | Cincinnati | 296 | 11,332(2.61%)#5 | 728,588(0.04%)#330 |
| 6. | Mayfield Heights | 216 | 11,332(1.91%)#6 | 728,588(0.03%)#499 |
| 7. | Chesterland | 179 | 11,332(1.58%)#7 | 728,588(0.02%)#606 |
| 8. | Canton | 176 | 11,332(1.55%)#8 | 728,588(0.02%)#617 |
| 9. | Middleburg Heights | 167 | 11,332(1.47%)#9 | 728,588(0.02%)#652 |
| 10. | Strongsville | 163 | 11,332(1.44%)#10 | 728,588(0.02%)#672 |
| 11. | Upper Arlington | 162 | 11,332(1.43%)#11 | 728,588(0.02%)#675 |
| 12. | Seven Hills | 155 | 11,332(1.37%)#12 | 728,588(0.02%)#703 |
| 13. | Broadview Heights | 146 | 11,332(1.29%)#13 | 728,588(0.02%)#741 |
| 14. | North Olmsted | 144 | 11,332(1.27%)#14 | 728,588(0.02%)#755 |
| 15. | Dublin | 140 | 11,332(1.24%)#15 | 728,588(0.02%)#776 |
| 16. | Rocky River | 130 | 11,332(1.15%)#16 | 728,588(0.02%)#828 |
| 17. | Fairfield | 123 | 11,332(1.09%)#17 | 728,588(0.02%)#860 |
| 18. | Westlake | 120 | 11,332(1.06%)#18 | 728,588(0.02%)#878 |
| 19. | Lorain | 117 | 11,332(1.03%)#19 | 728,588(0.02%)#902 |
| 20. | Dayton | 105 | 11,332(0.93%)#20 | 728,588(0.01%)#991 |
| 21. | Akron | 103 | 11,332(0.91%)#21 | 728,588(0.01%)#1,010 |
| 22. | Mansfield | 102 | 11,332(0.90%)#22 | 728,588(0.01%)#1,018 |
| 23. | Toledo | 98 | 11,332(0.86%)#23 | 728,588(0.01%)#1,056 |
| 24. | Parma Heights | 97 | 11,332(0.86%)#24 | 728,588(0.01%)#1,069 |
| 25. | Mentor | 95 | 11,332(0.84%)#25 | 728,588(0.01%)#1,089 |
| 26. | Steubenville | 95 | 11,332(0.84%)#26 | 728,588(0.01%)#1,094 |
| 27. | Warren | 91 | 11,332(0.80%)#27 | 728,588(0.01%)#1,135 |
| 28. | North Royalton | 89 | 11,332(0.79%)#28 | 728,588(0.01%)#1,149 |
| 29. | Willoughby | 85 | 11,332(0.75%)#29 | 728,588(0.01%)#1,186 |
| 30. | Covedale | 82 | 11,332(0.72%)#30 | 728,588(0.01%)#1,233 |
| 31. | Campbell | 81 | 11,332(0.71%)#31 | 728,588(0.01%)#1,245 |
| 32. | Kettering | 78 | 11,332(0.69%)#32 | 728,588(0.01%)#1,265 |
| 33. | Elyria | 73 | 11,332(0.64%)#33 | 728,588(0.01%)#1,341 |
| 34. | Oxford | 72 | 11,332(0.64%)#34 | 728,588(0.01%)#1,362 |
| 35. | Canfield | 70 | 11,332(0.62%)#35 | 728,588(0.01%)#1,400 |
| 36. | Oakwood Village Cuyahoga County | 70 | 11,332(0.62%)#36 | 728,588(0.01%)#1,403 |
| 37. | Hamilton | 67 | 11,332(0.59%)#37 | 728,588(0.01%)#1,435 |
| 38. | Wadsworth | 67 | 11,332(0.59%)#38 | 728,588(0.01%)#1,440 |
| 39. | Willoughby Hills | 67 | 11,332(0.59%)#39 | 728,588(0.01%)#1,445 |
| 40. | Austintown | 66 | 11,332(0.58%)#40 | 728,588(0.01%)#1,461 |
| 41. | Green | 65 | 11,332(0.57%)#41 | 728,588(0.01%)#1,484 |
| 42. | Brook Park | 65 | 11,332(0.57%)#42 | 728,588(0.01%)#1,486 |
| 43. | Madeira | 63 | 11,332(0.56%)#43 | 728,588(0.01%)#1,526 |
| 44. | Lyndhurst | 59 | 11,332(0.52%)#44 | 728,588(0.01%)#1,592 |
| 45. | Brooklyn | 58 | 11,332(0.51%)#45 | 728,588(0.01%)#1,612 |
| 46. | Macedonia | 57 | 11,332(0.50%)#46 | 728,588(0.01%)#1,624 |
| 47. | Solon | 56 | 11,332(0.49%)#47 | 728,588(0.01%)#1,637 |
| 48. | The Village Of Indian Hill | 56 | 11,332(0.49%)#48 | 728,588(0.01%)#1,652 |
| 49. | Kirtland | 55 | 11,332(0.49%)#49 | 728,588(0.01%)#1,674 |
| 50. | Finneytown | 54 | 11,332(0.48%)#50 | 728,588(0.01%)#1,697 |
| 51. | Highland Heights | 54 | 11,332(0.48%)#51 | 728,588(0.01%)#1,699 |
| 52. | Troy | 52 | 11,332(0.46%)#52 | 728,588(0.01%)#1,738 |
| 53. | Richmond Heights | 52 | 11,332(0.46%)#53 | 728,588(0.01%)#1,746 |
| 54. | Marysville | 51 | 11,332(0.45%)#54 | 728,588(0.01%)#1,764 |
| 55. | Massillon | 47 | 11,332(0.41%)#55 | 728,588(0.01%)#1,867 |
| 56. | Grafton | 47 | 11,332(0.41%)#56 | 728,588(0.01%)#1,884 |
| 57. | Cleveland Heights | 46 | 11,332(0.41%)#57 | 728,588(0.01%)#1,897 |
| 58. | White Oak | 46 | 11,332(0.41%)#58 | 728,588(0.01%)#1,902 |
| 59. | Girard | 46 | 11,332(0.41%)#59 | 728,588(0.01%)#1,910 |
| 60. | Willowick | 45 | 11,332(0.40%)#60 | 728,588(0.01%)#1,937 |
| 61. | Huber Heights | 44 | 11,332(0.39%)#61 | 728,588(0.01%)#1,955 |
| 62. | Obetz | 40 | 11,332(0.35%)#62 | 728,588(0.01%)#2,079 |
| 63. | Hilliard | 38 | 11,332(0.34%)#63 | 728,588(0.01%)#2,125 |
| 64. | Garfield Heights | 38 | 11,332(0.34%)#64 | 728,588(0.01%)#2,126 |
| 65. | Dover | 38 | 11,332(0.34%)#65 | 728,588(0.01%)#2,136 |
| 66. | Euclid | 37 | 11,332(0.33%)#66 | 728,588(0.01%)#2,165 |
| 67. | North Ridgeville | 37 | 11,332(0.33%)#67 | 728,588(0.01%)#2,169 |
| 68. | Youngstown | 35 | 11,332(0.31%)#68 | 728,588(0.00%)#2,247 |
| 69. | South Euclid | 35 | 11,332(0.31%)#69 | 728,588(0.00%)#2,257 |
| 70. | Marietta | 35 | 11,332(0.31%)#70 | 728,588(0.00%)#2,264 |
| 71. | Englewood | 33 | 11,332(0.29%)#71 | 728,588(0.00%)#2,336 |
| 72. | Wickliffe | 33 | 11,332(0.29%)#72 | 728,588(0.00%)#2,337 |
| 73. | Ada | 33 | 11,332(0.29%)#73 | 728,588(0.00%)#2,347 |
| 74. | Stow | 32 | 11,332(0.28%)#74 | 728,588(0.00%)#2,367 |
| 75. | Delaware | 31 | 11,332(0.27%)#75 | 728,588(0.00%)#2,403 |
| 76. | Bolindale | 31 | 11,332(0.27%)#76 | 728,588(0.00%)#2,426 |
| 77. | Perry Heights | 28 | 11,332(0.25%)#77 | 728,588(0.00%)#2,556 |
| 78. | South Russell | 28 | 11,332(0.25%)#78 | 728,588(0.00%)#2,563 |
| 79. | Mason | 27 | 11,332(0.24%)#79 | 728,588(0.00%)#2,577 |
| 80. | Worthington | 27 | 11,332(0.24%)#80 | 728,588(0.00%)#2,592 |
| 81. | Fostoria | 27 | 11,332(0.24%)#81 | 728,588(0.00%)#2,595 |
| 82. | Springfield | 26 | 11,332(0.23%)#82 | 728,588(0.00%)#2,626 |
| 83. | Niles | 26 | 11,332(0.23%)#83 | 728,588(0.00%)#2,639 |
| 84. | Pataskala | 26 | 11,332(0.23%)#84 | 728,588(0.00%)#2,640 |
| 85. | Dent | 25 | 11,332(0.22%)#85 | 728,588(0.00%)#2,681 |
| 86. | Champion Heights | 25 | 11,332(0.22%)#86 | 728,588(0.00%)#2,694 |
| 87. | Reynoldsburg | 24 | 11,332(0.21%)#87 | 728,588(0.00%)#2,723 |
| 88. | Hudson | 24 | 11,332(0.21%)#88 | 728,588(0.00%)#2,729 |
| 89. | Miamisburg | 24 | 11,332(0.21%)#89 | 728,588(0.00%)#2,731 |
| 90. | Norwood | 23 | 11,332(0.20%)#90 | 728,588(0.00%)#2,796 |
| 91. | University Heights | 23 | 11,332(0.20%)#91 | 728,588(0.00%)#2,801 |
| 92. | Bowling Green | 22 | 11,332(0.19%)#92 | 728,588(0.00%)#2,844 |
| 93. | Oregon | 22 | 11,332(0.19%)#93 | 728,588(0.00%)#2,855 |
| 94. | Bellevue | 22 | 11,332(0.19%)#94 | 728,588(0.00%)#2,875 |
| 95. | Sheffield | 22 | 11,332(0.19%)#95 | 728,588(0.00%)#2,890 |
| 96. | The Plains | 22 | 11,332(0.19%)#96 | 728,588(0.00%)#2,896 |
| 97. | Cheviot | 21 | 11,332(0.19%)#97 | 728,588(0.00%)#2,942 |
| 98. | Middletown | 20 | 11,332(0.18%)#98 | 728,588(0.00%)#2,973 |
| 99. | Bridgetown | 20 | 11,332(0.18%)#99 | 728,588(0.00%)#2,996 |
| 100. | Fairborn | 19 | 11,332(0.17%)#100 | 728,588(0.00%)#3,049 |
Common Questions
What are the Top 10 Cities with the Most Immigrants from Southern Europe in Ohio?
Top 10 Cities with the Most Immigrants from Southern Europe in Ohio are:
#1
744
#2
591
#3
381
#4
323
#5
296
#6
216
#7
179
#8
176
#9
167
#10
163
What city has the Most Immigrants from Southern Europe in Ohio?
Columbus has the Most Immigrants from Southern Europe in Ohio with 744.
What is the Total Immigrants from Southern Europe in the State of Ohio?
Total Immigrants from Southern Europe in Ohio is 11,332.
What is the Total Immigrants from Southern Europe in the United States?
Total Immigrants from Southern Europe in the United States is 728,588.