Cities with the Most Immigrants from Southern Europe in New Jersey
RELATED REPORTS & OPTIONS
Southern Europe
New Jersey
Compare Cities
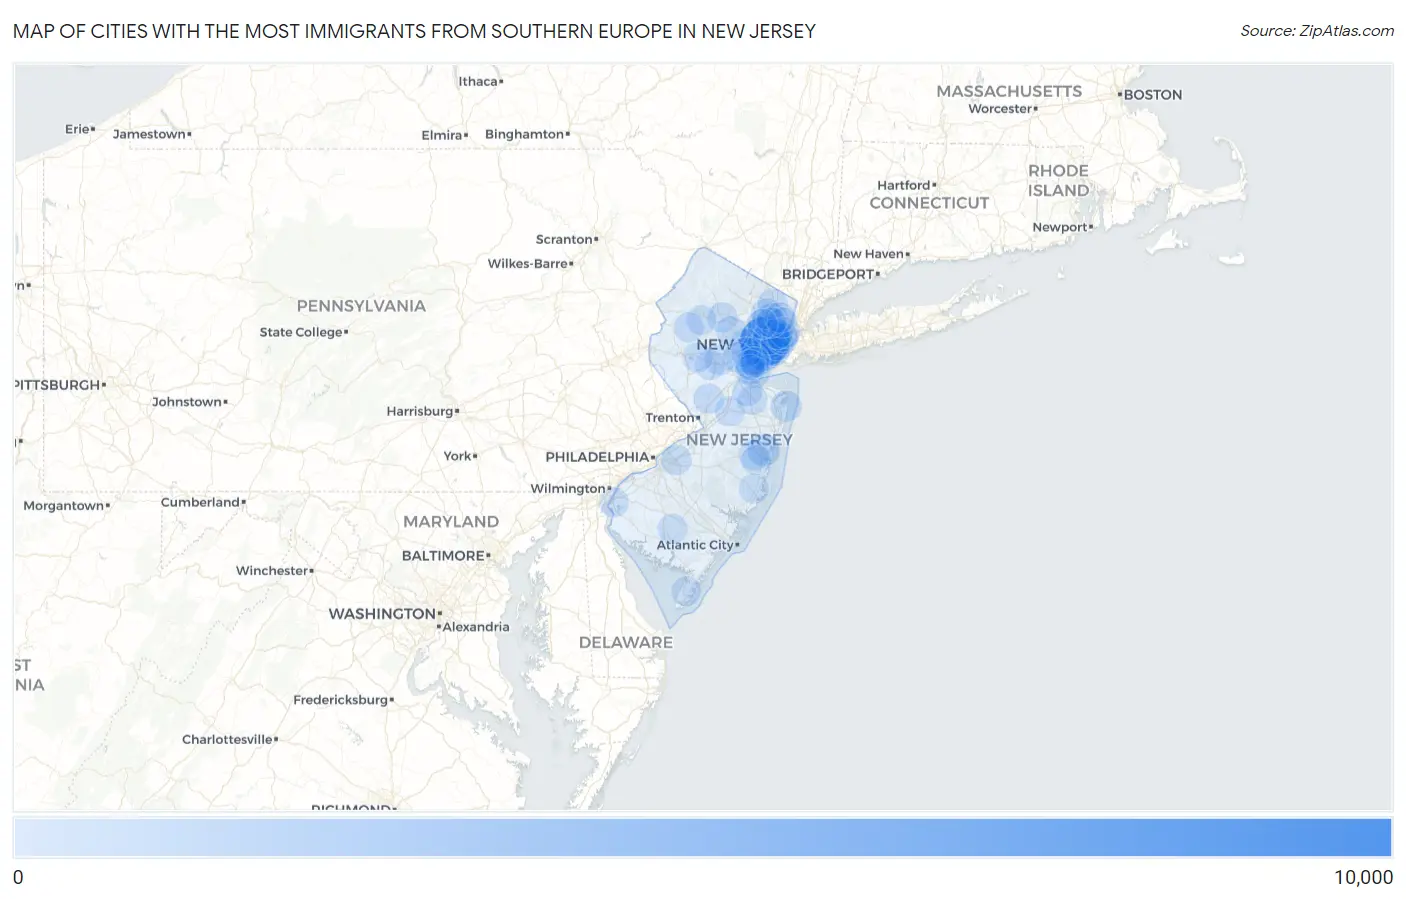
Map of Cities with the Most Immigrants from Southern Europe in New Jersey
0
10,000
Cities with the Most Immigrants from Southern Europe in New Jersey
| City | Southern Europe | vs State | vs National | |
| 1. | Newark | 8,088 | 80,241(10.08%)#1 | 728,588(1.11%)#4 |
| 2. | Elizabeth | 3,734 | 80,241(4.65%)#2 | 728,588(0.51%)#14 |
| 3. | Kearny | 3,098 | 80,241(3.86%)#3 | 728,588(0.43%)#16 |
| 4. | Linden | 1,809 | 80,241(2.25%)#4 | 728,588(0.25%)#27 |
| 5. | North Arlington Borough | 1,290 | 80,241(1.61%)#5 | 728,588(0.18%)#41 |
| 6. | Jersey City | 1,251 | 80,241(1.56%)#6 | 728,588(0.17%)#42 |
| 7. | Toms River | 961 | 80,241(1.20%)#7 | 728,588(0.13%)#69 |
| 8. | South River Borough | 784 | 80,241(0.98%)#8 | 728,588(0.11%)#85 |
| 9. | Bayonne | 783 | 80,241(0.98%)#9 | 728,588(0.11%)#86 |
| 10. | Harrison | 742 | 80,241(0.92%)#10 | 728,588(0.10%)#96 |
| 11. | Lodi Borough | 730 | 80,241(0.91%)#11 | 728,588(0.10%)#98 |
| 12. | Cliffside Park Borough | 683 | 80,241(0.85%)#12 | 728,588(0.09%)#105 |
| 13. | Clifton | 652 | 80,241(0.81%)#13 | 728,588(0.09%)#111 |
| 14. | Sayreville Borough | 630 | 80,241(0.79%)#14 | 728,588(0.09%)#118 |
| 15. | Hoboken | 541 | 80,241(0.67%)#15 | 728,588(0.07%)#144 |
| 16. | Fairview Borough | 538 | 80,241(0.67%)#16 | 728,588(0.07%)#147 |
| 17. | Long Branch | 534 | 80,241(0.67%)#17 | 728,588(0.07%)#150 |
| 18. | Colonia | 532 | 80,241(0.66%)#18 | 728,588(0.07%)#153 |
| 19. | Hawthorne Borough | 525 | 80,241(0.65%)#19 | 728,588(0.07%)#157 |
| 20. | Garfield | 521 | 80,241(0.65%)#20 | 728,588(0.07%)#159 |
| 21. | Fort Lee Borough | 455 | 80,241(0.57%)#21 | 728,588(0.06%)#194 |
| 22. | Elmwood Park Borough | 408 | 80,241(0.51%)#22 | 728,588(0.06%)#221 |
| 23. | Rahway | 398 | 80,241(0.50%)#23 | 728,588(0.05%)#229 |
| 24. | North Plainfield Borough | 354 | 80,241(0.44%)#24 | 728,588(0.05%)#267 |
| 25. | Union City | 338 | 80,241(0.42%)#25 | 728,588(0.05%)#285 |
| 26. | Totowa Borough | 332 | 80,241(0.41%)#26 | 728,588(0.05%)#293 |
| 27. | Woodland Park Borough | 322 | 80,241(0.40%)#27 | 728,588(0.04%)#302 |
| 28. | Paramus Borough | 316 | 80,241(0.39%)#28 | 728,588(0.04%)#310 |
| 29. | Eatontown Borough | 311 | 80,241(0.39%)#29 | 728,588(0.04%)#315 |
| 30. | West New York | 310 | 80,241(0.39%)#30 | 728,588(0.04%)#316 |
| 31. | Summit | 309 | 80,241(0.39%)#31 | 728,588(0.04%)#317 |
| 32. | Ridgefield Borough | 305 | 80,241(0.38%)#32 | 728,588(0.04%)#320 |
| 33. | Holiday City Berkeley | 297 | 80,241(0.37%)#33 | 728,588(0.04%)#328 |
| 34. | Mountainside Borough | 297 | 80,241(0.37%)#34 | 728,588(0.04%)#329 |
| 35. | Martinsville | 295 | 80,241(0.37%)#35 | 728,588(0.04%)#335 |
| 36. | Ramblewood | 295 | 80,241(0.37%)#36 | 728,588(0.04%)#336 |
| 37. | Fair Lawn Borough | 289 | 80,241(0.36%)#37 | 728,588(0.04%)#345 |
| 38. | Paterson | 286 | 80,241(0.36%)#38 | 728,588(0.04%)#353 |
| 39. | Little Ferry Borough | 285 | 80,241(0.36%)#39 | 728,588(0.04%)#357 |
| 40. | Carteret Borough | 273 | 80,241(0.34%)#40 | 728,588(0.04%)#372 |
| 41. | Kenilworth Borough | 270 | 80,241(0.34%)#41 | 728,588(0.04%)#380 |
| 42. | Secaucus | 269 | 80,241(0.34%)#42 | 728,588(0.04%)#382 |
| 43. | North Haledon Borough | 269 | 80,241(0.34%)#43 | 728,588(0.04%)#383 |
| 44. | Perth Amboy | 262 | 80,241(0.33%)#44 | 728,588(0.04%)#391 |
| 45. | Wood Ridge Borough | 261 | 80,241(0.33%)#45 | 728,588(0.04%)#394 |
| 46. | Princeton | 253 | 80,241(0.32%)#46 | 728,588(0.03%)#409 |
| 47. | Plainfield | 244 | 80,241(0.30%)#47 | 728,588(0.03%)#430 |
| 48. | Ridgewood | 239 | 80,241(0.30%)#48 | 728,588(0.03%)#443 |
| 49. | Rutherford Borough | 228 | 80,241(0.28%)#49 | 728,588(0.03%)#471 |
| 50. | Morristown | 206 | 80,241(0.26%)#50 | 728,588(0.03%)#526 |
| 51. | Hackensack | 202 | 80,241(0.25%)#51 | 728,588(0.03%)#535 |
| 52. | South Plainfield Borough | 199 | 80,241(0.25%)#52 | 728,588(0.03%)#546 |
| 53. | Westfield | 195 | 80,241(0.24%)#53 | 728,588(0.03%)#561 |
| 54. | Cedar Knolls | 192 | 80,241(0.24%)#54 | 728,588(0.03%)#572 |
| 55. | Preakness | 188 | 80,241(0.23%)#55 | 728,588(0.03%)#582 |
| 56. | Hillsborough | 185 | 80,241(0.23%)#56 | 728,588(0.03%)#590 |
| 57. | Sicklerville | 182 | 80,241(0.23%)#57 | 728,588(0.02%)#598 |
| 58. | Caldwell Borough | 176 | 80,241(0.22%)#58 | 728,588(0.02%)#619 |
| 59. | Roselle Park Borough | 175 | 80,241(0.22%)#59 | 728,588(0.02%)#621 |
| 60. | Pompton Lakes Borough | 174 | 80,241(0.22%)#60 | 728,588(0.02%)#624 |
| 61. | Robertsville | 173 | 80,241(0.22%)#61 | 728,588(0.02%)#628 |
| 62. | Ridgefield Park | 171 | 80,241(0.21%)#62 | 728,588(0.02%)#633 |
| 63. | Hasbrouck Heights Borough | 171 | 80,241(0.21%)#63 | 728,588(0.02%)#634 |
| 64. | Fords | 167 | 80,241(0.21%)#64 | 728,588(0.02%)#653 |
| 65. | Bradley Gardens | 165 | 80,241(0.21%)#65 | 728,588(0.02%)#661 |
| 66. | Spotswood Borough | 165 | 80,241(0.21%)#66 | 728,588(0.02%)#663 |
| 67. | Tinton Falls Borough | 160 | 80,241(0.20%)#67 | 728,588(0.02%)#681 |
| 68. | Middlesex Borough | 158 | 80,241(0.20%)#68 | 728,588(0.02%)#689 |
| 69. | Clearbrook | 158 | 80,241(0.20%)#69 | 728,588(0.02%)#691 |
| 70. | Holiday Heights | 154 | 80,241(0.19%)#70 | 728,588(0.02%)#708 |
| 71. | Vineland | 152 | 80,241(0.19%)#71 | 728,588(0.02%)#713 |
| 72. | Flanders | 151 | 80,241(0.19%)#72 | 728,588(0.02%)#720 |
| 73. | Westwood Borough | 146 | 80,241(0.18%)#73 | 728,588(0.02%)#743 |
| 74. | Roseland Borough | 146 | 80,241(0.18%)#74 | 728,588(0.02%)#744 |
| 75. | Old Bridge | 145 | 80,241(0.18%)#75 | 728,588(0.02%)#749 |
| 76. | Lincoln Park Borough | 144 | 80,241(0.18%)#76 | 728,588(0.02%)#756 |
| 77. | Palisades Park Borough | 142 | 80,241(0.18%)#77 | 728,588(0.02%)#763 |
| 78. | Dover | 142 | 80,241(0.18%)#78 | 728,588(0.02%)#764 |
| 79. | Budd Lake | 141 | 80,241(0.18%)#79 | 728,588(0.02%)#773 |
| 80. | Glassboro Borough | 139 | 80,241(0.17%)#80 | 728,588(0.02%)#781 |
| 81. | Beattystown | 139 | 80,241(0.17%)#81 | 728,588(0.02%)#784 |
| 82. | Iselin | 137 | 80,241(0.17%)#82 | 728,588(0.02%)#789 |
| 83. | Ramsey Borough | 136 | 80,241(0.17%)#83 | 728,588(0.02%)#798 |
| 84. | Troy Hills | 136 | 80,241(0.17%)#84 | 728,588(0.02%)#800 |
| 85. | Pompton Plains | 130 | 80,241(0.16%)#85 | 728,588(0.02%)#830 |
| 86. | Parsippany | 120 | 80,241(0.15%)#86 | 728,588(0.02%)#881 |
| 87. | Somerville Borough | 120 | 80,241(0.15%)#87 | 728,588(0.02%)#884 |
| 88. | Freehold Borough | 119 | 80,241(0.15%)#88 | 728,588(0.02%)#891 |
| 89. | Bound Brook Borough | 118 | 80,241(0.15%)#89 | 728,588(0.02%)#897 |
| 90. | Madison Borough | 117 | 80,241(0.15%)#90 | 728,588(0.02%)#906 |
| 91. | Pennsville | 117 | 80,241(0.15%)#91 | 728,588(0.02%)#907 |
| 92. | Passaic | 114 | 80,241(0.14%)#92 | 728,588(0.02%)#918 |
| 93. | Avenel | 114 | 80,241(0.14%)#93 | 728,588(0.02%)#925 |
| 94. | Ocean Acres | 112 | 80,241(0.14%)#94 | 728,588(0.02%)#934 |
| 95. | Twin Rivers | 112 | 80,241(0.14%)#95 | 728,588(0.02%)#935 |
| 96. | White House Station | 112 | 80,241(0.14%)#96 | 728,588(0.02%)#937 |
| 97. | Upper Montclair | 109 | 80,241(0.14%)#97 | 728,588(0.01%)#962 |
| 98. | Lake Hopatcong | 104 | 80,241(0.13%)#98 | 728,588(0.01%)#1,006 |
| 99. | Watchung Borough | 102 | 80,241(0.13%)#99 | 728,588(0.01%)#1,027 |
| 100. | Whitesboro | 101 | 80,241(0.13%)#100 | 728,588(0.01%)#1,034 |
Common Questions
What are the Top 10 Cities with the Most Immigrants from Southern Europe in New Jersey?
Top 10 Cities with the Most Immigrants from Southern Europe in New Jersey are:
#1
8,088
#2
3,734
#3
3,098
#4
1,809
#5
1,251
#6
961
#7
783
#8
742
#9
652
#10
541
What city has the Most Immigrants from Southern Europe in New Jersey?
Newark has the Most Immigrants from Southern Europe in New Jersey with 8,088.
What is the Total Immigrants from Southern Europe in the State of New Jersey?
Total Immigrants from Southern Europe in New Jersey is 80,241.
What is the Total Immigrants from Southern Europe in the United States?
Total Immigrants from Southern Europe in the United States is 728,588.