Cities with the Most Immigrants from Southern Europe in Iowa
RELATED REPORTS & OPTIONS
Southern Europe
Iowa
Compare Cities
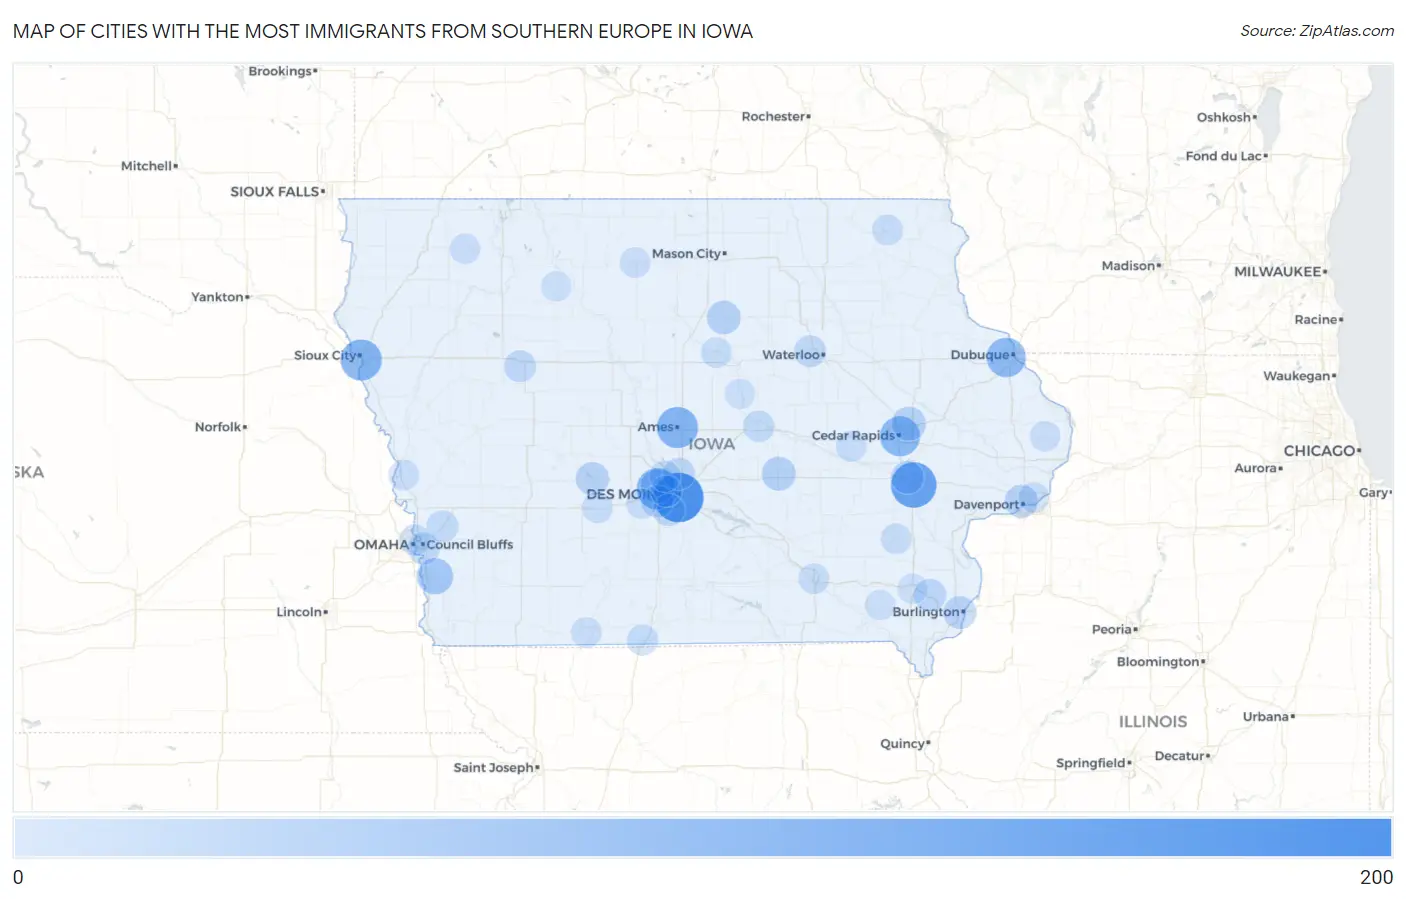
Map of Cities with the Most Immigrants from Southern Europe in Iowa
0
200
Cities with the Most Immigrants from Southern Europe in Iowa
| City | Southern Europe | vs State | vs National | |
| 1. | Des Moines | 167 | 1,316(12.69%)#1 | 728,588(0.02%)#649 |
| 2. | Iowa City | 132 | 1,316(10.03%)#2 | 728,588(0.02%)#813 |
| 3. | Clive | 97 | 1,316(7.37%)#3 | 728,588(0.01%)#1,070 |
| 4. | Sioux City | 93 | 1,316(7.07%)#4 | 728,588(0.01%)#1,110 |
| 5. | Ames | 93 | 1,316(7.07%)#5 | 728,588(0.01%)#1,112 |
| 6. | Cedar Rapids | 84 | 1,316(6.38%)#6 | 728,588(0.01%)#1,196 |
| 7. | Dubuque | 77 | 1,316(5.85%)#7 | 728,588(0.01%)#1,278 |
| 8. | Glenwood | 50 | 1,316(3.80%)#8 | 728,588(0.01%)#1,804 |
| 9. | Urbandale | 35 | 1,316(2.66%)#9 | 728,588(0.00%)#2,251 |
| 10. | Marion | 32 | 1,316(2.43%)#10 | 728,588(0.00%)#2,364 |
| 11. | Grinnell | 31 | 1,316(2.36%)#11 | 728,588(0.00%)#2,419 |
| 12. | Hampton | 29 | 1,316(2.20%)#12 | 728,588(0.00%)#2,519 |
| 13. | Panora | 25 | 1,316(1.90%)#13 | 728,588(0.00%)#2,712 |
| 14. | Davenport | 24 | 1,316(1.82%)#14 | 728,588(0.00%)#2,717 |
| 15. | Burlington | 22 | 1,316(1.67%)#15 | 728,588(0.00%)#2,850 |
| 16. | Coralville | 21 | 1,316(1.60%)#16 | 728,588(0.00%)#2,932 |
| 17. | Ankeny | 17 | 1,316(1.29%)#17 | 728,588(0.00%)#3,207 |
| 18. | New London | 17 | 1,316(1.29%)#18 | 728,588(0.00%)#3,274 |
| 19. | West Des Moines | 16 | 1,316(1.22%)#19 | 728,588(0.00%)#3,291 |
| 20. | Norwalk | 16 | 1,316(1.22%)#20 | 728,588(0.00%)#3,314 |
| 21. | Council Bluffs | 15 | 1,316(1.14%)#21 | 728,588(0.00%)#3,379 |
| 22. | Sac City | 14 | 1,316(1.06%)#22 | 728,588(0.00%)#3,553 |
| 23. | Cedar Falls | 13 | 1,316(0.99%)#23 | 728,588(0.00%)#3,572 |
| 24. | Underwood | 12 | 1,316(0.91%)#24 | 728,588(0.00%)#3,754 |
| 25. | Marshalltown | 10 | 1,316(0.76%)#25 | 728,588(0.00%)#3,909 |
| 26. | Windsor Heights | 10 | 1,316(0.76%)#26 | 728,588(0.00%)#3,982 |
| 27. | Carter Lake | 9 | 1,316(0.68%)#27 | 728,588(0.00%)#4,130 |
| 28. | Johnston | 8 | 1,316(0.61%)#28 | 728,588(0.00%)#4,218 |
| 29. | Lamoni | 7 | 1,316(0.53%)#29 | 728,588(0.00%)#4,439 |
| 30. | Washington | 6 | 1,316(0.46%)#30 | 728,588(0.00%)#4,524 |
| 31. | Stuart | 6 | 1,316(0.46%)#31 | 728,588(0.00%)#4,574 |
| 32. | Bettendorf | 5 | 1,316(0.38%)#32 | 728,588(0.00%)#4,629 |
| 33. | Ottumwa | 5 | 1,316(0.38%)#33 | 728,588(0.00%)#4,633 |
| 34. | Decorah | 5 | 1,316(0.38%)#34 | 728,588(0.00%)#4,654 |
| 35. | Iowa Falls | 5 | 1,316(0.38%)#35 | 728,588(0.00%)#4,663 |
| 36. | Blairstown | 5 | 1,316(0.38%)#36 | 728,588(0.00%)#4,751 |
| 37. | Mondamin | 4 | 1,316(0.30%)#37 | 728,588(0.00%)#4,899 |
| 38. | Van Meter | 3 | 1,316(0.23%)#38 | 728,588(0.00%)#4,974 |
| 39. | Maloy | 3 | 1,316(0.23%)#39 | 728,588(0.00%)#5,042 |
| 40. | Hartley | 2 | 1,316(0.15%)#40 | 728,588(0.00%)#5,103 |
| 41. | Wesley | 2 | 1,316(0.15%)#41 | 728,588(0.00%)#5,176 |
| 42. | Goose Lake | 2 | 1,316(0.15%)#42 | 728,588(0.00%)#5,185 |
| 43. | Mount Pleasant | 1 | 1,316(0.08%)#43 | 728,588(0.00%)#5,210 |
| 44. | Union | 1 | 1,316(0.08%)#44 | 728,588(0.00%)#5,273 |
| 45. | Stockport | 1 | 1,316(0.08%)#45 | 728,588(0.00%)#5,289 |
| 46. | Mallard | 1 | 1,316(0.08%)#46 | 728,588(0.00%)#5,292 |
Common Questions
What are the Top 10 Cities with the Most Immigrants from Southern Europe in Iowa?
Top 10 Cities with the Most Immigrants from Southern Europe in Iowa are:
#1
167
#2
132
#3
97
#4
93
#5
93
#6
84
#7
77
#8
50
#9
35
#10
32
What city has the Most Immigrants from Southern Europe in Iowa?
Des Moines has the Most Immigrants from Southern Europe in Iowa with 167.
What is the Total Immigrants from Southern Europe in the State of Iowa?
Total Immigrants from Southern Europe in Iowa is 1,316.
What is the Total Immigrants from Southern Europe in the United States?
Total Immigrants from Southern Europe in the United States is 728,588.