Cities with the Most Immigrants from Southern Europe in North Carolina
RELATED REPORTS & OPTIONS
Southern Europe
North Carolina
Compare Cities
Map of Cities with the Most Immigrants from Southern Europe in North Carolina
0
2,000
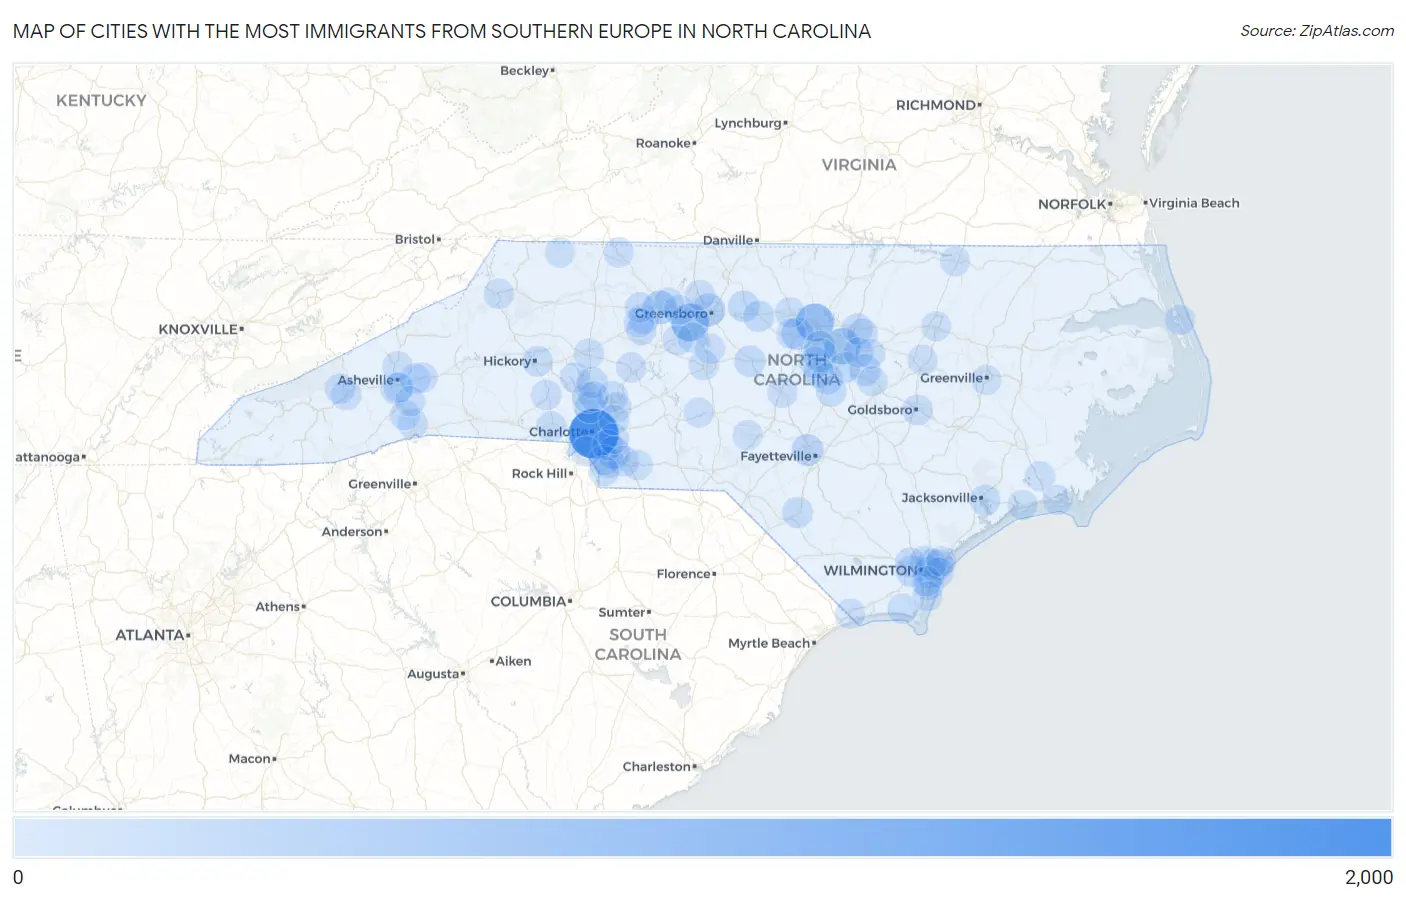
Cities with the Most Immigrants from Southern Europe in North Carolina
| City | Southern Europe | vs State | vs National | |
| 1. | Charlotte | 1,651 | 10,084(16.37%)#1 | 728,588(0.23%)#32 |
| 2. | Durham | 661 | 10,084(6.55%)#2 | 728,588(0.09%)#109 |
| 3. | High Point | 638 | 10,084(6.33%)#3 | 728,588(0.09%)#117 |
| 4. | Raleigh | 495 | 10,084(4.91%)#4 | 728,588(0.07%)#167 |
| 5. | Winston Salem | 293 | 10,084(2.91%)#5 | 728,588(0.04%)#338 |
| 6. | Cary | 288 | 10,084(2.86%)#6 | 728,588(0.04%)#350 |
| 7. | Greensboro | 249 | 10,084(2.47%)#7 | 728,588(0.03%)#411 |
| 8. | Indian Trail | 215 | 10,084(2.13%)#8 | 728,588(0.03%)#501 |
| 9. | Chapel Hill | 199 | 10,084(1.97%)#9 | 728,588(0.03%)#545 |
| 10. | Fayetteville | 158 | 10,084(1.57%)#10 | 728,588(0.02%)#687 |
| 11. | Elon | 123 | 10,084(1.22%)#11 | 728,588(0.02%)#864 |
| 12. | Asheville | 120 | 10,084(1.19%)#12 | 728,588(0.02%)#876 |
| 13. | Huntersville | 117 | 10,084(1.16%)#13 | 728,588(0.02%)#903 |
| 14. | Clayton | 115 | 10,084(1.14%)#14 | 728,588(0.02%)#915 |
| 15. | Siler City | 115 | 10,084(1.14%)#15 | 728,588(0.02%)#916 |
| 16. | Apex | 114 | 10,084(1.13%)#16 | 728,588(0.02%)#920 |
| 17. | Wilmington | 109 | 10,084(1.08%)#17 | 728,588(0.01%)#955 |
| 18. | Leland | 109 | 10,084(1.08%)#18 | 728,588(0.01%)#961 |
| 19. | Graham | 103 | 10,084(1.02%)#19 | 728,588(0.01%)#1,014 |
| 20. | Wesley Chapel | 90 | 10,084(0.89%)#20 | 728,588(0.01%)#1,146 |
| 21. | Garner | 86 | 10,084(0.85%)#21 | 728,588(0.01%)#1,171 |
| 22. | Lumberton | 78 | 10,084(0.77%)#22 | 728,588(0.01%)#1,270 |
| 23. | Fuquay Varina | 76 | 10,084(0.75%)#23 | 728,588(0.01%)#1,299 |
| 24. | Mooresville | 75 | 10,084(0.74%)#24 | 728,588(0.01%)#1,317 |
| 25. | Jacksonville | 71 | 10,084(0.70%)#25 | 728,588(0.01%)#1,374 |
| 26. | Morrisville | 71 | 10,084(0.70%)#26 | 728,588(0.01%)#1,378 |
| 27. | Cornelius | 68 | 10,084(0.67%)#27 | 728,588(0.01%)#1,423 |
| 28. | Wrightsboro | 67 | 10,084(0.66%)#28 | 728,588(0.01%)#1,451 |
| 29. | Goldsboro | 64 | 10,084(0.63%)#29 | 728,588(0.01%)#1,501 |
| 30. | Hickory | 61 | 10,084(0.60%)#30 | 728,588(0.01%)#1,552 |
| 31. | Wake Forest | 59 | 10,084(0.59%)#31 | 728,588(0.01%)#1,587 |
| 32. | Holly Springs | 59 | 10,084(0.59%)#32 | 728,588(0.01%)#1,588 |
| 33. | Kannapolis | 52 | 10,084(0.52%)#33 | 728,588(0.01%)#1,732 |
| 34. | Concord | 50 | 10,084(0.50%)#34 | 728,588(0.01%)#1,784 |
| 35. | Weddington | 50 | 10,084(0.50%)#35 | 728,588(0.01%)#1,799 |
| 36. | Matthews | 47 | 10,084(0.47%)#36 | 728,588(0.01%)#1,869 |
| 37. | Angier | 47 | 10,084(0.47%)#37 | 728,588(0.01%)#1,885 |
| 38. | Monroe | 41 | 10,084(0.41%)#38 | 728,588(0.01%)#2,035 |
| 39. | Rolesville | 41 | 10,084(0.41%)#39 | 728,588(0.01%)#2,046 |
| 40. | Sanford | 40 | 10,084(0.40%)#40 | 728,588(0.01%)#2,062 |
| 41. | Clemmons | 40 | 10,084(0.40%)#41 | 728,588(0.01%)#2,065 |
| 42. | Waynesville | 40 | 10,084(0.40%)#42 | 728,588(0.01%)#2,072 |
| 43. | Hillsborough | 37 | 10,084(0.37%)#43 | 728,588(0.01%)#2,188 |
| 44. | Mint Hill | 36 | 10,084(0.36%)#44 | 728,588(0.00%)#2,209 |
| 45. | Thomasville | 35 | 10,084(0.35%)#45 | 728,588(0.00%)#2,255 |
| 46. | Boone | 35 | 10,084(0.35%)#46 | 728,588(0.00%)#2,260 |
| 47. | Carrboro | 34 | 10,084(0.34%)#47 | 728,588(0.00%)#2,302 |
| 48. | Advance | 33 | 10,084(0.33%)#48 | 728,588(0.00%)#2,356 |
| 49. | Lewisville | 32 | 10,084(0.32%)#49 | 728,588(0.00%)#2,378 |
| 50. | Lincolnton | 32 | 10,084(0.32%)#50 | 728,588(0.00%)#2,380 |
| 51. | St James | 30 | 10,084(0.30%)#51 | 728,588(0.00%)#2,456 |
| 52. | Gastonia | 29 | 10,084(0.29%)#52 | 728,588(0.00%)#2,475 |
| 53. | East Flat Rock | 29 | 10,084(0.29%)#53 | 728,588(0.00%)#2,513 |
| 54. | Swannanoa | 29 | 10,084(0.29%)#54 | 728,588(0.00%)#2,516 |
| 55. | Maggie Valley | 29 | 10,084(0.29%)#55 | 728,588(0.00%)#2,525 |
| 56. | Harrisburg | 28 | 10,084(0.28%)#56 | 728,588(0.00%)#2,541 |
| 57. | Asheboro | 27 | 10,084(0.27%)#57 | 728,588(0.00%)#2,580 |
| 58. | Wendell | 27 | 10,084(0.27%)#58 | 728,588(0.00%)#2,598 |
| 59. | Lake Norman Of Catawba | 26 | 10,084(0.26%)#59 | 728,588(0.00%)#2,649 |
| 60. | Waxhaw | 25 | 10,084(0.25%)#60 | 728,588(0.00%)#2,679 |
| 61. | Wingate | 25 | 10,084(0.25%)#61 | 728,588(0.00%)#2,703 |
| 62. | Balfour | 25 | 10,084(0.25%)#62 | 728,588(0.00%)#2,714 |
| 63. | Kernersville | 24 | 10,084(0.24%)#63 | 728,588(0.00%)#2,727 |
| 64. | Davidson | 24 | 10,084(0.24%)#64 | 728,588(0.00%)#2,736 |
| 65. | Summerfield | 24 | 10,084(0.24%)#65 | 728,588(0.00%)#2,744 |
| 66. | Statesville | 23 | 10,084(0.23%)#66 | 728,588(0.00%)#2,791 |
| 67. | Knightdale | 23 | 10,084(0.23%)#67 | 728,588(0.00%)#2,795 |
| 68. | Myrtle Grove | 22 | 10,084(0.22%)#68 | 728,588(0.00%)#2,865 |
| 69. | Ogden | 22 | 10,084(0.22%)#69 | 728,588(0.00%)#2,874 |
| 70. | Kings Grant | 21 | 10,084(0.21%)#70 | 728,588(0.00%)#2,943 |
| 71. | Archdale | 20 | 10,084(0.20%)#71 | 728,588(0.00%)#3,002 |
| 72. | Randleman | 20 | 10,084(0.20%)#72 | 728,588(0.00%)#3,025 |
| 73. | Wrightsville Beach | 20 | 10,084(0.20%)#73 | 728,588(0.00%)#3,031 |
| 74. | Black Mountain | 19 | 10,084(0.19%)#74 | 728,588(0.00%)#3,082 |
| 75. | Bermuda Run | 19 | 10,084(0.19%)#75 | 728,588(0.00%)#3,110 |
| 76. | Navassa | 19 | 10,084(0.19%)#76 | 728,588(0.00%)#3,119 |
| 77. | Salisbury | 17 | 10,084(0.17%)#77 | 728,588(0.00%)#3,215 |
| 78. | Silver Lake | 17 | 10,084(0.17%)#78 | 728,588(0.00%)#3,256 |
| 79. | Wilson S Mills | 16 | 10,084(0.16%)#79 | 728,588(0.00%)#3,362 |
| 80. | Mount Airy | 15 | 10,084(0.15%)#80 | 728,588(0.00%)#3,410 |
| 81. | Pineville | 15 | 10,084(0.15%)#81 | 728,588(0.00%)#3,411 |
| 82. | Kill Devil Hills | 15 | 10,084(0.15%)#82 | 728,588(0.00%)#3,425 |
| 83. | Porters Neck | 15 | 10,084(0.15%)#83 | 728,588(0.00%)#3,428 |
| 84. | Briar Chapel | 15 | 10,084(0.15%)#84 | 728,588(0.00%)#3,442 |
| 85. | Carolina Shores | 15 | 10,084(0.15%)#85 | 728,588(0.00%)#3,444 |
| 86. | Troy | 15 | 10,084(0.15%)#86 | 728,588(0.00%)#3,458 |
| 87. | Hoopers Creek | 15 | 10,084(0.15%)#87 | 728,588(0.00%)#3,470 |
| 88. | Weaverville | 14 | 10,084(0.14%)#88 | 728,588(0.00%)#3,531 |
| 89. | Havelock | 13 | 10,084(0.13%)#89 | 728,588(0.00%)#3,593 |
| 90. | Wilson | 12 | 10,084(0.12%)#90 | 728,588(0.00%)#3,665 |
| 91. | Pinehurst | 12 | 10,084(0.12%)#91 | 728,588(0.00%)#3,686 |
| 92. | Biltmore Forest | 12 | 10,084(0.12%)#92 | 728,588(0.00%)#3,747 |
| 93. | Walkertown | 11 | 10,084(0.11%)#93 | 728,588(0.00%)#3,830 |
| 94. | Greenville | 10 | 10,084(0.10%)#94 | 728,588(0.00%)#3,895 |
| 95. | Rocky Mount | 10 | 10,084(0.10%)#95 | 728,588(0.00%)#3,898 |
| 96. | Roanoke Rapids | 10 | 10,084(0.10%)#96 | 728,588(0.00%)#3,935 |
| 97. | Carolina Beach | 10 | 10,084(0.10%)#97 | 728,588(0.00%)#3,971 |
| 98. | Cape Carteret | 10 | 10,084(0.10%)#98 | 728,588(0.00%)#4,016 |
| 99. | Sparta | 10 | 10,084(0.10%)#99 | 728,588(0.00%)#4,024 |
| 100. | Morehead City | 9 | 10,084(0.09%)#100 | 728,588(0.00%)#4,085 |
Common Questions
What are the Top 10 Cities with the Most Immigrants from Southern Europe in North Carolina?
Top 10 Cities with the Most Immigrants from Southern Europe in North Carolina are:
#1
1,651
#2
661
#3
638
#4
495
#5
293
#6
288
#7
249
#8
215
#9
199
#10
158
What city has the Most Immigrants from Southern Europe in North Carolina?
Charlotte has the Most Immigrants from Southern Europe in North Carolina with 1,651.
What is the Total Immigrants from Southern Europe in the State of North Carolina?
Total Immigrants from Southern Europe in North Carolina is 10,084.
What is the Total Immigrants from Southern Europe in the United States?
Total Immigrants from Southern Europe in the United States is 728,588.