Cities with the Most Immigrants from Southern Europe in Virginia
RELATED REPORTS & OPTIONS
Southern Europe
Virginia
Compare Cities
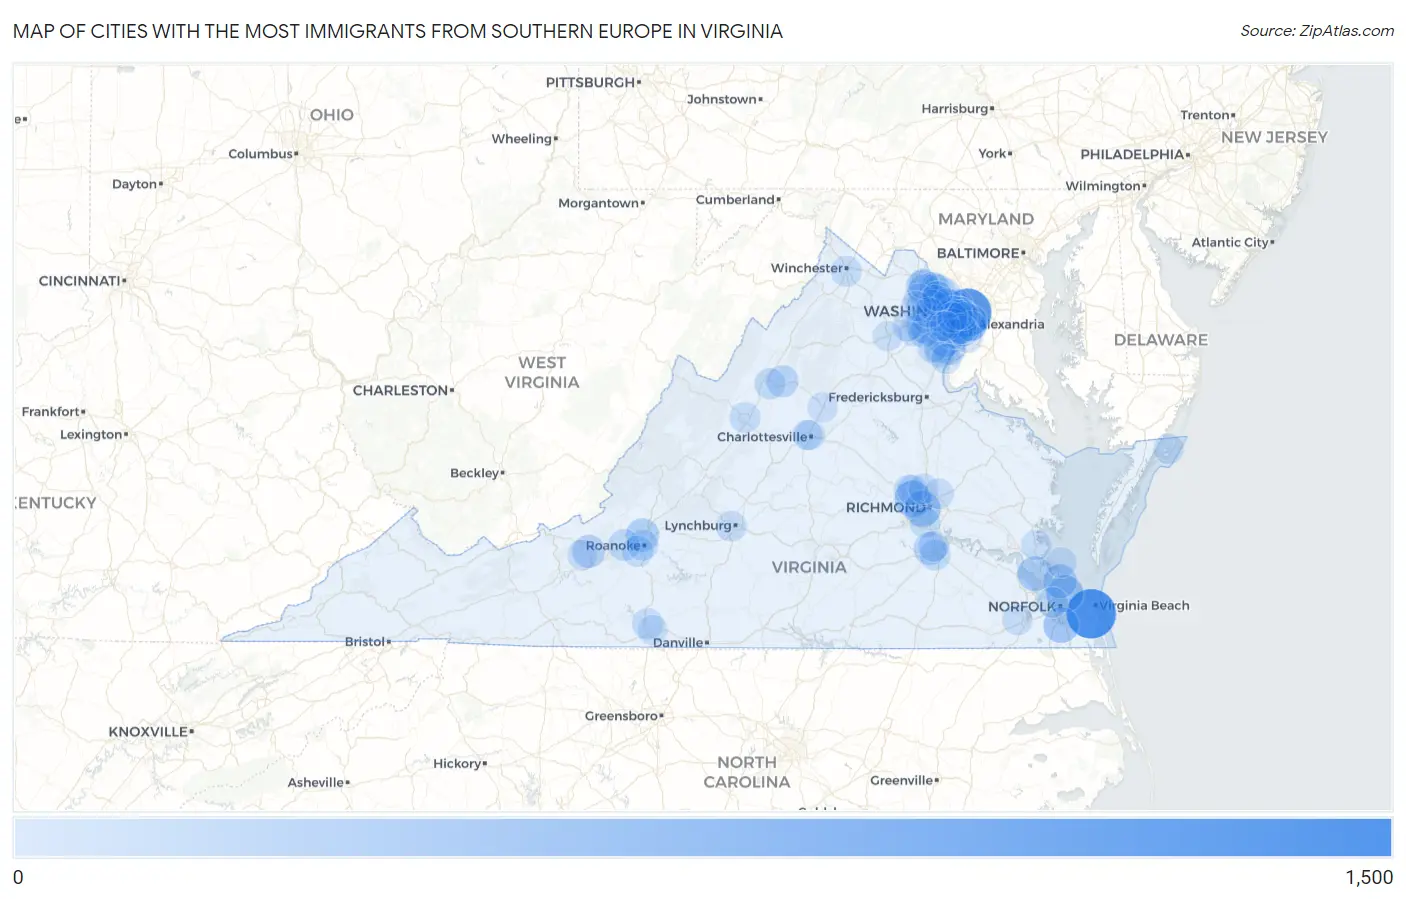
Map of Cities with the Most Immigrants from Southern Europe in Virginia
0
1,500
Cities with the Most Immigrants from Southern Europe in Virginia
| City | Southern Europe | vs State | vs National | |
| 1. | Virginia Beach | 1,168 | 13,724(8.51%)#1 | 728,588(0.16%)#49 |
| 2. | Arlington | 1,062 | 13,724(7.74%)#2 | 728,588(0.15%)#54 |
| 3. | Alexandria | 433 | 13,724(3.16%)#3 | 728,588(0.06%)#206 |
| 4. | Norfolk | 420 | 13,724(3.06%)#4 | 728,588(0.06%)#211 |
| 5. | Tuckahoe | 392 | 13,724(2.86%)#5 | 728,588(0.05%)#237 |
| 6. | Richmond | 368 | 13,724(2.68%)#6 | 728,588(0.05%)#259 |
| 7. | Chesapeake | 343 | 13,724(2.50%)#7 | 728,588(0.05%)#275 |
| 8. | Newport News | 283 | 13,724(2.06%)#8 | 728,588(0.04%)#359 |
| 9. | Tysons | 253 | 13,724(1.84%)#9 | 728,588(0.03%)#410 |
| 10. | Hampton | 232 | 13,724(1.69%)#10 | 728,588(0.03%)#460 |
| 11. | Ashburn | 220 | 13,724(1.60%)#11 | 728,588(0.03%)#488 |
| 12. | Vienna | 211 | 13,724(1.54%)#12 | 728,588(0.03%)#509 |
| 13. | Hollins | 207 | 13,724(1.51%)#13 | 728,588(0.03%)#522 |
| 14. | Oakton | 179 | 13,724(1.30%)#14 | 728,588(0.02%)#604 |
| 15. | Blacksburg | 177 | 13,724(1.29%)#15 | 728,588(0.02%)#610 |
| 16. | Sudley | 177 | 13,724(1.29%)#16 | 728,588(0.02%)#612 |
| 17. | Belmont | 174 | 13,724(1.27%)#17 | 728,588(0.02%)#625 |
| 18. | Ettrick | 168 | 13,724(1.22%)#18 | 728,588(0.02%)#648 |
| 19. | Mclean | 157 | 13,724(1.14%)#19 | 728,588(0.02%)#693 |
| 20. | Annandale | 149 | 13,724(1.09%)#20 | 728,588(0.02%)#727 |
| 21. | Woodbridge | 141 | 13,724(1.03%)#21 | 728,588(0.02%)#769 |
| 22. | Fairfax | 136 | 13,724(0.99%)#22 | 728,588(0.02%)#797 |
| 23. | Centreville | 135 | 13,724(0.98%)#23 | 728,588(0.02%)#802 |
| 24. | Massanutten | 132 | 13,724(0.96%)#24 | 728,588(0.02%)#816 |
| 25. | Manassas Park | 131 | 13,724(0.95%)#25 | 728,588(0.02%)#820 |
| 26. | Leesylvania | 123 | 13,724(0.90%)#26 | 728,588(0.02%)#863 |
| 27. | Reston | 122 | 13,724(0.89%)#27 | 728,588(0.02%)#867 |
| 28. | Fair Oaks | 119 | 13,724(0.87%)#28 | 728,588(0.02%)#887 |
| 29. | Lake Ridge | 105 | 13,724(0.77%)#29 | 728,588(0.01%)#992 |
| 30. | Rose Hill Cdp Fairfax County | 102 | 13,724(0.74%)#30 | 728,588(0.01%)#1,020 |
| 31. | Difficult Run | 96 | 13,724(0.70%)#31 | 728,588(0.01%)#1,084 |
| 32. | Glenvar | 95 | 13,724(0.69%)#32 | 728,588(0.01%)#1,099 |
| 33. | Camp Barrett | 93 | 13,724(0.68%)#33 | 728,588(0.01%)#1,121 |
| 34. | Lincolnia | 91 | 13,724(0.66%)#34 | 728,588(0.01%)#1,138 |
| 35. | Dale City | 85 | 13,724(0.62%)#35 | 728,588(0.01%)#1,182 |
| 36. | Idylwood | 82 | 13,724(0.60%)#36 | 728,588(0.01%)#1,226 |
| 37. | Cave Spring | 79 | 13,724(0.58%)#37 | 728,588(0.01%)#1,258 |
| 38. | Lowes Island | 77 | 13,724(0.56%)#38 | 728,588(0.01%)#1,287 |
| 39. | Massanetta Springs | 76 | 13,724(0.55%)#39 | 728,588(0.01%)#1,314 |
| 40. | Springfield | 72 | 13,724(0.52%)#40 | 728,588(0.01%)#1,360 |
| 41. | Great Falls | 72 | 13,724(0.52%)#41 | 728,588(0.01%)#1,365 |
| 42. | Falls Church | 70 | 13,724(0.51%)#42 | 728,588(0.01%)#1,394 |
| 43. | Roanoke | 69 | 13,724(0.50%)#43 | 728,588(0.01%)#1,404 |
| 44. | Petersburg | 69 | 13,724(0.50%)#44 | 728,588(0.01%)#1,407 |
| 45. | Collinsville | 67 | 13,724(0.49%)#45 | 728,588(0.01%)#1,447 |
| 46. | West Springfield | 66 | 13,724(0.48%)#46 | 728,588(0.01%)#1,462 |
| 47. | Winchester | 65 | 13,724(0.47%)#47 | 728,588(0.01%)#1,483 |
| 48. | Staunton | 63 | 13,724(0.46%)#48 | 728,588(0.01%)#1,517 |
| 49. | Linton Hall | 62 | 13,724(0.45%)#49 | 728,588(0.01%)#1,539 |
| 50. | Countryside | 61 | 13,724(0.44%)#50 | 728,588(0.01%)#1,561 |
| 51. | Montclair | 58 | 13,724(0.42%)#51 | 728,588(0.01%)#1,607 |
| 52. | Meadowbrook | 56 | 13,724(0.41%)#52 | 728,588(0.01%)#1,640 |
| 53. | Cascades | 56 | 13,724(0.41%)#53 | 728,588(0.01%)#1,645 |
| 54. | Merrifield | 54 | 13,724(0.39%)#54 | 728,588(0.01%)#1,694 |
| 55. | Short Pump | 53 | 13,724(0.39%)#55 | 728,588(0.01%)#1,715 |
| 56. | Wolf Trap | 53 | 13,724(0.39%)#56 | 728,588(0.01%)#1,719 |
| 57. | Manassas | 52 | 13,724(0.38%)#57 | 728,588(0.01%)#1,734 |
| 58. | Bailey S Crossroads | 52 | 13,724(0.38%)#58 | 728,588(0.01%)#1,739 |
| 59. | Portsmouth | 51 | 13,724(0.37%)#59 | 728,588(0.01%)#1,760 |
| 60. | Colonial Heights | 51 | 13,724(0.37%)#60 | 728,588(0.01%)#1,769 |
| 61. | Dunn Loring | 50 | 13,724(0.36%)#61 | 728,588(0.01%)#1,802 |
| 62. | Burke | 48 | 13,724(0.35%)#62 | 728,588(0.01%)#1,834 |
| 63. | Lynchburg | 47 | 13,724(0.34%)#63 | 728,588(0.01%)#1,859 |
| 64. | Mount Vernon | 47 | 13,724(0.34%)#64 | 728,588(0.01%)#1,875 |
| 65. | Kings Park | 44 | 13,724(0.32%)#65 | 728,588(0.01%)#1,975 |
| 66. | Independent Hill | 43 | 13,724(0.31%)#66 | 728,588(0.01%)#1,987 |
| 67. | Charlottesville | 41 | 13,724(0.30%)#67 | 728,588(0.01%)#2,034 |
| 68. | Newington | 41 | 13,724(0.30%)#68 | 728,588(0.01%)#2,042 |
| 69. | Innsbrook | 41 | 13,724(0.30%)#69 | 728,588(0.01%)#2,047 |
| 70. | Huntington | 39 | 13,724(0.28%)#70 | 728,588(0.01%)#2,101 |
| 71. | Poquoson | 39 | 13,724(0.28%)#71 | 728,588(0.01%)#2,102 |
| 72. | Floris | 38 | 13,724(0.28%)#72 | 728,588(0.01%)#2,146 |
| 73. | Mechanicsville | 36 | 13,724(0.26%)#73 | 728,588(0.00%)#2,205 |
| 74. | South Riding | 36 | 13,724(0.26%)#74 | 728,588(0.00%)#2,206 |
| 75. | Newington Forest | 35 | 13,724(0.26%)#75 | 728,588(0.00%)#2,266 |
| 76. | Union Mill | 35 | 13,724(0.26%)#76 | 728,588(0.00%)#2,284 |
| 77. | Prices Fork | 35 | 13,724(0.26%)#77 | 728,588(0.00%)#2,293 |
| 78. | Hayfield | 33 | 13,724(0.24%)#78 | 728,588(0.00%)#2,350 |
| 79. | Suffolk | 32 | 13,724(0.23%)#79 | 728,588(0.00%)#2,359 |
| 80. | Cherry Hill | 32 | 13,724(0.23%)#80 | 728,588(0.00%)#2,372 |
| 81. | Franconia | 30 | 13,724(0.22%)#81 | 728,588(0.00%)#2,447 |
| 82. | Gainesville | 30 | 13,724(0.22%)#82 | 728,588(0.00%)#2,448 |
| 83. | University Of Virginia | 30 | 13,724(0.22%)#83 | 728,588(0.00%)#2,453 |
| 84. | Chincoteague | 30 | 13,724(0.22%)#84 | 728,588(0.00%)#2,465 |
| 85. | Brambleton | 29 | 13,724(0.21%)#85 | 728,588(0.00%)#2,487 |
| 86. | Fairfax Station | 29 | 13,724(0.21%)#86 | 728,588(0.00%)#2,499 |
| 87. | Seven Corners | 29 | 13,724(0.21%)#87 | 728,588(0.00%)#2,505 |
| 88. | Lansdowne | 28 | 13,724(0.20%)#88 | 728,588(0.00%)#2,547 |
| 89. | Gloucester Point | 28 | 13,724(0.20%)#89 | 728,588(0.00%)#2,550 |
| 90. | Herndon | 27 | 13,724(0.20%)#90 | 728,588(0.00%)#2,581 |
| 91. | Chantilly | 26 | 13,724(0.19%)#91 | 728,588(0.00%)#2,634 |
| 92. | Glen Allen | 26 | 13,724(0.19%)#92 | 728,588(0.00%)#2,643 |
| 93. | Woodburn | 25 | 13,724(0.18%)#93 | 728,588(0.00%)#2,685 |
| 94. | Ruckersville | 24 | 13,724(0.17%)#94 | 728,588(0.00%)#2,771 |
| 95. | Martinsville | 22 | 13,724(0.16%)#95 | 728,588(0.00%)#2,861 |
| 96. | West Falls Church | 20 | 13,724(0.15%)#96 | 728,588(0.00%)#2,979 |
| 97. | Stone Ridge | 20 | 13,724(0.15%)#97 | 728,588(0.00%)#2,992 |
| 98. | Burke Centre | 19 | 13,724(0.14%)#98 | 728,588(0.00%)#3,058 |
| 99. | Dranesville | 19 | 13,724(0.14%)#99 | 728,588(0.00%)#3,071 |
| 100. | Warrenton | 19 | 13,724(0.14%)#100 | 728,588(0.00%)#3,076 |
Common Questions
What are the Top 10 Cities with the Most Immigrants from Southern Europe in Virginia?
Top 10 Cities with the Most Immigrants from Southern Europe in Virginia are:
#1
1,168
#2
1,062
#3
433
#4
420
#5
392
#6
368
#7
343
#8
283
#9
253
#10
232
What city has the Most Immigrants from Southern Europe in Virginia?
Virginia Beach has the Most Immigrants from Southern Europe in Virginia with 1,168.
What is the Total Immigrants from Southern Europe in the State of Virginia?
Total Immigrants from Southern Europe in Virginia is 13,724.
What is the Total Immigrants from Southern Europe in the United States?
Total Immigrants from Southern Europe in the United States is 728,588.