Cities with the Highest Percentage of Immigrants from Asia in Utah
RELATED REPORTS & OPTIONS
Asia
Utah
Compare Cities
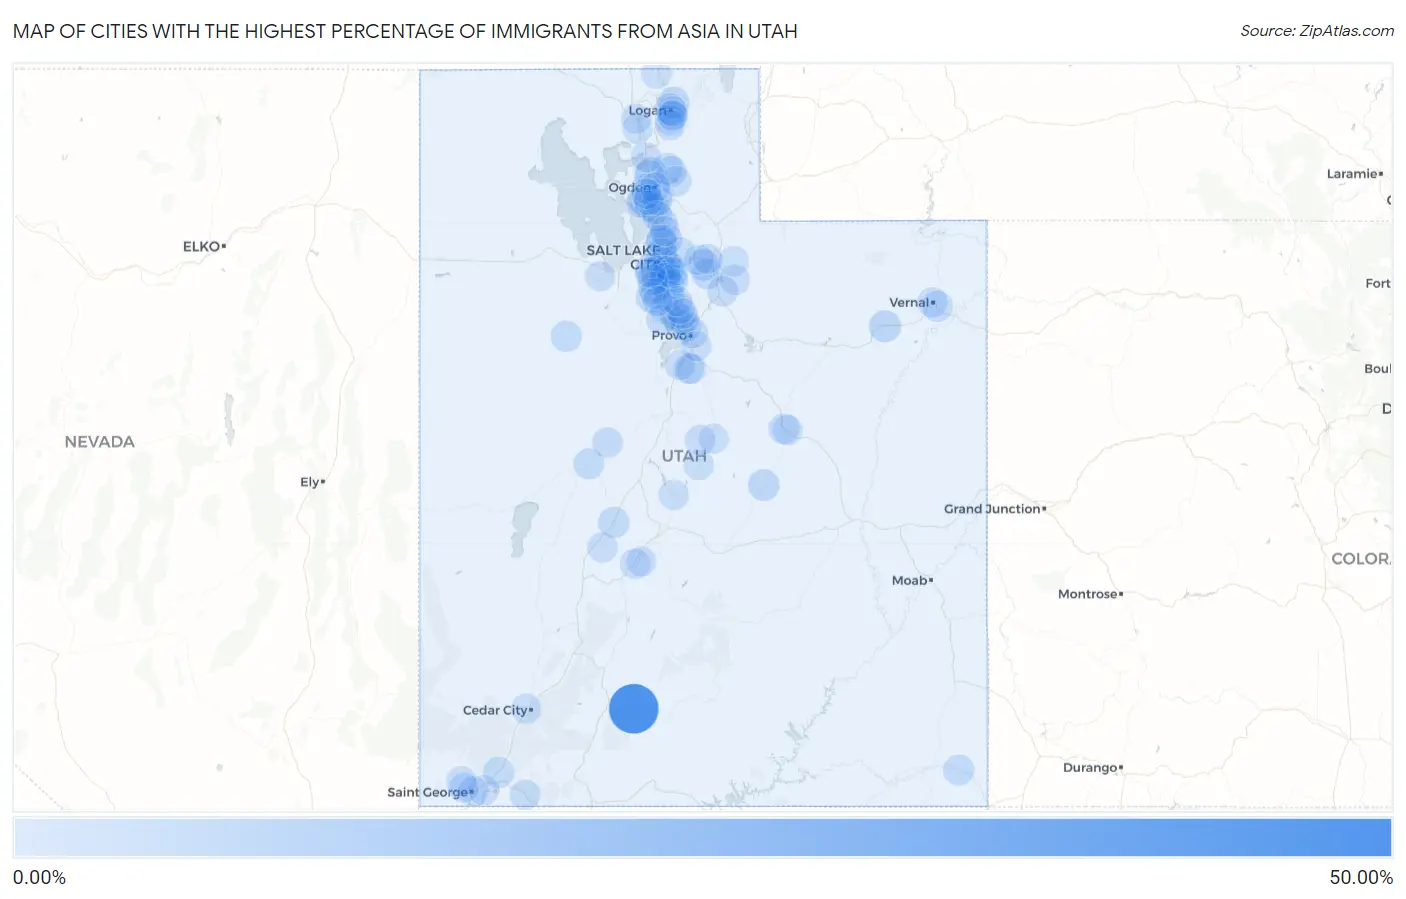
Map of Cities with the Highest Percentage of Immigrants from Asia in Utah
0.00%
50.00%
Cities with the Highest Percentage of Immigrants from Asia in Utah
| City | Asia | vs State | vs National | |
| 1. | Bryce Canyon City | 45.85% | 1.77%(+44.1)#1 | 4.26%(+41.6)#18 |
| 2. | South Salt Lake | 6.37% | 1.77%(+4.60)#2 | 4.26%(+2.11)#1,685 |
| 3. | Taylorsville | 5.93% | 1.77%(+4.16)#3 | 4.26%(+1.67)#1,817 |
| 4. | North Salt Lake | 4.58% | 1.77%(+2.81)#4 | 4.26%(+0.316)#2,433 |
| 5. | Millcreek | 4.44% | 1.77%(+2.67)#5 | 4.26%(+0.178)#2,516 |
| 6. | Ballard | 4.29% | 1.77%(+2.52)#6 | 4.26%(+0.034)#2,613 |
| 7. | Salt Lake City | 4.17% | 1.77%(+2.40)#7 | 4.26%(-0.093)#2,716 |
| 8. | Castle Dale | 3.86% | 1.77%(+2.09)#8 | 4.26%(-0.400)#2,927 |
| 9. | Snyderville | 3.86% | 1.77%(+2.09)#9 | 4.26%(-0.403)#2,928 |
| 10. | Murray | 3.72% | 1.77%(+1.96)#10 | 4.26%(-0.535)#3,038 |
| 11. | Sandy | 3.63% | 1.77%(+1.86)#11 | 4.26%(-0.629)#3,115 |
| 12. | West Valley City | 3.59% | 1.77%(+1.82)#12 | 4.26%(-0.675)#3,155 |
| 13. | North Logan | 3.47% | 1.77%(+1.70)#13 | 4.26%(-0.791)#3,247 |
| 14. | Midvale | 3.26% | 1.77%(+1.49)#14 | 4.26%(-1.00)#3,467 |
| 15. | Draper | 3.01% | 1.77%(+1.24)#15 | 4.26%(-1.25)#3,729 |
| 16. | Park City | 2.94% | 1.77%(+1.17)#16 | 4.26%(-1.32)#3,813 |
| 17. | South Jordan | 2.90% | 1.77%(+1.13)#17 | 4.26%(-1.36)#3,856 |
| 18. | Fillmore | 2.88% | 1.77%(+1.11)#18 | 4.26%(-1.38)#3,886 |
| 19. | Cottonwood Heights | 2.79% | 1.77%(+1.02)#19 | 4.26%(-1.47)#3,994 |
| 20. | Liberty | 2.63% | 1.77%(+0.862)#20 | 4.26%(-1.63)#4,196 |
| 21. | Leeds | 2.63% | 1.77%(+0.862)#21 | 4.26%(-1.63)#4,199 |
| 22. | Dugway | 2.54% | 1.77%(+0.768)#22 | 4.26%(-1.72)#4,354 |
| 23. | Naples | 2.46% | 1.77%(+0.694)#23 | 4.26%(-1.80)#4,478 |
| 24. | Logan | 2.32% | 1.77%(+0.548)#24 | 4.26%(-1.94)#4,743 |
| 25. | Clearfield | 2.27% | 1.77%(+0.501)#25 | 4.26%(-1.99)#4,836 |
| 26. | Emigration Canyon | 2.26% | 1.77%(+0.492)#26 | 4.26%(-2.00)#4,850 |
| 27. | Montezuma Creek | 2.21% | 1.77%(+0.436)#27 | 4.26%(-2.05)#4,950 |
| 28. | Clinton | 2.10% | 1.77%(+0.325)#28 | 4.26%(-2.17)#5,171 |
| 29. | Herriman | 2.09% | 1.77%(+0.324)#29 | 4.26%(-2.17)#5,174 |
| 30. | Holladay | 2.09% | 1.77%(+0.318)#30 | 4.26%(-2.17)#5,188 |
| 31. | West Jordan | 2.01% | 1.77%(+0.245)#31 | 4.26%(-2.25)#5,319 |
| 32. | Delta | 2.01% | 1.77%(+0.238)#32 | 4.26%(-2.25)#5,336 |
| 33. | Pleasant View | 1.96% | 1.77%(+0.186)#33 | 4.26%(-2.30)#5,456 |
| 34. | Provo | 1.80% | 1.77%(+0.026)#34 | 4.26%(-2.46)#5,811 |
| 35. | Apple Valley | 1.78% | 1.77%(+0.014)#35 | 4.26%(-2.48)#5,840 |
| 36. | Wolf Creek | 1.77% | 1.77%(-0.004)#36 | 4.26%(-2.49)#5,876 |
| 37. | Heber | 1.74% | 1.77%(-0.035)#37 | 4.26%(-2.53)#5,956 |
| 38. | South Ogden | 1.72% | 1.77%(-0.053)#38 | 4.26%(-2.54)#6,009 |
| 39. | Lynndyl | 1.68% | 1.77%(-0.089)#39 | 4.26%(-2.58)#6,107 |
| 40. | West Wood | 1.65% | 1.77%(-0.115)#40 | 4.26%(-2.61)#6,164 |
| 41. | Lehi | 1.61% | 1.77%(-0.162)#41 | 4.26%(-2.65)#6,292 |
| 42. | Vineyard | 1.48% | 1.77%(-0.285)#42 | 4.26%(-2.78)#6,653 |
| 43. | Riverton | 1.45% | 1.77%(-0.323)#43 | 4.26%(-2.81)#6,745 |
| 44. | Kearns | 1.43% | 1.77%(-0.340)#44 | 4.26%(-2.83)#6,806 |
| 45. | Orem | 1.39% | 1.77%(-0.380)#45 | 4.26%(-2.87)#6,925 |
| 46. | Farmington | 1.36% | 1.77%(-0.413)#46 | 4.26%(-2.90)#7,026 |
| 47. | West Point | 1.35% | 1.77%(-0.425)#47 | 4.26%(-2.92)#7,067 |
| 48. | American Fork | 1.30% | 1.77%(-0.472)#48 | 4.26%(-2.96)#7,241 |
| 49. | Huntsville | 1.25% | 1.77%(-0.520)#49 | 4.26%(-3.01)#7,409 |
| 50. | Lindon | 1.20% | 1.77%(-0.568)#50 | 4.26%(-3.06)#7,581 |
| 51. | White | 1.17% | 1.77%(-0.601)#51 | 4.26%(-3.09)#7,721 |
| 52. | Vernal | 1.12% | 1.77%(-0.646)#52 | 4.26%(-3.14)#7,900 |
| 53. | Layton | 1.07% | 1.77%(-0.696)#53 | 4.26%(-3.19)#8,094 |
| 54. | Woodland Hills | 1.05% | 1.77%(-0.716)#54 | 4.26%(-3.21)#8,174 |
| 55. | South Weber | 1.05% | 1.77%(-0.724)#55 | 4.26%(-3.21)#8,207 |
| 56. | West Haven | 1.04% | 1.77%(-0.728)#56 | 4.26%(-3.22)#8,217 |
| 57. | Bountiful | 1.04% | 1.77%(-0.729)#57 | 4.26%(-3.22)#8,219 |
| 58. | Farr West | 1.03% | 1.77%(-0.737)#58 | 4.26%(-3.23)#8,261 |
| 59. | Ephraim | 1.03% | 1.77%(-0.742)#59 | 4.26%(-3.23)#8,286 |
| 60. | Ogden | 1.02% | 1.77%(-0.753)#60 | 4.26%(-3.24)#8,330 |
| 61. | Nibley | 0.98% | 1.77%(-0.793)#61 | 4.26%(-3.28)#8,490 |
| 62. | Cedar City | 0.97% | 1.77%(-0.804)#62 | 4.26%(-3.29)#8,550 |
| 63. | Summit Park | 0.91% | 1.77%(-0.863)#63 | 4.26%(-3.35)#8,814 |
| 64. | Bear River City | 0.90% | 1.77%(-0.871)#64 | 4.26%(-3.36)#8,853 |
| 65. | Roy | 0.90% | 1.77%(-0.871)#65 | 4.26%(-3.36)#8,855 |
| 66. | Elsinore | 0.89% | 1.77%(-0.882)#66 | 4.26%(-3.37)#8,902 |
| 67. | Millville | 0.88% | 1.77%(-0.894)#67 | 4.26%(-3.38)#8,952 |
| 68. | Kaysville | 0.87% | 1.77%(-0.896)#68 | 4.26%(-3.39)#8,958 |
| 69. | Cornish | 0.85% | 1.77%(-0.922)#69 | 4.26%(-3.41)#9,092 |
| 70. | Hyrum | 0.83% | 1.77%(-0.943)#70 | 4.26%(-3.43)#9,181 |
| 71. | Francis | 0.83% | 1.77%(-0.943)#71 | 4.26%(-3.43)#9,182 |
| 72. | Pleasant Grove | 0.83% | 1.77%(-0.945)#72 | 4.26%(-3.44)#9,186 |
| 73. | Washington | 0.81% | 1.77%(-0.961)#73 | 4.26%(-3.45)#9,263 |
| 74. | Moroni | 0.79% | 1.77%(-0.976)#74 | 4.26%(-3.47)#9,343 |
| 75. | Saratoga Springs | 0.78% | 1.77%(-0.992)#75 | 4.26%(-3.48)#9,425 |
| 76. | St George | 0.78% | 1.77%(-0.994)#76 | 4.26%(-3.48)#9,432 |
| 77. | Grantsville | 0.77% | 1.77%(-0.997)#77 | 4.26%(-3.49)#9,448 |
| 78. | Gunnison | 0.77% | 1.77%(-1.00)#78 | 4.26%(-3.49)#9,473 |
| 79. | Ivins | 0.76% | 1.77%(-1.01)#79 | 4.26%(-3.50)#9,494 |
| 80. | Oakley | 0.75% | 1.77%(-1.02)#80 | 4.26%(-3.51)#9,598 |
| 81. | Elk Ridge | 0.73% | 1.77%(-1.04)#81 | 4.26%(-3.53)#9,668 |
| 82. | Santa Clara | 0.71% | 1.77%(-1.06)#82 | 4.26%(-3.55)#9,779 |
| 83. | Willard | 0.68% | 1.77%(-1.09)#83 | 4.26%(-3.58)#9,920 |
| 84. | Cedar Hills | 0.65% | 1.77%(-1.12)#84 | 4.26%(-3.61)#10,114 |
| 85. | Kanosh | 0.64% | 1.77%(-1.13)#85 | 4.26%(-3.62)#10,161 |
| 86. | Alpine | 0.57% | 1.77%(-1.20)#86 | 4.26%(-3.70)#10,612 |
| 87. | Central Valley | 0.56% | 1.77%(-1.21)#87 | 4.26%(-3.70)#10,643 |
| 88. | Woods Cross | 0.56% | 1.77%(-1.21)#88 | 4.26%(-3.70)#10,652 |
| 89. | River Heights | 0.54% | 1.77%(-1.23)#89 | 4.26%(-3.72)#10,806 |
| 90. | Price | 0.53% | 1.77%(-1.24)#90 | 4.26%(-3.73)#10,874 |
| 91. | Bluffdale | 0.52% | 1.77%(-1.25)#91 | 4.26%(-3.74)#10,904 |
| 92. | Mount Pleasant | 0.52% | 1.77%(-1.25)#92 | 4.26%(-3.74)#10,927 |
| 93. | Sunset | 0.51% | 1.77%(-1.26)#93 | 4.26%(-3.75)#10,953 |
| 94. | Elwood | 0.50% | 1.77%(-1.27)#94 | 4.26%(-3.76)#11,055 |
| 95. | East Basin | 0.49% | 1.77%(-1.28)#95 | 4.26%(-3.77)#11,099 |
| 96. | Providence | 0.49% | 1.77%(-1.28)#96 | 4.26%(-3.77)#11,141 |
| 97. | Centerville | 0.47% | 1.77%(-1.30)#97 | 4.26%(-3.79)#11,251 |
| 98. | Silver Summit | 0.47% | 1.77%(-1.30)#98 | 4.26%(-3.79)#11,267 |
| 99. | Payson | 0.46% | 1.77%(-1.31)#99 | 4.26%(-3.81)#11,360 |
| 100. | Springville | 0.45% | 1.77%(-1.32)#100 | 4.26%(-3.81)#11,364 |
Common Questions
What are the Top 10 Cities with the Highest Percentage of Immigrants from Asia in Utah?
Top 10 Cities with the Highest Percentage of Immigrants from Asia in Utah are:
#1
45.85%
#2
6.37%
#3
5.93%
#4
4.58%
#5
4.44%
#6
4.29%
#7
4.17%
#8
3.86%
#9
3.86%
#10
3.72%
What city has the Highest Percentage of Immigrants from Asia in Utah?
Bryce Canyon City has the Highest Percentage of Immigrants from Asia in Utah with 45.85%.
What is the Percentage of Immigrants from Asia in the State of Utah?
Percentage of Immigrants from Asia in Utah is 1.77%.
What is the Percentage of Immigrants from Asia in the United States?
Percentage of Immigrants from Asia in the United States is 4.26%.