Cities with the Highest Percentage of Immigrants from Asia in Minnesota
RELATED REPORTS & OPTIONS
Asia
Minnesota
Compare Cities
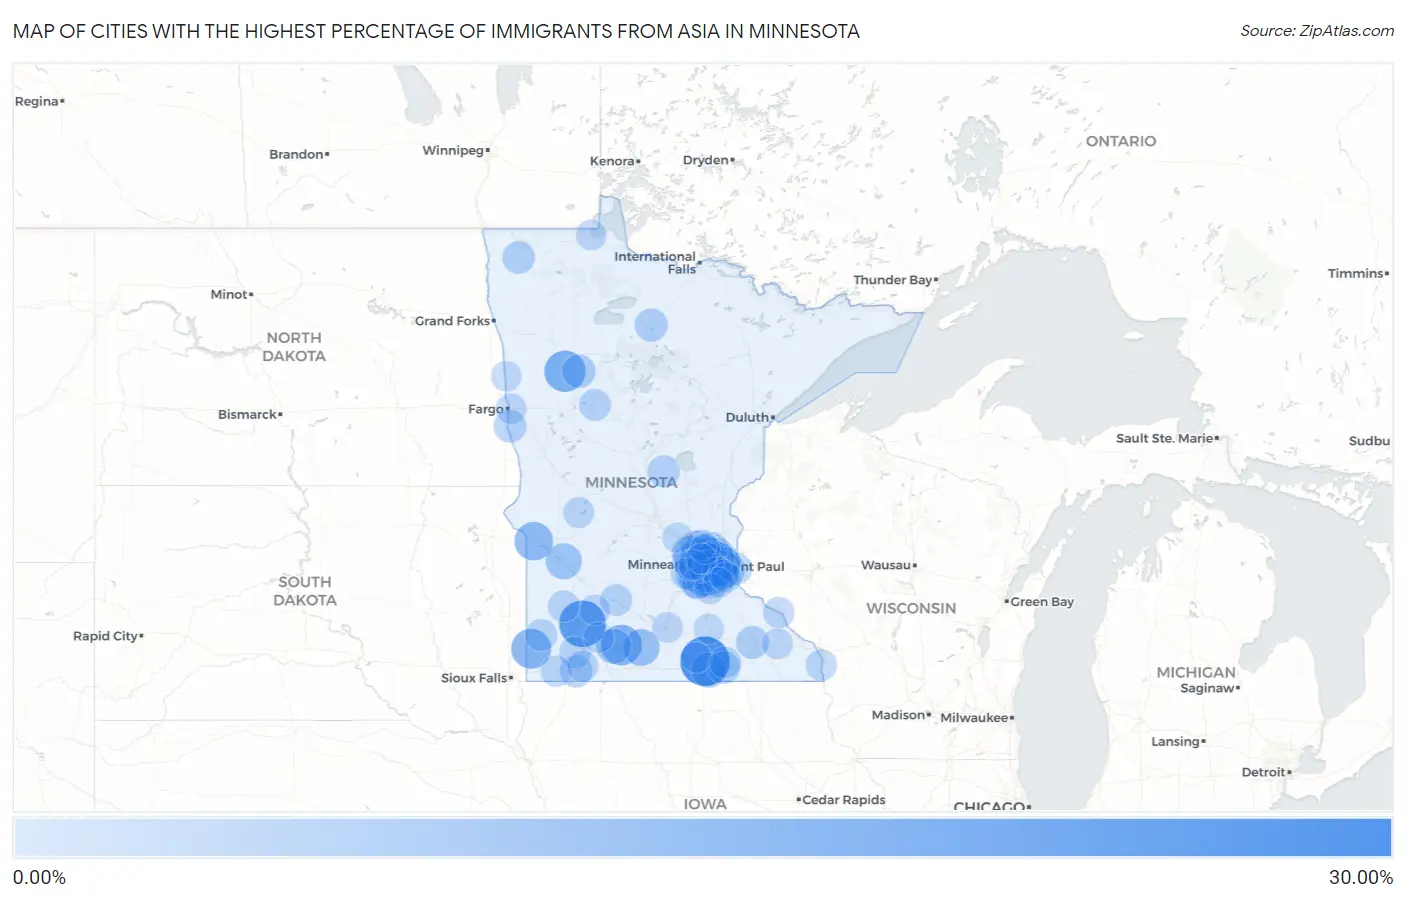
Map of Cities with the Highest Percentage of Immigrants from Asia in Minnesota
0.00%
30.00%
Cities with the Highest Percentage of Immigrants from Asia in Minnesota
| City | Asia | vs State | vs National | |
| 1. | Clarks Grove | 25.47% | 3.11%(+22.4)#1 | 4.26%(+21.2)#160 |
| 2. | Walnut Grove | 22.07% | 3.11%(+19.0)#2 | 4.26%(+17.8)#230 |
| 3. | Midway | 15.62% | 3.11%(+12.5)#3 | 4.26%(+11.4)#448 |
| 4. | Butterfield | 14.80% | 3.11%(+11.7)#4 | 4.26%(+10.5)#498 |
| 5. | Ihlen | 14.08% | 3.11%(+11.0)#5 | 4.26%(+9.82)#534 |
| 6. | Odessa | 12.37% | 3.11%(+9.26)#6 | 4.26%(+8.11)#654 |
| 7. | Pickwick | 10.56% | 3.11%(+7.45)#7 | 4.26%(+6.30)#839 |
| 8. | Lauderdale | 10.27% | 3.11%(+7.16)#8 | 4.26%(+6.01)#882 |
| 9. | Lewisville | 10.26% | 3.11%(+7.15)#9 | 4.26%(+6.00)#884 |
| 10. | Falcon Heights | 10.21% | 3.11%(+7.10)#10 | 4.26%(+5.95)#895 |
| 11. | St Paul | 9.83% | 3.11%(+6.72)#11 | 4.26%(+5.57)#946 |
| 12. | Corcoran | 9.60% | 3.11%(+6.50)#12 | 4.26%(+5.34)#972 |
| 13. | Watson | 9.42% | 3.11%(+6.31)#13 | 4.26%(+5.16)#997 |
| 14. | Eden Prairie | 9.16% | 3.11%(+6.05)#14 | 4.26%(+4.90)#1,037 |
| 15. | Maplewood | 9.00% | 3.11%(+5.89)#15 | 4.26%(+4.74)#1,065 |
| 16. | Brooklyn Park | 8.50% | 3.11%(+5.39)#16 | 4.26%(+4.24)#1,168 |
| 17. | Hayward | 8.33% | 3.11%(+5.22)#17 | 4.26%(+4.07)#1,201 |
| 18. | Mountain Lake | 8.26% | 3.11%(+5.15)#18 | 4.26%(+4.00)#1,213 |
| 19. | North St Paul | 7.97% | 3.11%(+4.86)#19 | 4.26%(+3.71)#1,271 |
| 20. | Plymouth | 7.68% | 3.11%(+4.57)#20 | 4.26%(+3.42)#1,334 |
| 21. | Woodbury | 7.44% | 3.11%(+4.33)#21 | 4.26%(+3.18)#1,387 |
| 22. | Shoreview | 7.01% | 3.11%(+3.90)#22 | 4.26%(+2.75)#1,497 |
| 23. | Medina | 6.92% | 3.11%(+3.81)#23 | 4.26%(+2.66)#1,530 |
| 24. | Shakopee | 6.91% | 3.11%(+3.80)#24 | 4.26%(+2.65)#1,535 |
| 25. | Hilltop | 6.67% | 3.11%(+3.56)#25 | 4.26%(+2.41)#1,608 |
| 26. | Eagan | 6.60% | 3.11%(+3.49)#26 | 4.26%(+2.34)#1,623 |
| 27. | Blaine | 6.46% | 3.11%(+3.35)#27 | 4.26%(+2.20)#1,654 |
| 28. | Roy Lake | 6.45% | 3.11%(+3.34)#28 | 4.26%(+2.19)#1,660 |
| 29. | Little Canada | 6.18% | 3.11%(+3.07)#29 | 4.26%(+1.92)#1,738 |
| 30. | Northome | 6.02% | 3.11%(+2.91)#30 | 4.26%(+1.76)#1,784 |
| 31. | Rochester | 5.77% | 3.11%(+2.66)#31 | 4.26%(+1.51)#1,886 |
| 32. | Minnetonka | 5.70% | 3.11%(+2.59)#32 | 4.26%(+1.44)#1,909 |
| 33. | Edina | 5.47% | 3.11%(+2.36)#33 | 4.26%(+1.21)#2,001 |
| 34. | Austin | 5.42% | 3.11%(+2.31)#34 | 4.26%(+1.16)#2,015 |
| 35. | Halma | 5.41% | 3.11%(+2.30)#35 | 4.26%(+1.15)#2,022 |
| 36. | Brooklyn Center | 5.39% | 3.11%(+2.28)#36 | 4.26%(+1.13)#2,030 |
| 37. | Comstock | 5.33% | 3.11%(+2.22)#37 | 4.26%(+1.07)#2,053 |
| 38. | Worthington | 5.21% | 3.11%(+2.10)#38 | 4.26%(+0.950)#2,100 |
| 39. | Golden Valley | 5.07% | 3.11%(+1.96)#39 | 4.26%(+0.807)#2,168 |
| 40. | St Anthony City Hennepin And Ramsey Counties | 5.05% | 3.11%(+1.94)#40 | 4.26%(+0.787)#2,174 |
| 41. | North Oaks | 5.05% | 3.11%(+1.94)#41 | 4.26%(+0.785)#2,177 |
| 42. | Harding | 5.04% | 3.11%(+1.93)#42 | 4.26%(+0.776)#2,181 |
| 43. | Roseville | 5.03% | 3.11%(+1.92)#43 | 4.26%(+0.767)#2,184 |
| 44. | Mounds View | 4.98% | 3.11%(+1.87)#44 | 4.26%(+0.717)#2,206 |
| 45. | Maple Grove | 4.95% | 3.11%(+1.84)#45 | 4.26%(+0.690)#2,224 |
| 46. | Franklin | 4.81% | 3.11%(+1.71)#46 | 4.26%(+0.554)#2,297 |
| 47. | Spring Lake Park | 4.78% | 3.11%(+1.67)#47 | 4.26%(+0.520)#2,315 |
| 48. | Osage | 4.74% | 3.11%(+1.63)#48 | 4.26%(+0.479)#2,335 |
| 49. | Holland | 4.69% | 3.11%(+1.58)#49 | 4.26%(+0.433)#2,370 |
| 50. | Landfall | 4.68% | 3.11%(+1.57)#50 | 4.26%(+0.419)#2,377 |
| 51. | Richfield | 4.65% | 3.11%(+1.54)#51 | 4.26%(+0.385)#2,390 |
| 52. | Burnsville | 4.59% | 3.11%(+1.48)#52 | 4.26%(+0.328)#2,422 |
| 53. | Fulda | 4.58% | 3.11%(+1.47)#53 | 4.26%(+0.315)#2,434 |
| 54. | Chanhassen | 4.40% | 3.11%(+1.29)#54 | 4.26%(+0.143)#2,533 |
| 55. | Lansing | 4.40% | 3.11%(+1.29)#55 | 4.26%(+0.142)#2,535 |
| 56. | Apple Valley | 4.39% | 3.11%(+1.28)#56 | 4.26%(+0.127)#2,543 |
| 57. | Savage | 4.36% | 3.11%(+1.25)#57 | 4.26%(+0.101)#2,556 |
| 58. | Lake St Croix Beach | 4.34% | 3.11%(+1.23)#58 | 4.26%(+0.080)#2,580 |
| 59. | Dayton | 4.30% | 3.11%(+1.19)#59 | 4.26%(+0.039)#2,609 |
| 60. | Marshall | 4.21% | 3.11%(+1.10)#60 | 4.26%(-0.054)#2,688 |
| 61. | Oakdale | 4.19% | 3.11%(+1.08)#61 | 4.26%(-0.072)#2,698 |
| 62. | Newport | 4.11% | 3.11%(+0.998)#62 | 4.26%(-0.153)#2,753 |
| 63. | Bloomington | 4.09% | 3.11%(+0.977)#63 | 4.26%(-0.174)#2,773 |
| 64. | Adrian | 3.97% | 3.11%(+0.861)#64 | 4.26%(-0.290)#2,845 |
| 65. | Hopkins | 3.90% | 3.11%(+0.789)#65 | 4.26%(-0.362)#2,889 |
| 66. | Victoria | 3.89% | 3.11%(+0.776)#66 | 4.26%(-0.375)#2,901 |
| 67. | Orono | 3.88% | 3.11%(+0.770)#67 | 4.26%(-0.381)#2,904 |
| 68. | Arden Hills | 3.88% | 3.11%(+0.766)#68 | 4.26%(-0.385)#2,912 |
| 69. | Wabasha | 3.83% | 3.11%(+0.719)#69 | 4.26%(-0.432)#2,952 |
| 70. | Vadnais Heights | 3.82% | 3.11%(+0.707)#70 | 4.26%(-0.444)#2,962 |
| 71. | Brewster | 3.73% | 3.11%(+0.622)#71 | 4.26%(-0.529)#3,034 |
| 72. | New Brighton | 3.67% | 3.11%(+0.559)#72 | 4.26%(-0.592)#3,074 |
| 73. | Brownsville | 3.63% | 3.11%(+0.521)#73 | 4.26%(-0.629)#3,116 |
| 74. | Starbuck | 3.62% | 3.11%(+0.515)#74 | 4.26%(-0.635)#3,126 |
| 75. | Lilydale | 3.55% | 3.11%(+0.439)#75 | 4.26%(-0.712)#3,192 |
| 76. | Prior Lake | 3.51% | 3.11%(+0.397)#76 | 4.26%(-0.754)#3,219 |
| 77. | Columbia Heights | 3.47% | 3.11%(+0.360)#77 | 4.26%(-0.791)#3,248 |
| 78. | Minneapolis | 3.46% | 3.11%(+0.348)#78 | 4.26%(-0.803)#3,259 |
| 79. | St Louis Park | 3.44% | 3.11%(+0.329)#79 | 4.26%(-0.822)#3,286 |
| 80. | Sunfish Lake | 3.44% | 3.11%(+0.326)#80 | 4.26%(-0.825)#3,290 |
| 81. | Lakeville | 3.42% | 3.11%(+0.309)#81 | 4.26%(-0.841)#3,305 |
| 82. | Hartland | 3.37% | 3.11%(+0.258)#82 | 4.26%(-0.892)#3,360 |
| 83. | Mankato | 3.37% | 3.11%(+0.257)#83 | 4.26%(-0.894)#3,361 |
| 84. | Anoka | 3.33% | 3.11%(+0.222)#84 | 4.26%(-0.929)#3,402 |
| 85. | St Charles | 3.27% | 3.11%(+0.158)#85 | 4.26%(-0.993)#3,454 |
| 86. | Warroad | 3.23% | 3.11%(+0.118)#86 | 4.26%(-1.03)#3,501 |
| 87. | St. John's University | 3.23% | 3.11%(+0.116)#87 | 4.26%(-1.03)#3,503 |
| 88. | Wabasso | 3.22% | 3.11%(+0.106)#88 | 4.26%(-1.04)#3,514 |
| 89. | Moorhead | 3.20% | 3.11%(+0.095)#89 | 4.26%(-1.06)#3,519 |
| 90. | Marion | 3.18% | 3.11%(+0.074)#90 | 4.26%(-1.08)#3,535 |
| 91. | St Paul Park | 3.13% | 3.11%(+0.020)#91 | 4.26%(-1.13)#3,601 |
| 92. | Jeffers | 3.09% | 3.11%(-0.023)#92 | 4.26%(-1.17)#3,644 |
| 93. | Cottage Grove | 3.06% | 3.11%(-0.054)#93 | 4.26%(-1.20)#3,683 |
| 94. | Hendrum | 3.05% | 3.11%(-0.061)#94 | 4.26%(-1.21)#3,689 |
| 95. | Wayzata | 2.93% | 3.11%(-0.177)#95 | 4.26%(-1.33)#3,819 |
| 96. | Monticello | 2.89% | 3.11%(-0.223)#96 | 4.26%(-1.37)#3,872 |
| 97. | Coon Rapids | 2.88% | 3.11%(-0.229)#97 | 4.26%(-1.38)#3,882 |
| 98. | New Hope | 2.82% | 3.11%(-0.288)#98 | 4.26%(-1.44)#3,953 |
| 99. | Medford | 2.78% | 3.11%(-0.327)#99 | 4.26%(-1.48)#4,006 |
| 100. | Rosemount | 2.70% | 3.11%(-0.413)#100 | 4.26%(-1.56)#4,111 |
Common Questions
What are the Top 10 Cities with the Highest Percentage of Immigrants from Asia in Minnesota?
Top 10 Cities with the Highest Percentage of Immigrants from Asia in Minnesota are:
#1
25.47%
#2
22.07%
#3
15.62%
#4
14.80%
#5
14.08%
#6
12.37%
#7
10.27%
#8
10.26%
#9
10.21%
#10
9.83%
What city has the Highest Percentage of Immigrants from Asia in Minnesota?
Clarks Grove has the Highest Percentage of Immigrants from Asia in Minnesota with 25.47%.
What is the Percentage of Immigrants from Asia in the State of Minnesota?
Percentage of Immigrants from Asia in Minnesota is 3.11%.
What is the Percentage of Immigrants from Asia in the United States?
Percentage of Immigrants from Asia in the United States is 4.26%.