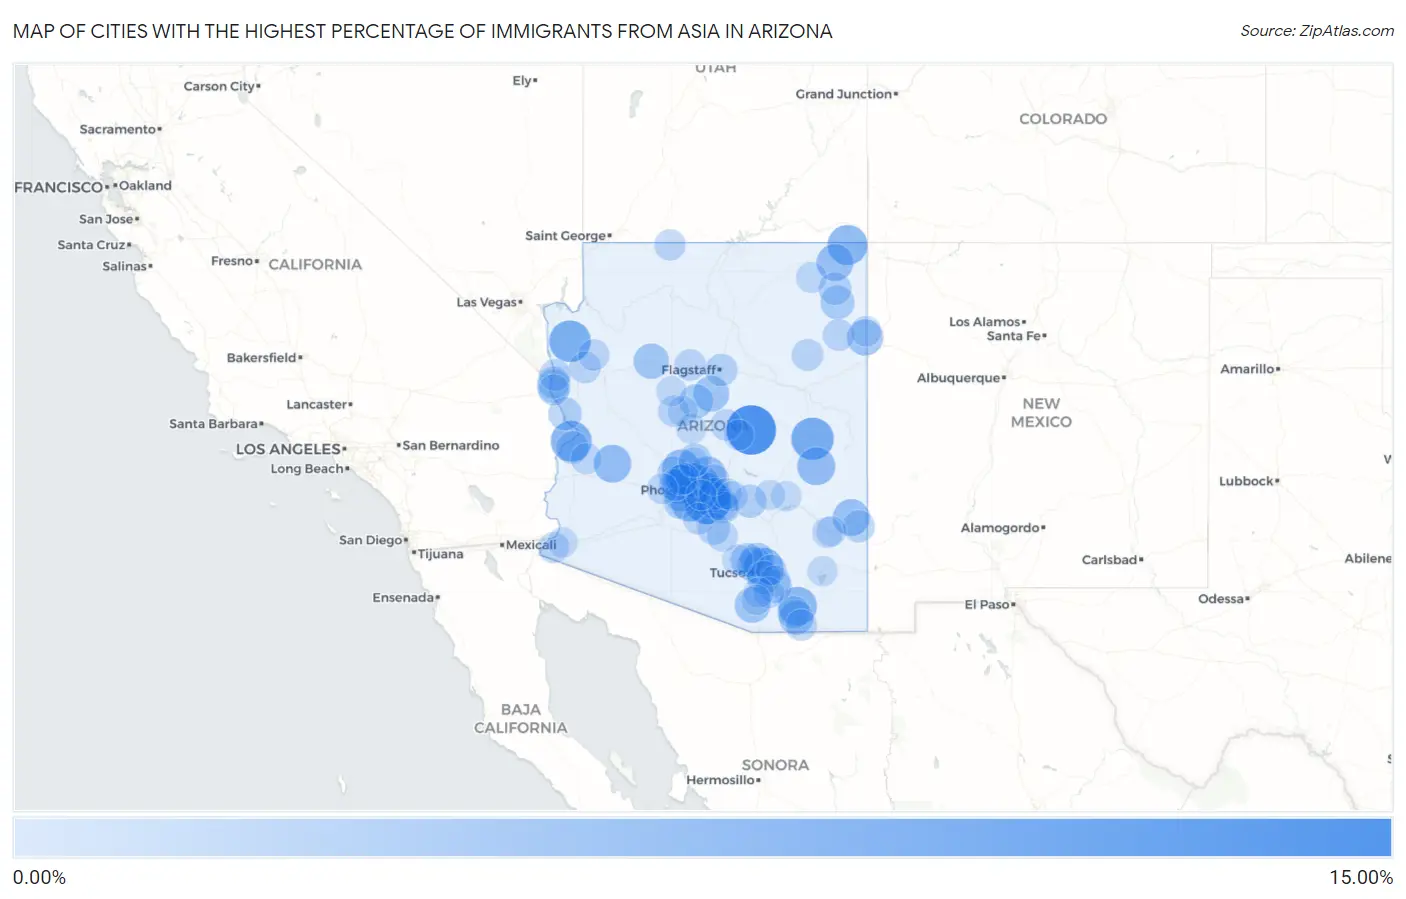
Cities with the Highest Percentage of Immigrants from Asia in Arizona
RELATED REPORTS & OPTIONS
Asia
Arizona
Compare Cities
Map of Cities with the Highest Percentage of Immigrants from Asia in Arizona
0.00%
15.00%
Cities with the Highest Percentage of Immigrants from Asia in Arizona
| City | Asia | vs State | vs National | |
| 1. | Kohls Ranch | 10.96% | 2.67%(+8.29)#1 | 4.26%(+6.70)#789 |
| 2. | Greenehaven | 9.95% | 2.67%(+7.28)#2 | 4.26%(+5.69)#934 |
| 3. | Chandler | 9.00% | 2.67%(+6.33)#3 | 4.26%(+4.74)#1,070 |
| 4. | Tempe | 7.22% | 2.67%(+4.55)#4 | 4.26%(+2.96)#1,444 |
| 5. | Wagon Wheel | 7.18% | 2.67%(+4.51)#5 | 4.26%(+2.92)#1,455 |
| 6. | Dolan Springs | 6.73% | 2.67%(+4.06)#6 | 4.26%(+2.47)#1,585 |
| 7. | Bluewater | 6.32% | 2.67%(+3.65)#7 | 4.26%(+2.06)#1,702 |
| 8. | Red Mesa | 5.87% | 2.67%(+3.20)#8 | 4.26%(+1.61)#1,839 |
| 9. | Catalina Foothills | 5.54% | 2.67%(+2.87)#9 | 4.26%(+1.28)#1,968 |
| 10. | Whetstone | 5.29% | 2.67%(+2.62)#10 | 4.26%(+1.03)#2,072 |
| 11. | Peoria | 5.02% | 2.67%(+2.35)#11 | 4.26%(+0.763)#2,187 |
| 12. | Gila Crossing | 4.87% | 2.67%(+2.20)#12 | 4.26%(+0.610)#2,266 |
| 13. | Turkey Creek | 4.81% | 2.67%(+2.14)#13 | 4.26%(+0.554)#2,298 |
| 14. | Wenden | 4.69% | 2.67%(+2.02)#14 | 4.26%(+0.430)#2,371 |
| 15. | Scottsdale | 4.36% | 2.67%(+1.70)#15 | 4.26%(+0.104)#2,555 |
| 16. | Gilbert | 4.35% | 2.67%(+1.68)#16 | 4.26%(+0.090)#2,566 |
| 17. | Rock Point | 4.29% | 2.67%(+1.63)#17 | 4.26%(+0.034)#2,612 |
| 18. | Youngtown | 4.28% | 2.67%(+1.61)#18 | 4.26%(+0.023)#2,623 |
| 19. | Morenci | 4.23% | 2.67%(+1.56)#19 | 4.26%(-0.034)#2,669 |
| 20. | Paradise Valley | 4.10% | 2.67%(+1.43)#20 | 4.26%(-0.165)#2,766 |
| 21. | St Michaels | 3.88% | 2.67%(+1.21)#21 | 4.26%(-0.384)#2,910 |
| 22. | Glendale | 3.73% | 2.67%(+1.06)#22 | 4.26%(-0.527)#3,032 |
| 23. | Sedona | 3.72% | 2.67%(+1.05)#23 | 4.26%(-0.543)#3,043 |
| 24. | Litchfield Park | 3.69% | 2.67%(+1.03)#24 | 4.26%(-0.566)#3,062 |
| 25. | Arivaca Junction | 3.63% | 2.67%(+0.961)#25 | 4.26%(-0.630)#3,117 |
| 26. | Casas Adobes | 3.52% | 2.67%(+0.852)#26 | 4.26%(-0.739)#3,208 |
| 27. | Seligman | 3.51% | 2.67%(+0.837)#27 | 4.26%(-0.754)#3,217 |
| 28. | Oak Creek Canyon | 3.44% | 2.67%(+0.766)#28 | 4.26%(-0.825)#3,291 |
| 29. | Sierra Vista | 3.10% | 2.67%(+0.427)#29 | 4.26%(-1.16)#3,635 |
| 30. | Phoenix | 3.05% | 2.67%(+0.386)#30 | 4.26%(-1.21)#3,685 |
| 31. | Oro Valley | 2.93% | 2.67%(+0.262)#31 | 4.26%(-1.33)#3,822 |
| 32. | Clarkdale | 2.78% | 2.67%(+0.114)#32 | 4.26%(-1.48)#4,004 |
| 33. | Chinle | 2.70% | 2.67%(+0.032)#33 | 4.26%(-1.56)#4,104 |
| 34. | Avondale | 2.64% | 2.67%(-0.028)#34 | 4.26%(-1.62)#4,185 |
| 35. | Marana | 2.60% | 2.67%(-0.073)#35 | 4.26%(-1.66)#4,256 |
| 36. | Vail | 2.55% | 2.67%(-0.118)#36 | 4.26%(-1.71)#4,329 |
| 37. | Tucson | 2.46% | 2.67%(-0.213)#37 | 4.26%(-1.80)#4,485 |
| 38. | Mesquite Creek | 2.43% | 2.67%(-0.240)#38 | 4.26%(-1.83)#4,538 |
| 39. | Superior | 2.43% | 2.67%(-0.244)#39 | 4.26%(-1.84)#4,548 |
| 40. | Desert Hills | 2.41% | 2.67%(-0.255)#40 | 4.26%(-1.85)#4,575 |
| 41. | New River | 2.31% | 2.67%(-0.362)#41 | 4.26%(-1.95)#4,763 |
| 42. | Parker | 2.17% | 2.67%(-0.495)#42 | 4.26%(-2.09)#5,007 |
| 43. | Many Farms | 2.16% | 2.67%(-0.505)#43 | 4.26%(-2.10)#5,031 |
| 44. | Goodyear | 2.10% | 2.67%(-0.565)#44 | 4.26%(-2.16)#5,158 |
| 45. | Huachuca City | 2.04% | 2.67%(-0.632)#45 | 4.26%(-2.22)#5,276 |
| 46. | Flagstaff | 1.97% | 2.67%(-0.696)#46 | 4.26%(-2.29)#5,411 |
| 47. | Casa Grande | 1.90% | 2.67%(-0.770)#47 | 4.26%(-2.36)#5,581 |
| 48. | York | 1.89% | 2.67%(-0.774)#48 | 4.26%(-2.37)#5,590 |
| 49. | Surprise | 1.84% | 2.67%(-0.834)#49 | 4.26%(-2.43)#5,719 |
| 50. | Queen Creek | 1.81% | 2.67%(-0.858)#50 | 4.26%(-2.45)#5,769 |
| 51. | Fort Mohave | 1.75% | 2.67%(-0.923)#51 | 4.26%(-2.51)#5,930 |
| 52. | Citrus Park | 1.71% | 2.67%(-0.963)#52 | 4.26%(-2.55)#6,042 |
| 53. | Mesa | 1.70% | 2.67%(-0.971)#53 | 4.26%(-2.56)#6,063 |
| 54. | Indian Wells | 1.68% | 2.67%(-0.988)#54 | 4.26%(-2.58)#6,104 |
| 55. | Ganado | 1.63% | 2.67%(-1.04)#55 | 4.26%(-2.63)#6,243 |
| 56. | Kingman | 1.56% | 2.67%(-1.11)#56 | 4.26%(-2.70)#6,408 |
| 57. | Bullhead City | 1.54% | 2.67%(-1.13)#57 | 4.26%(-2.72)#6,473 |
| 58. | Williams | 1.53% | 2.67%(-1.14)#58 | 4.26%(-2.73)#6,516 |
| 59. | Maricopa | 1.50% | 2.67%(-1.17)#59 | 4.26%(-2.76)#6,590 |
| 60. | San Tan Valley | 1.50% | 2.67%(-1.17)#60 | 4.26%(-2.76)#6,593 |
| 61. | Strawberry | 1.50% | 2.67%(-1.17)#61 | 4.26%(-2.76)#6,613 |
| 62. | Bellemont | 1.49% | 2.67%(-1.18)#62 | 4.26%(-2.77)#6,630 |
| 63. | Sierra Vista Southeast | 1.47% | 2.67%(-1.20)#63 | 4.26%(-2.79)#6,682 |
| 64. | Valle Vista | 1.44% | 2.67%(-1.23)#64 | 4.26%(-2.82)#6,761 |
| 65. | Prescott | 1.42% | 2.67%(-1.24)#65 | 4.26%(-2.84)#6,821 |
| 66. | Tucson Mountains | 1.42% | 2.67%(-1.25)#66 | 4.26%(-2.84)#6,827 |
| 67. | Fredonia | 1.39% | 2.67%(-1.28)#67 | 4.26%(-2.87)#6,931 |
| 68. | Fountain Hills | 1.38% | 2.67%(-1.29)#68 | 4.26%(-2.88)#6,943 |
| 69. | Sun City | 1.31% | 2.67%(-1.36)#69 | 4.26%(-2.95)#7,192 |
| 70. | El Mirage | 1.30% | 2.67%(-1.37)#70 | 4.26%(-2.96)#7,248 |
| 71. | Rincon Valley | 1.30% | 2.67%(-1.37)#71 | 4.26%(-2.96)#7,249 |
| 72. | Eloy | 1.29% | 2.67%(-1.38)#72 | 4.26%(-2.97)#7,256 |
| 73. | Corona De Tucson | 1.29% | 2.67%(-1.38)#73 | 4.26%(-2.97)#7,261 |
| 74. | Yuma | 1.29% | 2.67%(-1.38)#74 | 4.26%(-2.97)#7,272 |
| 75. | Apache Junction | 1.29% | 2.67%(-1.38)#75 | 4.26%(-2.97)#7,274 |
| 76. | Mohave Valley | 1.28% | 2.67%(-1.38)#76 | 4.26%(-2.98)#7,287 |
| 77. | Buckeye | 1.28% | 2.67%(-1.38)#77 | 4.26%(-2.98)#7,288 |
| 78. | Bouse | 1.27% | 2.67%(-1.40)#78 | 4.26%(-2.99)#7,350 |
| 79. | Avra Valley | 1.18% | 2.67%(-1.49)#79 | 4.26%(-3.08)#7,679 |
| 80. | Chilchinbito | 1.18% | 2.67%(-1.49)#80 | 4.26%(-3.08)#7,681 |
| 81. | Circle | 1.16% | 2.67%(-1.50)#81 | 4.26%(-3.10)#7,737 |
| 82. | Thatcher | 1.12% | 2.67%(-1.55)#82 | 4.26%(-3.14)#7,928 |
| 83. | Payson | 1.10% | 2.67%(-1.57)#83 | 4.26%(-3.16)#7,984 |
| 84. | Timberline-Fernwood | 1.08% | 2.67%(-1.59)#84 | 4.26%(-3.18)#8,068 |
| 85. | Fort Defiance | 1.08% | 2.67%(-1.59)#85 | 4.26%(-3.18)#8,087 |
| 86. | Tanque Verde | 1.07% | 2.67%(-1.60)#86 | 4.26%(-3.19)#8,097 |
| 87. | Guadalupe | 1.07% | 2.67%(-1.60)#87 | 4.26%(-3.19)#8,113 |
| 88. | Gold Canyon | 1.02% | 2.67%(-1.65)#88 | 4.26%(-3.24)#8,317 |
| 89. | Red Rock Cdp Pinal County | 1.01% | 2.67%(-1.66)#89 | 4.26%(-3.25)#8,361 |
| 90. | Spring Valley | 0.99% | 2.67%(-1.68)#90 | 4.26%(-3.27)#8,431 |
| 91. | Prescott Valley | 0.96% | 2.67%(-1.71)#91 | 4.26%(-3.30)#8,586 |
| 92. | Paulden | 0.95% | 2.67%(-1.72)#92 | 4.26%(-3.31)#8,614 |
| 93. | San Carlos | 0.93% | 2.67%(-1.74)#93 | 4.26%(-3.33)#8,706 |
| 94. | Fortuna Foothills | 0.93% | 2.67%(-1.74)#94 | 4.26%(-3.33)#8,734 |
| 95. | Globe | 0.91% | 2.67%(-1.76)#95 | 4.26%(-3.35)#8,788 |
| 96. | Sahuarita | 0.90% | 2.67%(-1.77)#96 | 4.26%(-3.36)#8,847 |
| 97. | Safford | 0.89% | 2.67%(-1.78)#97 | 4.26%(-3.37)#8,894 |
| 98. | Green Valley | 0.87% | 2.67%(-1.80)#98 | 4.26%(-3.39)#8,986 |
| 99. | Willcox | 0.87% | 2.67%(-1.80)#99 | 4.26%(-3.39)#9,006 |
| 100. | Anthem | 0.85% | 2.67%(-1.81)#100 | 4.26%(-3.41)#9,067 |
Common Questions
What are the Top 10 Cities with the Highest Percentage of Immigrants from Asia in Arizona?
Top 10 Cities with the Highest Percentage of Immigrants from Asia in Arizona are:
#1
10.96%
#2
9.00%
#3
7.22%
#4
7.18%
#5
6.73%
#6
6.32%
#7
5.87%
#8
5.54%
#9
5.29%
#10
5.02%
What city has the Highest Percentage of Immigrants from Asia in Arizona?
Kohls Ranch has the Highest Percentage of Immigrants from Asia in Arizona with 10.96%.
What is the Percentage of Immigrants from Asia in the State of Arizona?
Percentage of Immigrants from Asia in Arizona is 2.67%.
What is the Percentage of Immigrants from Asia in the United States?
Percentage of Immigrants from Asia in the United States is 4.26%.