Cities with the Highest Percentage of Immigrants from Asia in Tennessee
RELATED REPORTS & OPTIONS
Asia
Tennessee
Compare Cities
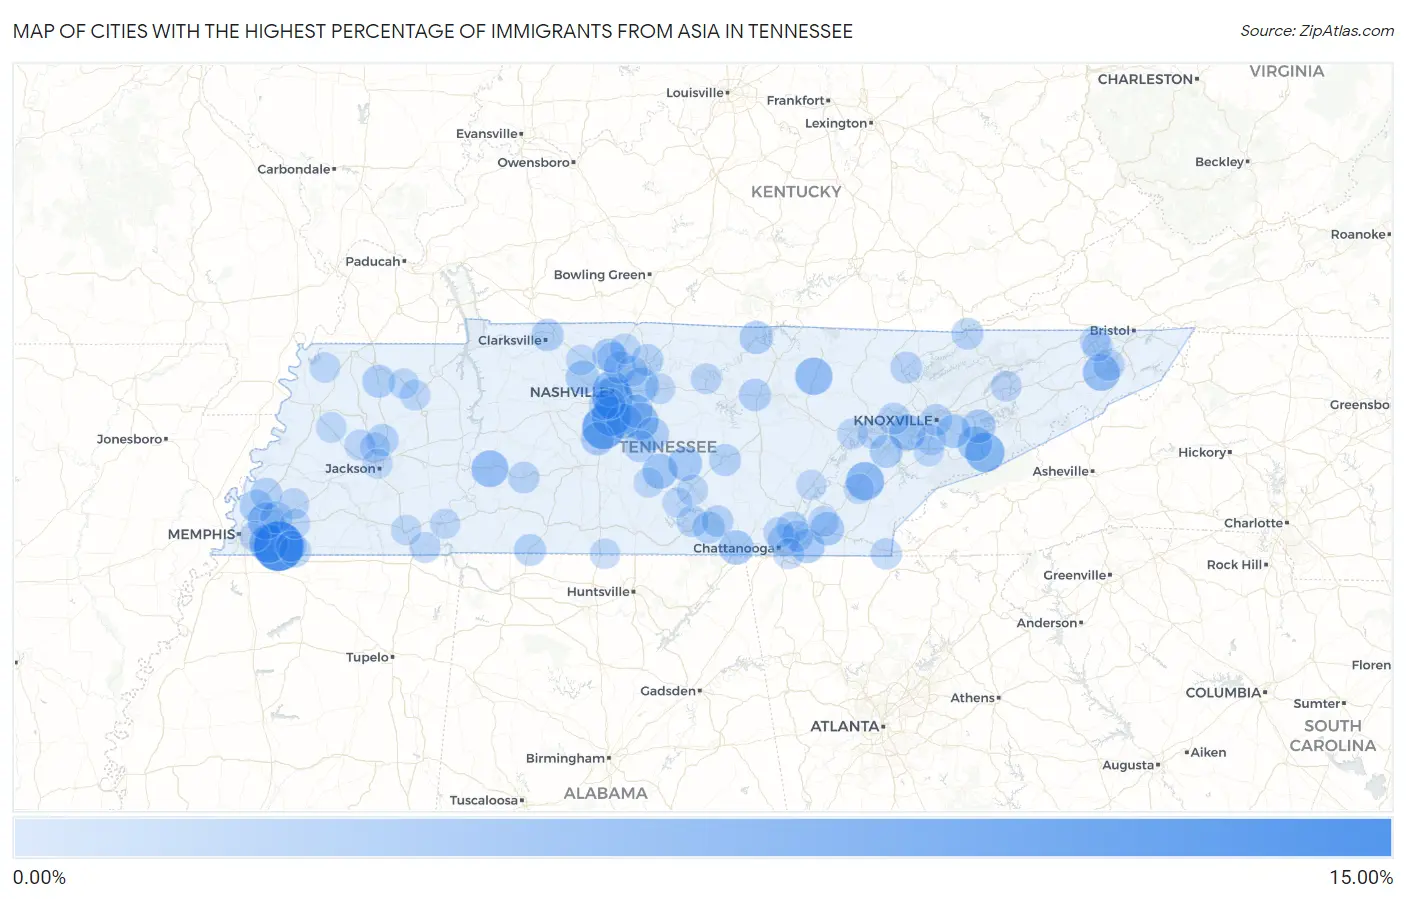
Map of Cities with the Highest Percentage of Immigrants from Asia in Tennessee
0.00%
15.00%
Cities with the Highest Percentage of Immigrants from Asia in Tennessee
| City | Asia | vs State | vs National | |
| 1. | Collierville | 10.07% | 1.58%(+8.50)#1 | 4.26%(+5.81)#919 |
| 2. | Franklin | 7.02% | 1.58%(+5.44)#2 | 4.26%(+2.76)#1,496 |
| 3. | Berry Hill | 5.74% | 1.58%(+4.17)#3 | 4.26%(+1.48)#1,895 |
| 4. | Brentwood | 5.29% | 1.58%(+3.72)#4 | 4.26%(+1.03)#2,069 |
| 5. | Gatlinburg | 5.09% | 1.58%(+3.51)#5 | 4.26%(+0.828)#2,157 |
| 6. | Germantown | 4.85% | 1.58%(+3.28)#6 | 4.26%(+0.594)#2,274 |
| 7. | Niota | 4.68% | 1.58%(+3.10)#7 | 4.26%(+0.420)#2,376 |
| 8. | Grimsley | 4.28% | 1.58%(+2.70)#8 | 4.26%(+0.016)#2,627 |
| 9. | Smyrna | 4.19% | 1.58%(+2.61)#9 | 4.26%(-0.073)#2,700 |
| 10. | Blanche | 4.18% | 1.58%(+2.60)#10 | 4.26%(-0.079)#2,710 |
| 11. | Mcdonald | 4.08% | 1.58%(+2.50)#11 | 4.26%(-0.185)#2,781 |
| 12. | Bartlett | 4.07% | 1.58%(+2.49)#12 | 4.26%(-0.191)#2,782 |
| 13. | Linden | 4.02% | 1.58%(+2.44)#13 | 4.26%(-0.244)#2,817 |
| 14. | Jonesborough | 4.01% | 1.58%(+2.43)#14 | 4.26%(-0.254)#2,823 |
| 15. | Nashville | 3.88% | 1.58%(+2.30)#15 | 4.26%(-0.384)#2,909 |
| 16. | Farragut | 3.66% | 1.58%(+2.08)#16 | 4.26%(-0.600)#3,085 |
| 17. | Nolensville | 3.25% | 1.58%(+1.68)#17 | 4.26%(-1.01)#3,474 |
| 18. | Bell Buckle | 3.22% | 1.58%(+1.64)#18 | 4.26%(-1.04)#3,511 |
| 19. | Mount Juliet | 3.17% | 1.58%(+1.59)#19 | 4.26%(-1.09)#3,555 |
| 20. | Pigeon Forge | 3.04% | 1.58%(+1.46)#20 | 4.26%(-1.22)#3,698 |
| 21. | Kimball | 2.99% | 1.58%(+1.41)#21 | 4.26%(-1.27)#3,746 |
| 22. | Lakewood Park | 2.80% | 1.58%(+1.23)#22 | 4.26%(-1.46)#3,976 |
| 23. | Collegedale | 2.63% | 1.58%(+1.05)#23 | 4.26%(-1.63)#4,205 |
| 24. | Sevierville | 2.58% | 1.58%(+1.00)#24 | 4.26%(-1.68)#4,284 |
| 25. | Ashland City | 2.55% | 1.58%(+0.973)#25 | 4.26%(-1.71)#4,328 |
| 26. | Seymour | 2.52% | 1.58%(+0.947)#26 | 4.26%(-1.74)#4,373 |
| 27. | Cleveland | 2.47% | 1.58%(+0.894)#27 | 4.26%(-1.79)#4,457 |
| 28. | Celina | 2.43% | 1.58%(+0.855)#28 | 4.26%(-1.83)#4,528 |
| 29. | La Vergne | 2.42% | 1.58%(+0.845)#29 | 4.26%(-1.84)#4,553 |
| 30. | Thompson S Station | 2.37% | 1.58%(+0.792)#30 | 4.26%(-1.89)#4,653 |
| 31. | Millington | 2.31% | 1.58%(+0.733)#31 | 4.26%(-1.95)#4,757 |
| 32. | Loudon | 2.29% | 1.58%(+0.712)#32 | 4.26%(-1.97)#4,795 |
| 33. | Greenbrier | 2.27% | 1.58%(+0.694)#33 | 4.26%(-1.99)#4,833 |
| 34. | Sharon | 2.23% | 1.58%(+0.648)#34 | 4.26%(-2.03)#4,910 |
| 35. | Murfreesboro | 2.21% | 1.58%(+0.629)#35 | 4.26%(-2.05)#4,947 |
| 36. | Rocky Top | 2.17% | 1.58%(+0.590)#36 | 4.26%(-2.09)#5,022 |
| 37. | Goodlettsville | 2.13% | 1.58%(+0.548)#37 | 4.26%(-2.13)#5,105 |
| 38. | Cookeville | 1.98% | 1.58%(+0.398)#38 | 4.26%(-2.28)#5,400 |
| 39. | Clarksville | 1.96% | 1.58%(+0.380)#39 | 4.26%(-2.30)#5,450 |
| 40. | Oak Ridge | 1.86% | 1.58%(+0.287)#40 | 4.26%(-2.40)#5,656 |
| 41. | Lakeland | 1.86% | 1.58%(+0.283)#41 | 4.26%(-2.40)#5,665 |
| 42. | Rossville | 1.86% | 1.58%(+0.279)#42 | 4.26%(-2.40)#5,674 |
| 43. | Middle Valley | 1.84% | 1.58%(+0.264)#43 | 4.26%(-2.42)#5,703 |
| 44. | Medina | 1.82% | 1.58%(+0.238)#44 | 4.26%(-2.44)#5,754 |
| 45. | Sewanee | 1.81% | 1.58%(+0.236)#45 | 4.26%(-2.45)#5,762 |
| 46. | Mcminnville | 1.80% | 1.58%(+0.225)#46 | 4.26%(-2.46)#5,797 |
| 47. | Gallatin | 1.80% | 1.58%(+0.217)#47 | 4.26%(-2.46)#5,813 |
| 48. | St Joseph | 1.78% | 1.58%(+0.205)#48 | 4.26%(-2.48)#5,841 |
| 49. | Rockvale | 1.78% | 1.58%(+0.200)#49 | 4.26%(-2.48)#5,849 |
| 50. | Knoxville | 1.77% | 1.58%(+0.187)#50 | 4.26%(-2.49)#5,880 |
| 51. | Munford | 1.76% | 1.58%(+0.184)#51 | 4.26%(-2.50)#5,889 |
| 52. | Chattanooga | 1.74% | 1.58%(+0.160)#52 | 4.26%(-2.52)#5,950 |
| 53. | Jacksboro | 1.73% | 1.58%(+0.152)#53 | 4.26%(-2.53)#5,973 |
| 54. | Decherd | 1.72% | 1.58%(+0.147)#54 | 4.26%(-2.54)#5,985 |
| 55. | Monteagle | 1.72% | 1.58%(+0.145)#55 | 4.26%(-2.54)#5,990 |
| 56. | Harrogate | 1.67% | 1.58%(+0.092)#56 | 4.26%(-2.59)#6,123 |
| 57. | Johnson City | 1.67% | 1.58%(+0.092)#57 | 4.26%(-2.59)#6,124 |
| 58. | Harrison | 1.61% | 1.58%(+0.034)#58 | 4.26%(-2.65)#6,283 |
| 59. | Hohenwald | 1.61% | 1.58%(+0.029)#59 | 4.26%(-2.65)#6,297 |
| 60. | Oak Hill | 1.51% | 1.58%(-0.067)#60 | 4.26%(-2.75)#6,561 |
| 61. | Copperhill | 1.50% | 1.58%(-0.082)#61 | 4.26%(-2.76)#6,611 |
| 62. | Piperton | 1.40% | 1.58%(-0.174)#62 | 4.26%(-2.86)#6,886 |
| 63. | Gadsden | 1.39% | 1.58%(-0.185)#63 | 4.26%(-2.87)#6,918 |
| 64. | Braden | 1.37% | 1.58%(-0.213)#64 | 4.26%(-2.90)#6,993 |
| 65. | Manchester | 1.35% | 1.58%(-0.231)#65 | 4.26%(-2.91)#7,058 |
| 66. | Walden | 1.33% | 1.58%(-0.246)#66 | 4.26%(-2.93)#7,116 |
| 67. | Michie | 1.32% | 1.58%(-0.257)#67 | 4.26%(-2.94)#7,161 |
| 68. | Morristown | 1.31% | 1.58%(-0.263)#68 | 4.26%(-2.95)#7,181 |
| 69. | Ridgetop | 1.30% | 1.58%(-0.273)#69 | 4.26%(-2.96)#7,208 |
| 70. | Hopewell | 1.30% | 1.58%(-0.280)#70 | 4.26%(-2.96)#7,236 |
| 71. | East Ridge | 1.30% | 1.58%(-0.280)#71 | 4.26%(-2.96)#7,240 |
| 72. | Oak Grove Cdp Washington County | 1.29% | 1.58%(-0.289)#72 | 4.26%(-2.97)#7,276 |
| 73. | Powell | 1.29% | 1.58%(-0.291)#73 | 4.26%(-2.97)#7,284 |
| 74. | Hendersonville | 1.28% | 1.58%(-0.297)#74 | 4.26%(-2.98)#7,301 |
| 75. | Carthage | 1.26% | 1.58%(-0.315)#75 | 4.26%(-3.00)#7,363 |
| 76. | Memphis | 1.26% | 1.58%(-0.315)#76 | 4.26%(-3.00)#7,364 |
| 77. | Three Way | 1.25% | 1.58%(-0.324)#77 | 4.26%(-3.01)#7,396 |
| 78. | Mckenzie | 1.25% | 1.58%(-0.330)#78 | 4.26%(-3.01)#7,415 |
| 79. | Lebanon | 1.21% | 1.58%(-0.365)#79 | 4.26%(-3.05)#7,536 |
| 80. | White House | 1.21% | 1.58%(-0.368)#80 | 4.26%(-3.05)#7,546 |
| 81. | Hornbeak | 1.20% | 1.58%(-0.383)#81 | 4.26%(-3.07)#7,609 |
| 82. | Pleasant View | 1.19% | 1.58%(-0.385)#82 | 4.26%(-3.07)#7,618 |
| 83. | Friendship | 1.19% | 1.58%(-0.388)#83 | 4.26%(-3.07)#7,634 |
| 84. | Alcoa | 1.18% | 1.58%(-0.397)#84 | 4.26%(-3.08)#7,668 |
| 85. | Maryville | 1.17% | 1.58%(-0.405)#85 | 4.26%(-3.09)#7,697 |
| 86. | Gleason | 1.17% | 1.58%(-0.407)#86 | 4.26%(-3.09)#7,714 |
| 87. | Kingsport | 1.14% | 1.58%(-0.434)#87 | 4.26%(-3.12)#7,812 |
| 88. | Athens | 1.13% | 1.58%(-0.450)#88 | 4.26%(-3.13)#7,883 |
| 89. | Selmer | 1.13% | 1.58%(-0.453)#89 | 4.26%(-3.14)#7,895 |
| 90. | Colonial Heights | 1.12% | 1.58%(-0.453)#90 | 4.26%(-3.14)#7,898 |
| 91. | Rockwood | 1.12% | 1.58%(-0.462)#91 | 4.26%(-3.14)#7,933 |
| 92. | Ardmore | 1.11% | 1.58%(-0.470)#92 | 4.26%(-3.15)#7,961 |
| 93. | Oakland | 1.11% | 1.58%(-0.473)#93 | 4.26%(-3.16)#7,972 |
| 94. | Kingston | 1.05% | 1.58%(-0.526)#94 | 4.26%(-3.21)#8,178 |
| 95. | Dayton | 1.05% | 1.58%(-0.527)#95 | 4.26%(-3.21)#8,184 |
| 96. | Tullahoma | 1.04% | 1.58%(-0.540)#96 | 4.26%(-3.22)#8,230 |
| 97. | Shelbyville | 1.03% | 1.58%(-0.543)#97 | 4.26%(-3.23)#8,251 |
| 98. | Savannah | 1.03% | 1.58%(-0.551)#98 | 4.26%(-3.23)#8,290 |
| 99. | Jackson | 1.02% | 1.58%(-0.559)#99 | 4.26%(-3.24)#8,322 |
| 100. | Forest Hills | 1.02% | 1.58%(-0.562)#100 | 4.26%(-3.24)#8,335 |
Common Questions
What are the Top 10 Cities with the Highest Percentage of Immigrants from Asia in Tennessee?
Top 10 Cities with the Highest Percentage of Immigrants from Asia in Tennessee are:
#1
10.07%
#2
7.02%
#3
5.74%
#4
5.29%
#5
5.09%
#6
4.85%
#7
4.68%
#8
4.28%
#9
4.19%
#10
4.07%
What city has the Highest Percentage of Immigrants from Asia in Tennessee?
Collierville has the Highest Percentage of Immigrants from Asia in Tennessee with 10.07%.
What is the Percentage of Immigrants from Asia in the State of Tennessee?
Percentage of Immigrants from Asia in Tennessee is 1.58%.
What is the Percentage of Immigrants from Asia in the United States?
Percentage of Immigrants from Asia in the United States is 4.26%.