Cities with the Highest Percentage of Immigrants from Asia in North Carolina
RELATED REPORTS & OPTIONS
Asia
North Carolina
Compare Cities
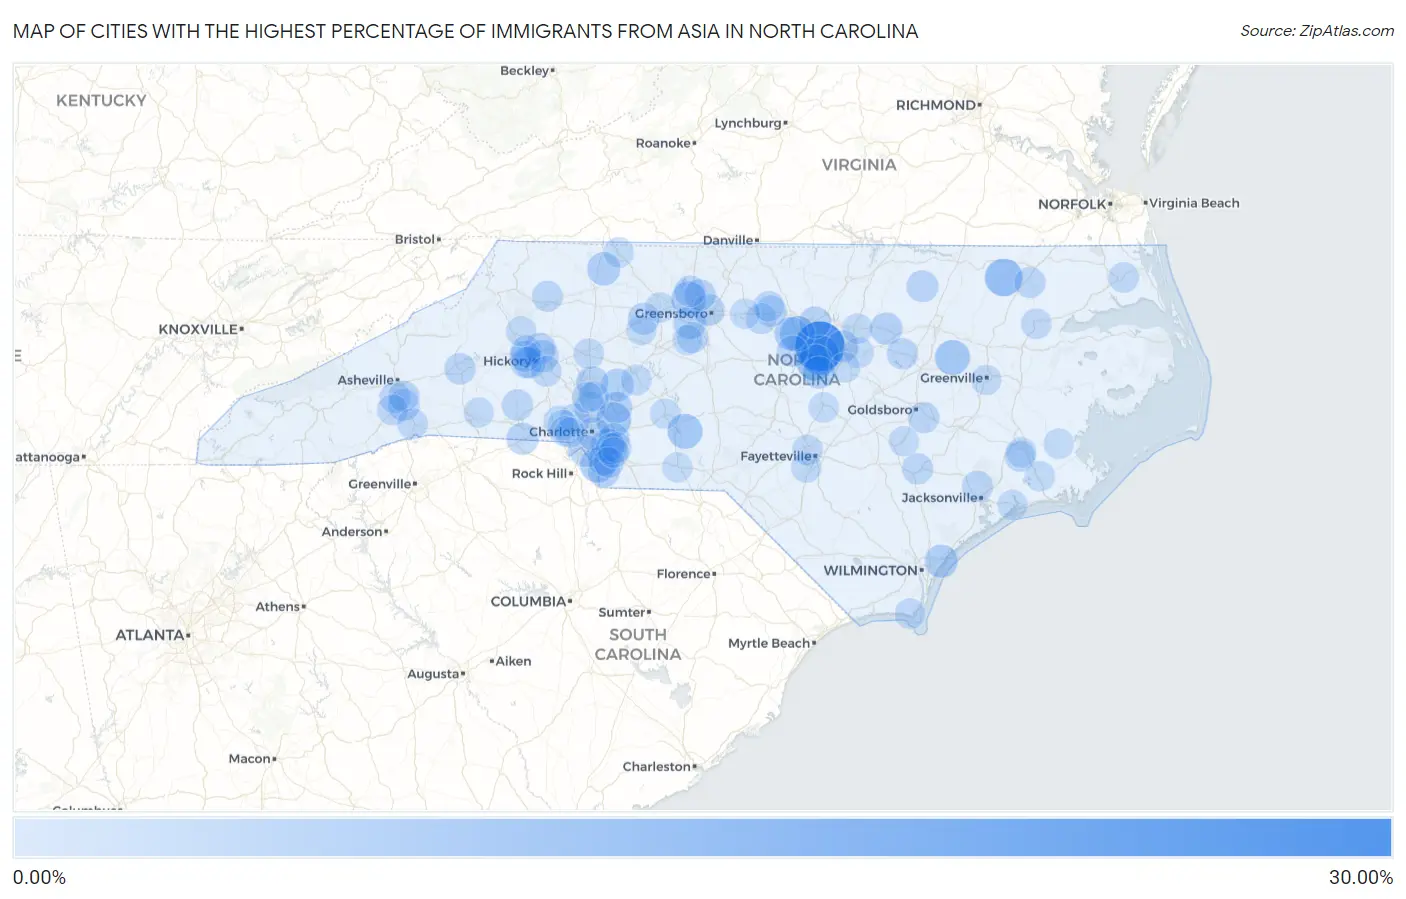
Map of Cities with the Highest Percentage of Immigrants from Asia in North Carolina
0.00%
30.00%
Cities with the Highest Percentage of Immigrants from Asia in North Carolina
| City | Asia | vs State | vs National | |
| 1. | Morrisville | 29.95% | 2.36%(+27.6)#1 | 4.26%(+25.7)#105 |
| 2. | Cary | 15.23% | 2.36%(+12.9)#2 | 4.26%(+11.0)#469 |
| 3. | Woodland | 12.22% | 2.36%(+9.87)#3 | 4.26%(+7.96)#667 |
| 4. | Apex | 10.67% | 2.36%(+8.31)#4 | 4.26%(+6.40)#826 |
| 5. | Chapel Hill | 8.86% | 2.36%(+6.50)#5 | 4.26%(+4.60)#1,090 |
| 6. | Macclesfield | 8.66% | 2.36%(+6.30)#6 | 4.26%(+4.40)#1,133 |
| 7. | Harrisburg | 8.51% | 2.36%(+6.15)#7 | 4.26%(+4.25)#1,165 |
| 8. | Marvin | 8.50% | 2.36%(+6.15)#8 | 4.26%(+4.24)#1,166 |
| 9. | Mount Gilead | 8.44% | 2.36%(+6.09)#9 | 4.26%(+4.18)#1,177 |
| 10. | Oak Ridge | 8.09% | 2.36%(+5.74)#10 | 4.26%(+3.83)#1,246 |
| 11. | Carrboro | 6.58% | 2.36%(+4.22)#11 | 4.26%(+2.32)#1,631 |
| 12. | Dobson | 5.96% | 2.36%(+3.61)#12 | 4.26%(+1.70)#1,807 |
| 13. | Porters Neck | 5.90% | 2.36%(+3.55)#13 | 4.26%(+1.64)#1,829 |
| 14. | Matthews | 5.74% | 2.36%(+3.39)#14 | 4.26%(+1.48)#1,898 |
| 15. | High Point | 5.71% | 2.36%(+3.36)#15 | 4.26%(+1.45)#1,904 |
| 16. | Landis | 5.30% | 2.36%(+2.94)#16 | 4.26%(+1.04)#2,067 |
| 17. | Charlotte | 5.23% | 2.36%(+2.87)#17 | 4.26%(+0.966)#2,093 |
| 18. | Holly Springs | 4.92% | 2.36%(+2.57)#18 | 4.26%(+0.663)#2,239 |
| 19. | Governors | 4.87% | 2.36%(+2.51)#19 | 4.26%(+0.606)#2,268 |
| 20. | St Stephens | 4.86% | 2.36%(+2.51)#20 | 4.26%(+0.602)#2,270 |
| 21. | Bunn | 4.81% | 2.36%(+2.46)#21 | 4.26%(+0.551)#2,303 |
| 22. | Mooresville | 4.73% | 2.36%(+2.37)#22 | 4.26%(+0.465)#2,349 |
| 23. | Waxhaw | 4.72% | 2.36%(+2.37)#23 | 4.26%(+0.463)#2,352 |
| 24. | Grover | 4.68% | 2.36%(+2.33)#24 | 4.26%(+0.422)#2,374 |
| 25. | Concord | 4.41% | 2.36%(+2.05)#25 | 4.26%(+0.147)#2,529 |
| 26. | Pineville | 4.34% | 2.36%(+1.98)#26 | 4.26%(+0.079)#2,581 |
| 27. | Durham | 4.27% | 2.36%(+1.92)#27 | 4.26%(+0.014)#2,629 |
| 28. | Greensboro | 4.16% | 2.36%(+1.80)#28 | 4.26%(-0.105)#2,725 |
| 29. | Clemmons | 4.14% | 2.36%(+1.78)#29 | 4.26%(-0.125)#2,734 |
| 30. | Hollister | 4.01% | 2.36%(+1.66)#30 | 4.26%(-0.246)#2,819 |
| 31. | Fletcher | 3.94% | 2.36%(+1.58)#31 | 4.26%(-0.323)#2,864 |
| 32. | Long View | 3.88% | 2.36%(+1.52)#32 | 4.26%(-0.383)#2,905 |
| 33. | Bethlehem | 3.85% | 2.36%(+1.50)#33 | 4.26%(-0.410)#2,935 |
| 34. | Raleigh | 3.80% | 2.36%(+1.45)#34 | 4.26%(-0.456)#2,976 |
| 35. | Summerfield | 3.79% | 2.36%(+1.43)#35 | 4.26%(-0.474)#2,988 |
| 36. | Stokesdale | 3.69% | 2.36%(+1.34)#36 | 4.26%(-0.565)#3,059 |
| 37. | Weddington | 3.64% | 2.36%(+1.28)#37 | 4.26%(-0.624)#3,112 |
| 38. | Hildebran | 3.64% | 2.36%(+1.28)#38 | 4.26%(-0.625)#3,113 |
| 39. | Marion | 3.61% | 2.36%(+1.25)#39 | 4.26%(-0.653)#3,142 |
| 40. | Fearrington Village | 3.56% | 2.36%(+1.21)#40 | 4.26%(-0.697)#3,178 |
| 41. | Huntersville | 3.49% | 2.36%(+1.13)#41 | 4.26%(-0.775)#3,233 |
| 42. | Mint Hill | 3.46% | 2.36%(+1.10)#42 | 4.26%(-0.805)#3,261 |
| 43. | Kenansville | 3.44% | 2.36%(+1.09)#43 | 4.26%(-0.816)#3,277 |
| 44. | Mebane | 3.39% | 2.36%(+1.04)#44 | 4.26%(-0.869)#3,333 |
| 45. | Granite Falls | 3.38% | 2.36%(+1.03)#45 | 4.26%(-0.876)#3,339 |
| 46. | Elroy | 3.38% | 2.36%(+1.02)#46 | 4.26%(-0.884)#3,348 |
| 47. | Rhodhiss | 3.35% | 2.36%(+0.997)#47 | 4.26%(-0.908)#3,378 |
| 48. | Stallings | 3.35% | 2.36%(+0.992)#48 | 4.26%(-0.913)#3,383 |
| 49. | Fallston | 3.28% | 2.36%(+0.928)#49 | 4.26%(-0.977)#3,442 |
| 50. | Bailey | 3.27% | 2.36%(+0.913)#50 | 4.26%(-0.992)#3,453 |
| 51. | Archdale | 3.24% | 2.36%(+0.887)#51 | 4.26%(-1.02)#3,483 |
| 52. | Avery Creek | 3.24% | 2.36%(+0.880)#52 | 4.26%(-1.02)#3,488 |
| 53. | Half Moon | 3.19% | 2.36%(+0.831)#53 | 4.26%(-1.07)#3,533 |
| 54. | Ahoskie | 3.12% | 2.36%(+0.764)#54 | 4.26%(-1.14)#3,616 |
| 55. | Royal Pines | 2.95% | 2.36%(+0.593)#55 | 4.26%(-1.31)#3,800 |
| 56. | Brices Creek | 2.88% | 2.36%(+0.527)#56 | 4.26%(-1.38)#3,878 |
| 57. | Millers Creek | 2.85% | 2.36%(+0.492)#57 | 4.26%(-1.41)#3,916 |
| 58. | Mount Holly | 2.84% | 2.36%(+0.484)#58 | 4.26%(-1.42)#3,924 |
| 59. | Cornelius | 2.83% | 2.36%(+0.473)#59 | 4.26%(-1.43)#3,941 |
| 60. | Mills River | 2.76% | 2.36%(+0.405)#60 | 4.26%(-1.50)#4,033 |
| 61. | Swepsonville | 2.76% | 2.36%(+0.405)#61 | 4.26%(-1.50)#4,036 |
| 62. | Ranlo | 2.74% | 2.36%(+0.386)#62 | 4.26%(-1.52)#4,062 |
| 63. | Faith | 2.74% | 2.36%(+0.382)#63 | 4.26%(-1.52)#4,066 |
| 64. | Hemby Bridge | 2.65% | 2.36%(+0.296)#64 | 4.26%(-1.61)#4,172 |
| 65. | Newton | 2.58% | 2.36%(+0.226)#65 | 4.26%(-1.68)#4,280 |
| 66. | Briar Chapel | 2.53% | 2.36%(+0.177)#66 | 4.26%(-1.73)#4,358 |
| 67. | East Flat Rock | 2.51% | 2.36%(+0.156)#67 | 4.26%(-1.75)#4,400 |
| 68. | Statesville | 2.46% | 2.36%(+0.105)#68 | 4.26%(-1.80)#4,481 |
| 69. | Jackson Springs | 2.46% | 2.36%(+0.104)#69 | 4.26%(-1.80)#4,482 |
| 70. | Caswell Beach | 2.45% | 2.36%(+0.099)#70 | 4.26%(-1.81)#4,490 |
| 71. | Woodlawn | 2.43% | 2.36%(+0.074)#71 | 4.26%(-1.83)#4,540 |
| 72. | Fayetteville | 2.41% | 2.36%(+0.053)#72 | 4.26%(-1.85)#4,590 |
| 73. | Windsor | 2.40% | 2.36%(+0.049)#73 | 4.26%(-1.86)#4,598 |
| 74. | Camden | 2.40% | 2.36%(+0.041)#74 | 4.26%(-1.86)#4,614 |
| 75. | Wesley Chapel | 2.37% | 2.36%(+0.018)#75 | 4.26%(-1.89)#4,642 |
| 76. | Indian Trail | 2.37% | 2.36%(+0.016)#76 | 4.26%(-1.89)#4,651 |
| 77. | Hope Mills | 2.26% | 2.36%(-0.097)#77 | 4.26%(-2.00)#4,857 |
| 78. | Mount Airy | 2.19% | 2.36%(-0.161)#78 | 4.26%(-2.07)#4,975 |
| 79. | Stonewall | 2.18% | 2.36%(-0.172)#79 | 4.26%(-2.08)#4,992 |
| 80. | Davidson | 2.15% | 2.36%(-0.204)#80 | 4.26%(-2.11)#5,053 |
| 81. | New Bern | 2.15% | 2.36%(-0.210)#81 | 4.26%(-2.12)#5,063 |
| 82. | Winston Salem | 2.13% | 2.36%(-0.226)#82 | 4.26%(-2.13)#5,098 |
| 83. | Lowell | 2.11% | 2.36%(-0.243)#83 | 4.26%(-2.15)#5,132 |
| 84. | Knightdale | 2.08% | 2.36%(-0.280)#84 | 4.26%(-2.18)#5,213 |
| 85. | Wake Forest | 2.07% | 2.36%(-0.288)#85 | 4.26%(-2.19)#5,226 |
| 86. | Greenville | 2.07% | 2.36%(-0.289)#86 | 4.26%(-2.19)#5,229 |
| 87. | Lillington | 2.06% | 2.36%(-0.297)#87 | 4.26%(-2.20)#5,239 |
| 88. | Wadesboro | 2.04% | 2.36%(-0.317)#88 | 4.26%(-2.22)#5,275 |
| 89. | Cramerton | 2.02% | 2.36%(-0.334)#89 | 4.26%(-2.24)#5,302 |
| 90. | Havelock | 2.01% | 2.36%(-0.344)#90 | 4.26%(-2.25)#5,327 |
| 91. | Trinity | 2.00% | 2.36%(-0.359)#91 | 4.26%(-2.26)#5,365 |
| 92. | Advance | 1.99% | 2.36%(-0.361)#92 | 4.26%(-2.27)#5,368 |
| 93. | Belmont | 1.97% | 2.36%(-0.381)#93 | 4.26%(-2.29)#5,406 |
| 94. | Bostic | 1.97% | 2.36%(-0.382)#94 | 4.26%(-2.29)#5,407 |
| 95. | Cedar Rock | 1.96% | 2.36%(-0.399)#95 | 4.26%(-2.30)#5,454 |
| 96. | Garner | 1.94% | 2.36%(-0.411)#96 | 4.26%(-2.32)#5,482 |
| 97. | Swansboro | 1.94% | 2.36%(-0.413)#97 | 4.26%(-2.32)#5,489 |
| 98. | Burlington | 1.90% | 2.36%(-0.457)#98 | 4.26%(-2.36)#5,582 |
| 99. | Albemarle | 1.87% | 2.36%(-0.482)#99 | 4.26%(-2.39)#5,639 |
| 100. | Calypso | 1.86% | 2.36%(-0.490)#100 | 4.26%(-2.40)#5,655 |
Common Questions
What are the Top 10 Cities with the Highest Percentage of Immigrants from Asia in North Carolina?
Top 10 Cities with the Highest Percentage of Immigrants from Asia in North Carolina are:
#1
29.95%
#2
15.23%
#3
12.22%
#4
10.67%
#5
8.86%
#6
8.66%
#7
8.51%
#8
8.50%
#9
8.44%
#10
8.09%
What city has the Highest Percentage of Immigrants from Asia in North Carolina?
Morrisville has the Highest Percentage of Immigrants from Asia in North Carolina with 29.95%.
What is the Percentage of Immigrants from Asia in the State of North Carolina?
Percentage of Immigrants from Asia in North Carolina is 2.36%.
What is the Percentage of Immigrants from Asia in the United States?
Percentage of Immigrants from Asia in the United States is 4.26%.