Cities with the Highest Percentage of Immigrants from Asia in South Carolina
RELATED REPORTS & OPTIONS
Asia
South Carolina
Compare Cities
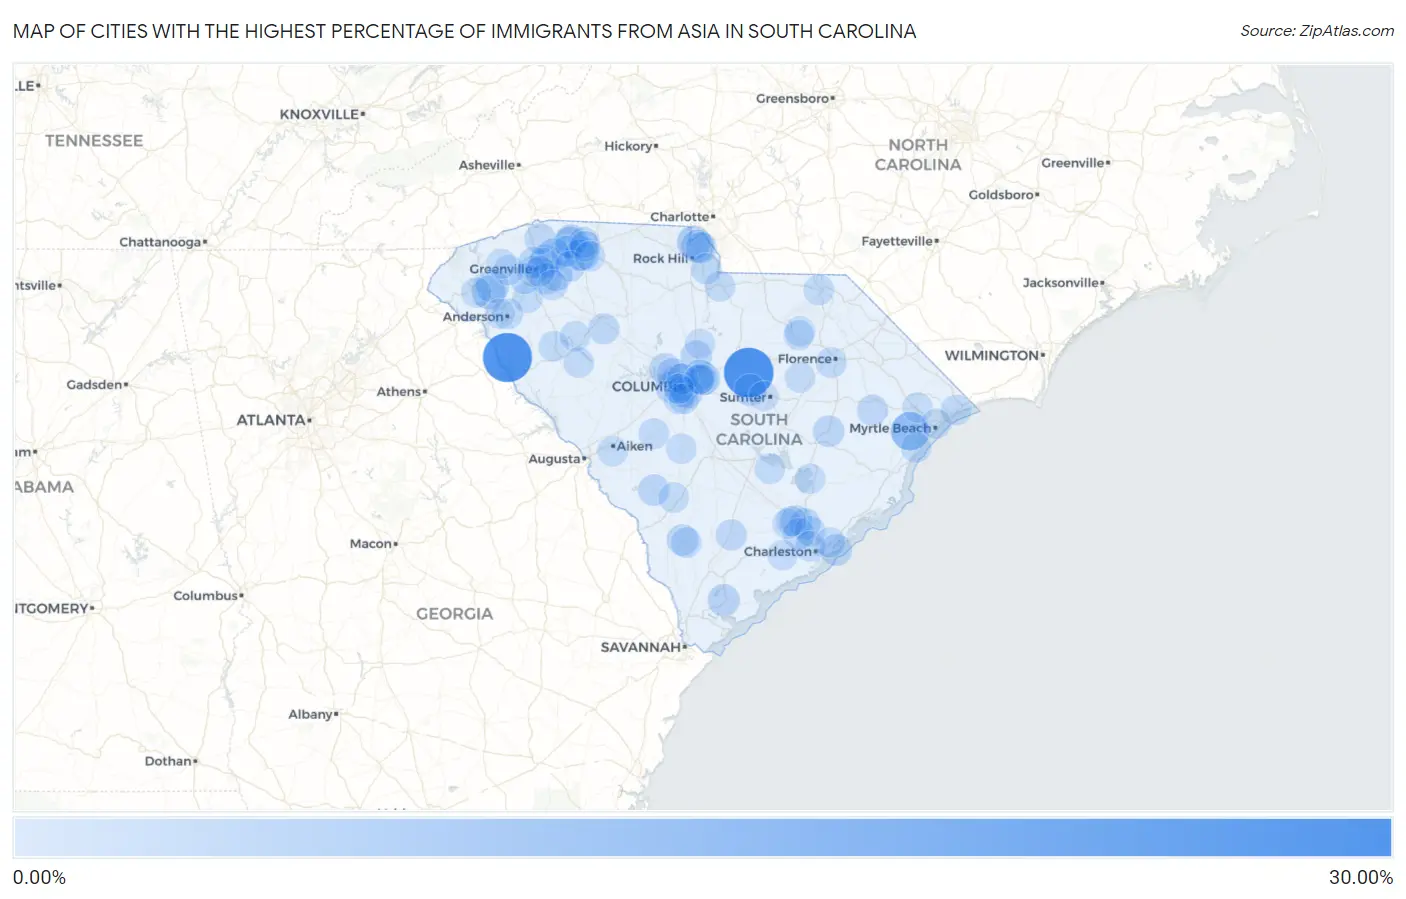
Map of Cities with the Highest Percentage of Immigrants from Asia in South Carolina
0.00%
30.00%
Cities with the Highest Percentage of Immigrants from Asia in South Carolina
| City | Asia | vs State | vs National | |
| 1. | Rembert | 29.41% | 1.31%(+28.1)#1 | 4.26%(+25.2)#116 |
| 2. | Lowndesville | 28.80% | 1.31%(+27.5)#2 | 4.26%(+24.5)#122 |
| 3. | Bucksport | 12.63% | 1.31%(+11.3)#3 | 4.26%(+8.37)#637 |
| 4. | Camp Croft | 8.80% | 1.31%(+7.49)#4 | 4.26%(+4.54)#1,100 |
| 5. | Tega Cay | 6.11% | 1.31%(+4.80)#5 | 4.26%(+1.85)#1,752 |
| 6. | Clemson | 5.92% | 1.31%(+4.60)#6 | 4.26%(+1.66)#1,822 |
| 7. | Arcadia | 5.80% | 1.31%(+4.48)#7 | 4.26%(+1.54)#1,876 |
| 8. | Inman | 5.66% | 1.31%(+4.34)#8 | 4.26%(+1.40)#1,923 |
| 9. | Sandy Springs | 5.61% | 1.31%(+4.30)#9 | 4.26%(+1.35)#1,943 |
| 10. | Central | 5.54% | 1.31%(+4.22)#10 | 4.26%(+1.28)#1,969 |
| 11. | Arthurtown | 5.49% | 1.31%(+4.17)#11 | 4.26%(+1.23)#1,995 |
| 12. | Riverview | 5.32% | 1.31%(+4.01)#12 | 4.26%(+1.06)#2,057 |
| 13. | Greer | 5.31% | 1.31%(+3.99)#13 | 4.26%(+1.05)#2,061 |
| 14. | Woodfield | 5.05% | 1.31%(+3.74)#14 | 4.26%(+0.789)#2,172 |
| 15. | Five Forks | 4.20% | 1.31%(+2.88)#15 | 4.26%(-0.065)#2,694 |
| 16. | Seven Oaks | 4.15% | 1.31%(+2.84)#16 | 4.26%(-0.109)#2,729 |
| 17. | Burton | 3.74% | 1.31%(+2.42)#17 | 4.26%(-0.525)#3,029 |
| 18. | Stateburg | 3.68% | 1.31%(+2.37)#18 | 4.26%(-0.580)#3,072 |
| 19. | Ladson | 3.66% | 1.31%(+2.35)#19 | 4.26%(-0.600)#3,084 |
| 20. | Isle Of Palms | 3.59% | 1.31%(+2.27)#20 | 4.26%(-0.672)#3,148 |
| 21. | Inman Mills | 3.56% | 1.31%(+2.24)#21 | 4.26%(-0.704)#3,184 |
| 22. | Lexington | 3.27% | 1.31%(+1.95)#22 | 4.26%(-0.994)#3,457 |
| 23. | Blythewood | 3.23% | 1.31%(+1.92)#23 | 4.26%(-1.03)#3,493 |
| 24. | Lake Murray Of Richland | 3.18% | 1.31%(+1.87)#24 | 4.26%(-1.08)#3,536 |
| 25. | Taylors | 3.17% | 1.31%(+1.85)#25 | 4.26%(-1.09)#3,556 |
| 26. | Kingstree | 3.09% | 1.31%(+1.78)#26 | 4.26%(-1.17)#3,639 |
| 27. | Barnwell | 2.95% | 1.31%(+1.64)#27 | 4.26%(-1.31)#3,796 |
| 28. | Dentsville | 2.90% | 1.31%(+1.58)#28 | 4.26%(-1.36)#3,858 |
| 29. | Fairforest | 2.89% | 1.31%(+1.58)#29 | 4.26%(-1.37)#3,867 |
| 30. | Arkwright | 2.86% | 1.31%(+1.54)#30 | 4.26%(-1.40)#3,907 |
| 31. | Wade Hampton | 2.85% | 1.31%(+1.54)#31 | 4.26%(-1.41)#3,911 |
| 32. | Hampton | 2.83% | 1.31%(+1.51)#32 | 4.26%(-1.43)#3,947 |
| 33. | Irmo | 2.82% | 1.31%(+1.50)#33 | 4.26%(-1.44)#3,961 |
| 34. | Springdale | 2.77% | 1.31%(+1.45)#34 | 4.26%(-1.49)#4,022 |
| 35. | Goose Creek | 2.76% | 1.31%(+1.45)#35 | 4.26%(-1.50)#4,030 |
| 36. | Cayce | 2.76% | 1.31%(+1.45)#36 | 4.26%(-1.50)#4,031 |
| 37. | West Columbia | 2.72% | 1.31%(+1.41)#37 | 4.26%(-1.54)#4,082 |
| 38. | North Charleston | 2.70% | 1.31%(+1.38)#38 | 4.26%(-1.56)#4,109 |
| 39. | Walterboro | 2.67% | 1.31%(+1.35)#39 | 4.26%(-1.59)#4,145 |
| 40. | Mauldin | 2.66% | 1.31%(+1.34)#40 | 4.26%(-1.60)#4,162 |
| 41. | Carolina Forest | 2.59% | 1.31%(+1.27)#41 | 4.26%(-1.67)#4,267 |
| 42. | St Andrews | 2.51% | 1.31%(+1.19)#42 | 4.26%(-1.75)#4,416 |
| 43. | Capitol View | 2.46% | 1.31%(+1.15)#43 | 4.26%(-1.80)#4,477 |
| 44. | Joanna | 2.42% | 1.31%(+1.10)#44 | 4.26%(-1.84)#4,566 |
| 45. | Sans Souci | 2.40% | 1.31%(+1.09)#45 | 4.26%(-1.86)#4,605 |
| 46. | Johnsonville | 2.35% | 1.31%(+1.03)#46 | 4.26%(-1.91)#4,692 |
| 47. | Fort Mill | 2.34% | 1.31%(+1.03)#47 | 4.26%(-1.92)#4,703 |
| 48. | Lyman | 2.25% | 1.31%(+0.932)#48 | 4.26%(-2.01)#4,882 |
| 49. | Boiling Springs | 2.23% | 1.31%(+0.910)#49 | 4.26%(-2.04)#4,912 |
| 50. | Catawba | 2.22% | 1.31%(+0.909)#50 | 4.26%(-2.04)#4,914 |
| 51. | Tigerville | 2.21% | 1.31%(+0.900)#51 | 4.26%(-2.05)#4,936 |
| 52. | Anderson | 2.18% | 1.31%(+0.866)#52 | 4.26%(-2.08)#5,002 |
| 53. | West Pelzer | 2.16% | 1.31%(+0.850)#53 | 4.26%(-2.10)#5,030 |
| 54. | Wagener | 2.14% | 1.31%(+0.821)#54 | 4.26%(-2.12)#5,086 |
| 55. | Judson | 2.02% | 1.31%(+0.708)#55 | 4.26%(-2.24)#5,299 |
| 56. | Hanahan | 2.02% | 1.31%(+0.707)#56 | 4.26%(-2.24)#5,303 |
| 57. | Lancaster | 2.00% | 1.31%(+0.687)#57 | 4.26%(-2.26)#5,351 |
| 58. | Florence | 1.99% | 1.31%(+0.676)#58 | 4.26%(-2.27)#5,378 |
| 59. | Powdersville | 1.93% | 1.31%(+0.615)#59 | 4.26%(-2.33)#5,518 |
| 60. | Reidville | 1.90% | 1.31%(+0.589)#60 | 4.26%(-2.36)#5,573 |
| 61. | Varnville | 1.84% | 1.31%(+0.526)#61 | 4.26%(-2.42)#5,705 |
| 62. | Columbia | 1.78% | 1.31%(+0.465)#62 | 4.26%(-2.48)#5,847 |
| 63. | Cheraw | 1.76% | 1.31%(+0.446)#63 | 4.26%(-2.50)#5,894 |
| 64. | North Myrtle Beach | 1.75% | 1.31%(+0.431)#64 | 4.26%(-2.51)#5,932 |
| 65. | Hodges | 1.73% | 1.31%(+0.420)#65 | 4.26%(-2.53)#5,959 |
| 66. | Charleston | 1.72% | 1.31%(+0.405)#66 | 4.26%(-2.54)#5,999 |
| 67. | Valley Falls | 1.72% | 1.31%(+0.403)#67 | 4.26%(-2.54)#6,007 |
| 68. | Aiken | 1.70% | 1.31%(+0.385)#68 | 4.26%(-2.56)#6,057 |
| 69. | South Congaree | 1.68% | 1.31%(+0.370)#69 | 4.26%(-2.58)#6,093 |
| 70. | Olar | 1.68% | 1.31%(+0.361)#70 | 4.26%(-2.58)#6,116 |
| 71. | Spartanburg | 1.66% | 1.31%(+0.343)#71 | 4.26%(-2.60)#6,159 |
| 72. | Waterloo | 1.64% | 1.31%(+0.325)#72 | 4.26%(-2.62)#6,199 |
| 73. | Forest Acres | 1.64% | 1.31%(+0.321)#73 | 4.26%(-2.62)#6,209 |
| 74. | Neeses | 1.62% | 1.31%(+0.307)#74 | 4.26%(-2.64)#6,256 |
| 75. | Lynchburg | 1.62% | 1.31%(+0.305)#75 | 4.26%(-2.64)#6,264 |
| 76. | Greenville | 1.62% | 1.31%(+0.305)#76 | 4.26%(-2.64)#6,265 |
| 77. | Arial | 1.60% | 1.31%(+0.285)#77 | 4.26%(-2.66)#6,312 |
| 78. | Fripp Island | 1.56% | 1.31%(+0.250)#78 | 4.26%(-2.70)#6,394 |
| 79. | Ninety Six | 1.55% | 1.31%(+0.236)#79 | 4.26%(-2.71)#6,436 |
| 80. | Murrells Inlet | 1.54% | 1.31%(+0.230)#80 | 4.26%(-2.72)#6,458 |
| 81. | Pine Ridge | 1.53% | 1.31%(+0.211)#81 | 4.26%(-2.73)#6,518 |
| 82. | Eutawville | 1.52% | 1.31%(+0.201)#82 | 4.26%(-2.75)#6,551 |
| 83. | North Hartsville | 1.47% | 1.31%(+0.157)#83 | 4.26%(-2.79)#6,684 |
| 84. | Hollywood | 1.45% | 1.31%(+0.131)#84 | 4.26%(-2.82)#6,751 |
| 85. | Summerville | 1.44% | 1.31%(+0.129)#85 | 4.26%(-2.82)#6,760 |
| 86. | Hartsville | 1.41% | 1.31%(+0.095)#86 | 4.26%(-2.85)#6,866 |
| 87. | Bonneau Beach | 1.40% | 1.31%(+0.085)#87 | 4.26%(-2.86)#6,901 |
| 88. | Pickens | 1.39% | 1.31%(+0.078)#88 | 4.26%(-2.87)#6,917 |
| 89. | Utica | 1.39% | 1.31%(+0.076)#89 | 4.26%(-2.87)#6,923 |
| 90. | Arcadia Lakes | 1.38% | 1.31%(+0.063)#90 | 4.26%(-2.88)#6,957 |
| 91. | Mount Pleasant | 1.37% | 1.31%(+0.051)#91 | 4.26%(-2.89)#6,991 |
| 92. | Oak Grove | 1.31% | 1.31%(-0.006)#92 | 4.26%(-2.95)#7,197 |
| 93. | Simpsonville | 1.27% | 1.31%(-0.047)#93 | 4.26%(-2.99)#7,346 |
| 94. | Lincolnville | 1.25% | 1.31%(-0.066)#94 | 4.26%(-3.01)#7,416 |
| 95. | Conway | 1.20% | 1.31%(-0.112)#95 | 4.26%(-3.06)#7,582 |
| 96. | Cash | 1.20% | 1.31%(-0.116)#96 | 4.26%(-3.06)#7,593 |
| 97. | Ridgeway | 1.20% | 1.31%(-0.119)#97 | 4.26%(-3.07)#7,610 |
| 98. | Myrtle Beach | 1.20% | 1.31%(-0.119)#98 | 4.26%(-3.07)#7,611 |
| 99. | Centerville | 1.18% | 1.31%(-0.137)#99 | 4.26%(-3.08)#7,682 |
| 100. | Sumter | 1.18% | 1.31%(-0.139)#100 | 4.26%(-3.08)#7,687 |
Common Questions
What are the Top 10 Cities with the Highest Percentage of Immigrants from Asia in South Carolina?
Top 10 Cities with the Highest Percentage of Immigrants from Asia in South Carolina are:
What city has the Highest Percentage of Immigrants from Asia in South Carolina?
Rembert has the Highest Percentage of Immigrants from Asia in South Carolina with 29.41%.
What is the Percentage of Immigrants from Asia in the State of South Carolina?
Percentage of Immigrants from Asia in South Carolina is 1.31%.
What is the Percentage of Immigrants from Asia in the United States?
Percentage of Immigrants from Asia in the United States is 4.26%.