Cities with the Highest Percentage of Immigrants from Asia in Illinois
RELATED REPORTS & OPTIONS
Asia
Illinois
Compare Cities
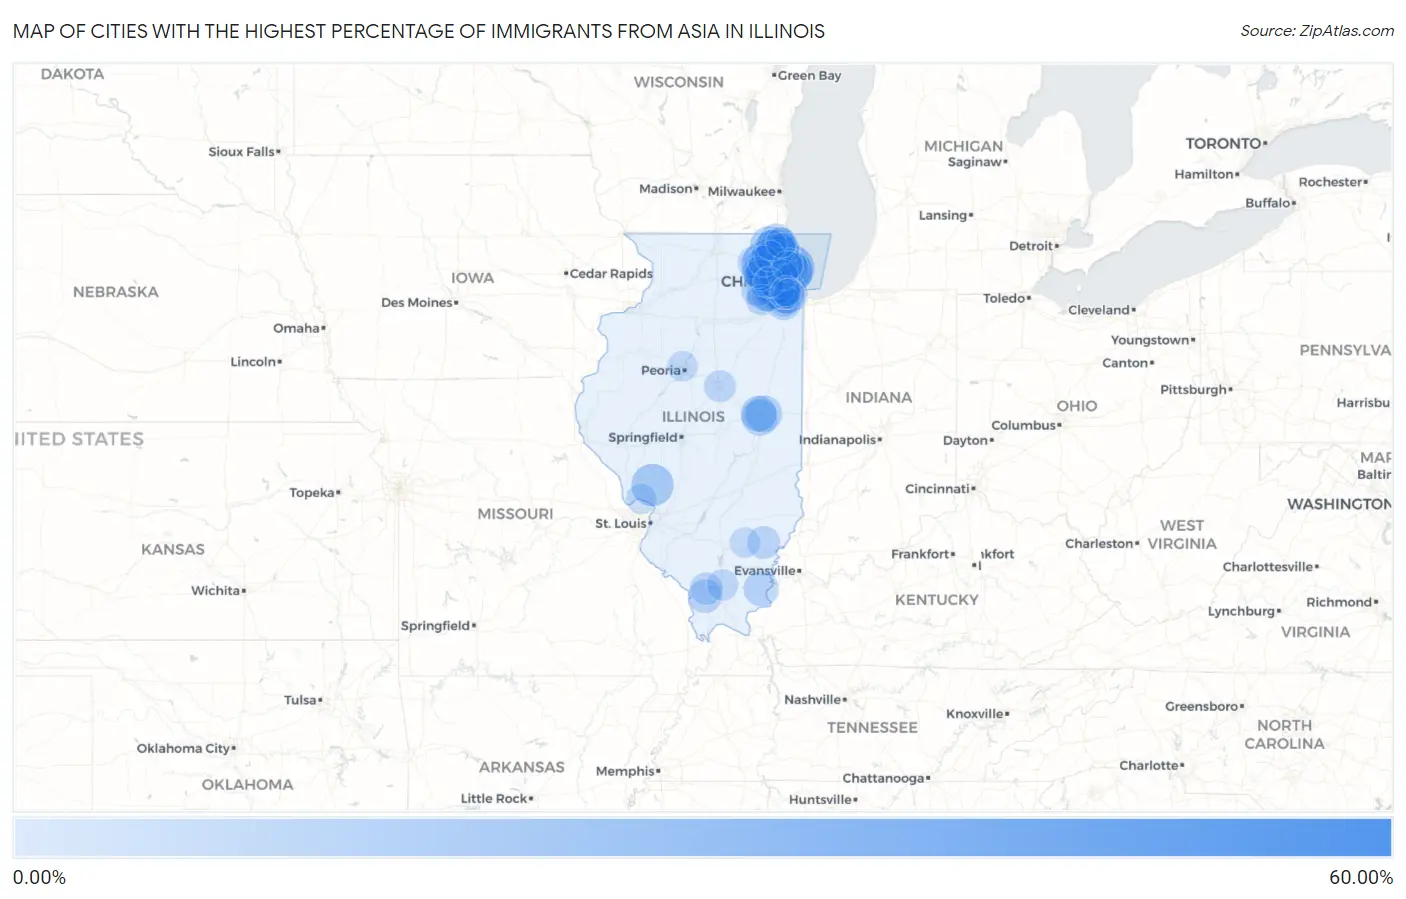
Map of Cities with the Highest Percentage of Immigrants from Asia in Illinois
0.00%
60.00%
Cities with the Highest Percentage of Immigrants from Asia in Illinois
| City | Asia | vs State | vs National | |
| 1. | Marley | 60.00% | 4.39%(+55.6)#1 | 4.26%(+55.7)#8 |
| 2. | Eagle Lake | 43.10% | 4.39%(+38.7)#2 | 4.26%(+38.8)#27 |
| 3. | South Barrington | 24.50% | 4.39%(+20.1)#3 | 4.26%(+20.2)#184 |
| 4. | Morton Grove | 24.47% | 4.39%(+20.1)#4 | 4.26%(+20.2)#185 |
| 5. | Skokie | 24.02% | 4.39%(+19.6)#5 | 4.26%(+19.8)#195 |
| 6. | Indian Creek | 23.04% | 4.39%(+18.6)#6 | 4.26%(+18.8)#211 |
| 7. | Oak Brook | 20.33% | 4.39%(+15.9)#7 | 4.26%(+16.1)#269 |
| 8. | Niles | 20.25% | 4.39%(+15.9)#8 | 4.26%(+16.0)#274 |
| 9. | Lincolnwood | 20.06% | 4.39%(+15.7)#9 | 4.26%(+15.8)#280 |
| 10. | Schaumburg | 18.72% | 4.39%(+14.3)#10 | 4.26%(+14.5)#325 |
| 11. | Vernon Hills | 18.57% | 4.39%(+14.2)#11 | 4.26%(+14.3)#334 |
| 12. | Buffalo Grove | 18.47% | 4.39%(+14.1)#12 | 4.26%(+14.2)#337 |
| 13. | Hoffman Estates | 18.41% | 4.39%(+14.0)#13 | 4.26%(+14.2)#341 |
| 14. | Fidelity | 17.33% | 4.39%(+12.9)#14 | 4.26%(+13.1)#380 |
| 15. | Lincolnshire | 15.83% | 4.39%(+11.4)#15 | 4.26%(+11.6)#439 |
| 16. | Glendale Heights | 15.60% | 4.39%(+11.2)#16 | 4.26%(+11.3)#450 |
| 17. | Chicago Ridge | 14.85% | 4.39%(+10.5)#17 | 4.26%(+10.6)#494 |
| 18. | Naperville | 14.60% | 4.39%(+10.2)#18 | 4.26%(+10.3)#508 |
| 19. | Carol Stream | 14.18% | 4.39%(+9.79)#19 | 4.26%(+9.92)#528 |
| 20. | Inverness | 14.06% | 4.39%(+9.67)#20 | 4.26%(+9.80)#537 |
| 21. | Hanover Park | 13.95% | 4.39%(+9.56)#21 | 4.26%(+9.69)#546 |
| 22. | Wheeling | 13.60% | 4.39%(+9.21)#22 | 4.26%(+9.34)#562 |
| 23. | Westmont | 13.17% | 4.39%(+8.78)#23 | 4.26%(+8.91)#600 |
| 24. | Burr Ridge | 12.59% | 4.39%(+8.19)#24 | 4.26%(+8.33)#641 |
| 25. | Round Lake | 12.34% | 4.39%(+7.95)#25 | 4.26%(+8.08)#659 |
| 26. | Worth | 11.80% | 4.39%(+7.40)#26 | 4.26%(+7.54)#709 |
| 27. | Kildeer | 11.66% | 4.39%(+7.27)#27 | 4.26%(+7.40)#719 |
| 28. | Urbana | 11.64% | 4.39%(+7.25)#28 | 4.26%(+7.38)#721 |
| 29. | Savoy | 11.43% | 4.39%(+7.03)#29 | 4.26%(+7.17)#740 |
| 30. | Bartlett | 11.36% | 4.39%(+6.97)#30 | 4.26%(+7.10)#744 |
| 31. | Itasca | 11.34% | 4.39%(+6.95)#31 | 4.26%(+7.08)#746 |
| 32. | Champaign | 11.12% | 4.39%(+6.73)#32 | 4.26%(+6.86)#768 |
| 33. | Des Plaines | 10.91% | 4.39%(+6.52)#33 | 4.26%(+6.65)#795 |
| 34. | Northbrook | 10.84% | 4.39%(+6.45)#34 | 4.26%(+6.58)#804 |
| 35. | Rolling Meadows | 10.78% | 4.39%(+6.39)#35 | 4.26%(+6.52)#811 |
| 36. | Glenview | 10.75% | 4.39%(+6.35)#36 | 4.26%(+6.49)#817 |
| 37. | Lisle | 10.68% | 4.39%(+6.28)#37 | 4.26%(+6.42)#824 |
| 38. | Streamwood | 10.54% | 4.39%(+6.15)#38 | 4.26%(+6.28)#843 |
| 39. | Mount Prospect | 10.41% | 4.39%(+6.02)#39 | 4.26%(+6.15)#862 |
| 40. | Harwood Heights | 10.36% | 4.39%(+5.96)#40 | 4.26%(+6.10)#872 |
| 41. | Grandwood Park | 10.26% | 4.39%(+5.87)#41 | 4.26%(+6.00)#883 |
| 42. | Junction | 10.17% | 4.39%(+5.78)#42 | 4.26%(+5.91)#901 |
| 43. | Orland Hills | 10.11% | 4.39%(+5.72)#43 | 4.26%(+5.85)#908 |
| 44. | Hawthorn Woods | 9.66% | 4.39%(+5.27)#44 | 4.26%(+5.40)#962 |
| 45. | Clarendon Hills | 9.59% | 4.39%(+5.19)#45 | 4.26%(+5.33)#978 |
| 46. | Bloomingdale | 9.31% | 4.39%(+4.92)#46 | 4.26%(+5.05)#1,014 |
| 47. | Palatine | 9.07% | 4.39%(+4.68)#47 | 4.26%(+4.81)#1,054 |
| 48. | Darien | 9.01% | 4.39%(+4.62)#48 | 4.26%(+4.75)#1,058 |
| 49. | Gurnee | 8.90% | 4.39%(+4.51)#49 | 4.26%(+4.64)#1,083 |
| 50. | Makanda | 8.80% | 4.39%(+4.41)#50 | 4.26%(+4.54)#1,101 |
| 51. | Mundelein | 8.73% | 4.39%(+4.34)#51 | 4.26%(+4.47)#1,116 |
| 52. | Woodridge | 8.68% | 4.39%(+4.29)#52 | 4.26%(+4.42)#1,125 |
| 53. | Roselle | 8.65% | 4.39%(+4.26)#53 | 4.26%(+4.39)#1,136 |
| 54. | Lombard | 8.22% | 4.39%(+3.82)#54 | 4.26%(+3.96)#1,223 |
| 55. | Elk Grove Village | 8.19% | 4.39%(+3.79)#55 | 4.26%(+3.92)#1,230 |
| 56. | Long Grove | 8.17% | 4.39%(+3.77)#56 | 4.26%(+3.90)#1,234 |
| 57. | Bolingbrook | 8.14% | 4.39%(+3.74)#57 | 4.26%(+3.87)#1,238 |
| 58. | Hickory Hills | 8.01% | 4.39%(+3.61)#58 | 4.26%(+3.75)#1,260 |
| 59. | Wilmette | 7.98% | 4.39%(+3.59)#59 | 4.26%(+3.72)#1,267 |
| 60. | Arlington Heights | 7.82% | 4.39%(+3.43)#60 | 4.26%(+3.56)#1,302 |
| 61. | Golden Gate | 7.78% | 4.39%(+3.39)#61 | 4.26%(+3.52)#1,313 |
| 62. | Justice | 7.68% | 4.39%(+3.29)#62 | 4.26%(+3.42)#1,333 |
| 63. | Carbondale | 7.65% | 4.39%(+3.26)#63 | 4.26%(+3.39)#1,338 |
| 64. | Aurora | 7.61% | 4.39%(+3.22)#64 | 4.26%(+3.35)#1,344 |
| 65. | Hinsdale | 7.53% | 4.39%(+3.14)#65 | 4.26%(+3.27)#1,365 |
| 66. | West Chicago | 7.44% | 4.39%(+3.04)#66 | 4.26%(+3.18)#1,388 |
| 67. | Oakbrook Terrace | 7.42% | 4.39%(+3.03)#67 | 4.26%(+3.16)#1,394 |
| 68. | Gilberts | 7.40% | 4.39%(+3.00)#68 | 4.26%(+3.14)#1,400 |
| 69. | Rosemont | 7.30% | 4.39%(+2.91)#69 | 4.26%(+3.04)#1,421 |
| 70. | Barrington | 7.24% | 4.39%(+2.85)#70 | 4.26%(+2.98)#1,438 |
| 71. | Prospect Heights | 7.09% | 4.39%(+2.69)#71 | 4.26%(+2.83)#1,474 |
| 72. | Norridge | 6.97% | 4.39%(+2.58)#72 | 4.26%(+2.71)#1,513 |
| 73. | Bloomington | 6.89% | 4.39%(+2.50)#73 | 4.26%(+2.63)#1,540 |
| 74. | Northfield | 6.76% | 4.39%(+2.37)#74 | 4.26%(+2.50)#1,577 |
| 75. | Arbury Hills | 6.76% | 4.39%(+2.37)#75 | 4.26%(+2.50)#1,579 |
| 76. | Campbell's Island | 6.71% | 4.39%(+2.32)#76 | 4.26%(+2.45)#1,589 |
| 77. | Lake Bluff | 6.67% | 4.39%(+2.28)#77 | 4.26%(+2.41)#1,603 |
| 78. | Addison | 6.59% | 4.39%(+2.20)#78 | 4.26%(+2.33)#1,628 |
| 79. | North Barrington | 6.41% | 4.39%(+2.02)#79 | 4.26%(+2.15)#1,674 |
| 80. | Orland Park | 6.38% | 4.39%(+1.99)#80 | 4.26%(+2.12)#1,683 |
| 81. | Glen Ellyn | 6.35% | 4.39%(+1.96)#81 | 4.26%(+2.09)#1,692 |
| 82. | Spillertown | 6.35% | 4.39%(+1.96)#82 | 4.26%(+2.09)#1,693 |
| 83. | Evanston | 6.24% | 4.39%(+1.85)#83 | 4.26%(+1.98)#1,720 |
| 84. | Wayne | 6.20% | 4.39%(+1.81)#84 | 4.26%(+1.94)#1,734 |
| 85. | Green Oaks | 6.13% | 4.39%(+1.74)#85 | 4.26%(+1.87)#1,748 |
| 86. | South Elgin | 6.07% | 4.39%(+1.67)#86 | 4.26%(+1.80)#1,766 |
| 87. | Barrington Hills | 5.91% | 4.39%(+1.52)#87 | 4.26%(+1.65)#1,823 |
| 88. | Plainfield | 5.75% | 4.39%(+1.36)#88 | 4.26%(+1.49)#1,891 |
| 89. | Schiller Park | 5.57% | 4.39%(+1.18)#89 | 4.26%(+1.31)#1,961 |
| 90. | Elsah | 5.56% | 4.39%(+1.17)#90 | 4.26%(+1.30)#1,963 |
| 91. | Hainesville | 5.53% | 4.39%(+1.13)#91 | 4.26%(+1.27)#1,975 |
| 92. | Lake Zurich | 5.50% | 4.39%(+1.11)#92 | 4.26%(+1.24)#1,987 |
| 93. | Golf | 5.49% | 4.39%(+1.10)#93 | 4.26%(+1.23)#1,990 |
| 94. | Peoria | 5.49% | 4.39%(+1.10)#94 | 4.26%(+1.23)#1,991 |
| 95. | Sims | 5.46% | 4.39%(+1.07)#95 | 4.26%(+1.20)#2,002 |
| 96. | Waukegan | 5.46% | 4.39%(+1.07)#96 | 4.26%(+1.20)#2,004 |
| 97. | Palos Hills | 5.41% | 4.39%(+1.01)#97 | 4.26%(+1.15)#2,021 |
| 98. | Wheaton | 5.40% | 4.39%(+1.01)#98 | 4.26%(+1.14)#2,027 |
| 99. | Bridgeview | 5.31% | 4.39%(+0.921)#99 | 4.26%(+1.05)#2,060 |
| 100. | Oak Lawn | 5.26% | 4.39%(+0.866)#100 | 4.26%(+0.998)#2,078 |
Common Questions
What are the Top 10 Cities with the Highest Percentage of Immigrants from Asia in Illinois?
Top 10 Cities with the Highest Percentage of Immigrants from Asia in Illinois are:
#1
24.50%
#2
24.47%
#3
24.02%
#4
23.04%
#5
20.33%
#6
20.25%
#7
20.06%
#8
18.72%
#9
18.57%
#10
18.47%
What city has the Highest Percentage of Immigrants from Asia in Illinois?
South Barrington has the Highest Percentage of Immigrants from Asia in Illinois with 24.50%.
What is the Percentage of Immigrants from Asia in the State of Illinois?
Percentage of Immigrants from Asia in Illinois is 4.39%.
What is the Percentage of Immigrants from Asia in the United States?
Percentage of Immigrants from Asia in the United States is 4.26%.