Native Hawaiian Female Disability
COMPARE
Native Hawaiian
Select to Compare
Female Disability
Native Hawaiian Female Disability
12.4%
DISABILITY | FEMALES
10.8/ 100
METRIC RATING
221st/ 347
METRIC RANK
Native Hawaiian Female Disability Correlation Chart
The statistical analysis conducted on geographies consisting of 332,017,231 people shows a poor positive correlation between the proportion of Native Hawaiians and percentage of females with a disability in the United States with a correlation coefficient (R) of 0.148 and weighted average of 12.4%. On average, for every 1% (one percent) increase in Native Hawaiians within a typical geography, there is an increase of 0.028% in percentage of females with a disability.
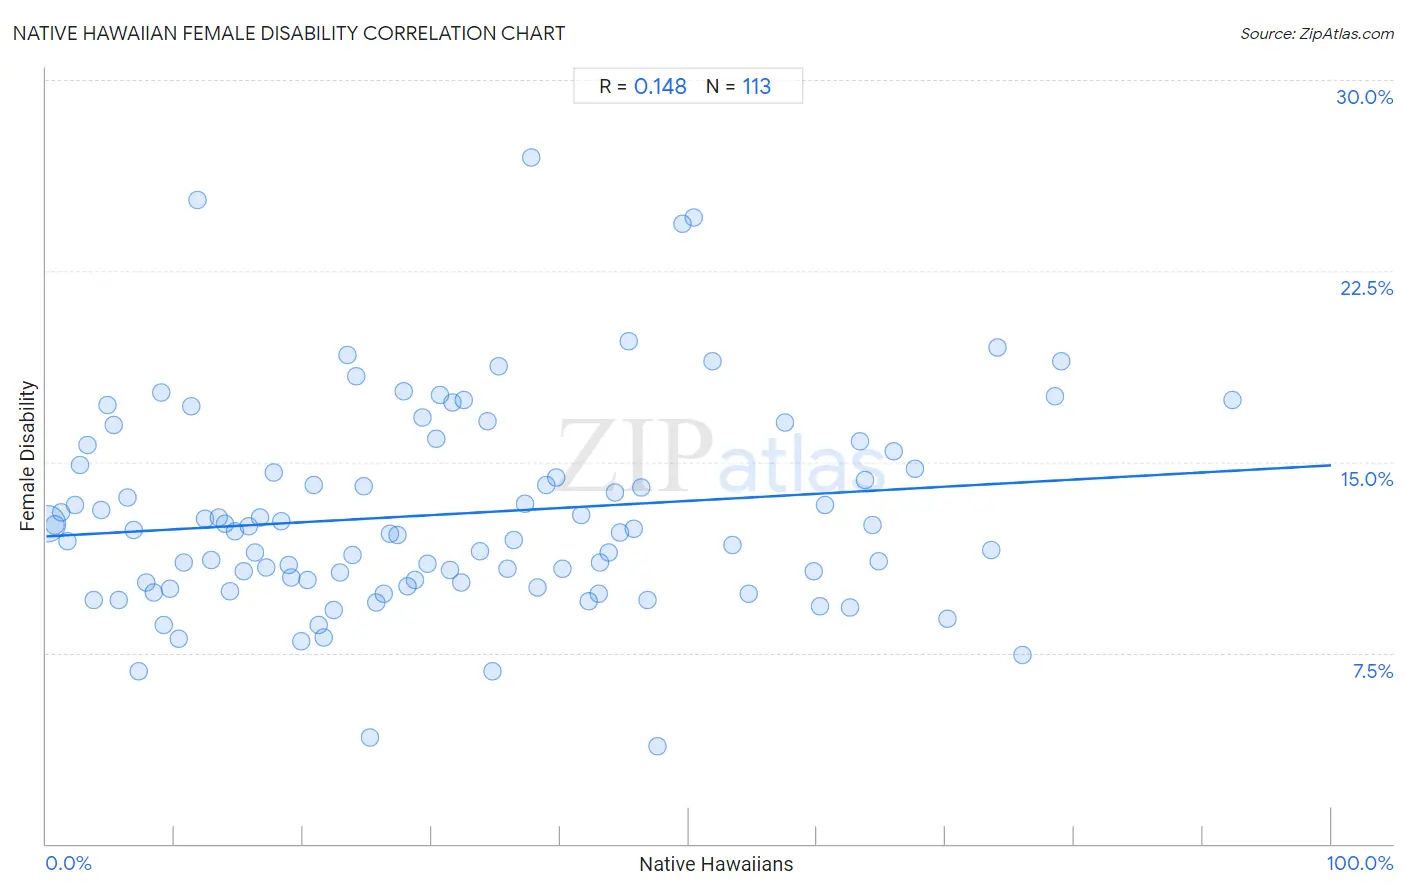
It is essential to understand that the correlation between the percentage of Native Hawaiians and percentage of females with a disability does not imply a direct cause-and-effect relationship. It remains uncertain whether the presence of Native Hawaiians influences an upward or downward trend in the level of percentage of females with a disability within an area, or if Native Hawaiians simply ended up residing in those areas with higher or lower levels of percentage of females with a disability due to other factors.
Demographics Similar to Native Hawaiians by Female Disability
In terms of female disability, the demographic groups most similar to Native Hawaiians are Italian (12.4%, a difference of 0.010%), Bahamian (12.4%, a difference of 0.030%), European (12.4%, a difference of 0.12%), Guamanian/Chamorro (12.5%, a difference of 0.14%), and Immigrants from Bahamas (12.4%, a difference of 0.15%).
| Demographics | Rating | Rank | Female Disability |
| Panamanians | 13.5 /100 | #214 | Poor 12.4% |
| Samoans | 13.4 /100 | #215 | Poor 12.4% |
| Immigrants from Burma/Myanmar | 13.3 /100 | #216 | Poor 12.4% |
| British | 12.7 /100 | #217 | Poor 12.4% |
| Immigrants from Bahamas | 12.5 /100 | #218 | Poor 12.4% |
| Europeans | 12.1 /100 | #219 | Poor 12.4% |
| Bahamians | 11.1 /100 | #220 | Poor 12.4% |
| Native Hawaiians | 10.8 /100 | #221 | Poor 12.4% |
| Italians | 10.7 /100 | #222 | Poor 12.4% |
| Guamanians/Chamorros | 9.5 /100 | #223 | Tragic 12.5% |
| Belizeans | 9.3 /100 | #224 | Tragic 12.5% |
| Poles | 8.4 /100 | #225 | Tragic 12.5% |
| Hispanics or Latinos | 8.0 /100 | #226 | Tragic 12.5% |
| Assyrians/Chaldeans/Syriacs | 8.0 /100 | #227 | Tragic 12.5% |
| Immigrants from Cambodia | 7.8 /100 | #228 | Tragic 12.5% |
Native Hawaiian Female Disability Correlation Summary
| Measurement | Native Hawaiian Data | Female Disability Data |
| Minimum | 0.13% | 3.9% |
| Maximum | 92.3% | 27.0% |
| Range | 92.1% | 23.1% |
| Mean | 31.5% | 13.0% |
| Median | 28.1% | 12.3% |
| Interquartile 25% (IQ1) | 14.1% | 10.3% |
| Interquartile 75% (IQ3) | 45.0% | 15.1% |
| Interquartile Range (IQR) | 30.9% | 4.9% |
| Standard Deviation (Sample) | 21.4% | 4.1% |
| Standard Deviation (Population) | 21.3% | 4.0% |
Correlation Details
| Native Hawaiian Percentile | Sample Size | Female Disability |
[ 0.0% - 0.5% ] 0.13% | 300,308,150 | 12.6% |
[ 0.5% - 1.0% ] 0.69% | 22,073,770 | 12.5% |
[ 1.0% - 1.5% ] 1.17% | 4,411,355 | 13.0% |
[ 1.5% - 2.0% ] 1.66% | 1,443,643 | 11.9% |
[ 2.0% - 2.5% ] 2.21% | 551,121 | 13.3% |
[ 2.5% - 3.0% ] 2.65% | 156,460 | 14.9% |
[ 3.0% - 3.5% ] 3.20% | 66,755 | 15.7% |
[ 3.5% - 4.0% ] 3.70% | 38,602 | 9.6% |
[ 4.0% - 4.5% ] 4.25% | 49,517 | 13.1% |
[ 4.5% - 5.0% ] 4.72% | 49,511 | 17.2% |
[ 5.0% - 5.5% ] 5.21% | 26,543 | 16.5% |
[ 5.5% - 6.0% ] 5.61% | 11,989 | 9.6% |
[ 6.0% - 6.5% ] 6.32% | 7,377 | 13.6% |
[ 6.5% - 7.0% ] 6.83% | 31,585 | 12.3% |
[ 7.0% - 7.5% ] 7.18% | 5,976 | 6.8% |
[ 7.5% - 8.0% ] 7.81% | 12,829 | 10.2% |
[ 8.0% - 8.5% ] 8.34% | 67,378 | 9.9% |
[ 8.5% - 9.0% ] 8.92% | 6,325 | 17.7% |
[ 9.0% - 9.5% ] 9.19% | 3,669 | 8.6% |
[ 9.5% - 10.0% ] 9.61% | 31,825 | 10.0% |
[ 10.0% - 10.5% ] 10.30% | 17,425 | 8.1% |
[ 10.5% - 11.0% ] 10.71% | 20,442 | 11.0% |
[ 11.0% - 11.5% ] 11.24% | 1,513 | 17.2% |
[ 11.5% - 12.0% ] 11.79% | 1,680 | 25.3% |
[ 12.0% - 12.5% ] 12.39% | 464,382 | 12.8% |
[ 12.5% - 13.0% ] 12.81% | 52,995 | 11.1% |
[ 13.0% - 13.5% ] 13.39% | 102,236 | 12.8% |
[ 13.5% - 14.0% ] 13.86% | 101,564 | 12.6% |
[ 14.0% - 14.5% ] 14.35% | 103,149 | 9.9% |
[ 14.5% - 15.0% ] 14.67% | 128,020 | 12.3% |
[ 15.0% - 15.5% ] 15.41% | 6,591 | 10.7% |
[ 15.5% - 16.0% ] 15.77% | 28,431 | 12.5% |
[ 16.0% - 16.5% ] 16.25% | 163,685 | 11.4% |
[ 16.5% - 17.0% ] 16.62% | 28,537 | 12.8% |
[ 17.0% - 17.5% ] 17.14% | 51,321 | 10.9% |
[ 17.5% - 18.0% ] 17.74% | 58,904 | 14.6% |
[ 18.0% - 18.5% ] 18.33% | 4,996 | 12.7% |
[ 18.5% - 19.0% ] 18.85% | 117,714 | 11.0% |
[ 19.0% - 19.5% ] 19.11% | 71,880 | 10.4% |
[ 19.5% - 20.0% ] 19.85% | 35,154 | 8.0% |
[ 20.0% - 20.5% ] 20.36% | 97,208 | 10.3% |
[ 20.5% - 21.0% ] 20.86% | 28,982 | 14.1% |
[ 21.0% - 21.5% ] 21.22% | 21,055 | 8.6% |
[ 21.5% - 22.0% ] 21.64% | 15,015 | 8.1% |
[ 22.0% - 22.5% ] 22.35% | 13,335 | 9.2% |
[ 22.5% - 23.0% ] 22.88% | 43,434 | 10.6% |
[ 23.0% - 23.5% ] 23.43% | 3,073 | 19.2% |
[ 23.5% - 24.0% ] 23.83% | 54,915 | 11.4% |
[ 24.0% - 24.5% ] 24.16% | 7,050 | 18.3% |
[ 24.5% - 25.0% ] 24.68% | 36,062 | 14.1% |
[ 25.0% - 25.5% ] 25.22% | 2,788 | 4.2% |
[ 25.5% - 26.0% ] 25.72% | 13,666 | 9.5% |
[ 26.0% - 26.5% ] 26.30% | 2,255 | 9.8% |
[ 26.5% - 27.0% ] 26.78% | 26,147 | 12.2% |
[ 27.0% - 27.5% ] 27.32% | 63,950 | 12.1% |
[ 27.5% - 28.0% ] 27.81% | 9,568 | 17.8% |
[ 28.0% - 28.5% ] 28.13% | 49,623 | 10.1% |
[ 28.5% - 29.0% ] 28.68% | 38,553 | 10.3% |
[ 29.0% - 29.5% ] 29.29% | 7,767 | 16.7% |
[ 29.5% - 30.0% ] 29.68% | 66,780 | 11.0% |
[ 30.0% - 30.5% ] 30.35% | 3,532 | 15.9% |
[ 30.5% - 31.0% ] 30.64% | 3,691 | 17.6% |
[ 31.0% - 31.5% ] 31.44% | 4,628 | 10.8% |
[ 31.5% - 32.0% ] 31.62% | 7,704 | 17.3% |
[ 32.0% - 32.5% ] 32.34% | 3,145 | 10.3% |
[ 32.5% - 33.0% ] 32.52% | 3,484 | 17.4% |
[ 33.5% - 34.0% ] 33.76% | 55,269 | 11.5% |
[ 34.0% - 34.5% ] 34.33% | 6,216 | 16.6% |
[ 34.5% - 35.0% ] 34.69% | 1,897 | 6.8% |
[ 35.0% - 35.5% ] 35.26% | 27,351 | 18.8% |
[ 35.5% - 36.0% ] 35.92% | 27,766 | 10.8% |
[ 36.0% - 36.5% ] 36.35% | 2,421 | 11.9% |
[ 37.0% - 37.5% ] 37.28% | 5,638 | 13.3% |
[ 37.5% - 38.0% ] 37.79% | 2,625 | 27.0% |
[ 38.0% - 38.5% ] 38.18% | 11,149 | 10.0% |
[ 38.5% - 39.0% ] 38.95% | 50,453 | 14.1% |
[ 39.5% - 40.0% ] 39.66% | 49,256 | 14.4% |
[ 40.0% - 40.5% ] 40.13% | 1,834 | 10.8% |
[ 41.5% - 42.0% ] 41.66% | 1,781 | 12.9% |
[ 42.0% - 42.5% ] 42.22% | 15,863 | 9.5% |
[ 42.5% - 43.0% ] 42.99% | 4,555 | 9.8% |
[ 43.0% - 43.5% ] 43.05% | 11,029 | 11.1% |
[ 43.5% - 44.0% ] 43.78% | 4,429 | 11.4% |
[ 44.0% - 44.5% ] 44.27% | 3,587 | 13.8% |
[ 44.5% - 45.0% ] 44.65% | 4,065 | 12.2% |
[ 45.0% - 45.5% ] 45.29% | 10,042 | 19.7% |
[ 45.5% - 46.0% ] 45.76% | 17,696 | 12.4% |
[ 46.0% - 46.5% ] 46.26% | 1,096 | 14.0% |
[ 46.5% - 47.0% ] 46.76% | 3,593 | 9.6% |
[ 47.5% - 48.0% ] 47.53% | 5,026 | 3.9% |
[ 49.5% - 50.0% ] 49.55% | 890 | 24.4% |
[ 50.0% - 50.5% ] 50.39% | 3,832 | 24.6% |
[ 51.5% - 52.0% ] 51.81% | 4,366 | 18.9% |
[ 53.0% - 53.5% ] 53.45% | 3,686 | 11.7% |
[ 54.5% - 55.0% ] 54.72% | 3,149 | 9.8% |
[ 57.0% - 57.5% ] 57.46% | 731 | 16.5% |
[ 59.5% - 60.0% ] 59.72% | 17,857 | 10.7% |
[ 60.0% - 60.5% ] 60.21% | 480 | 9.3% |
[ 60.5% - 61.0% ] 60.59% | 51,367 | 13.3% |
[ 62.5% - 63.0% ] 62.57% | 2,872 | 9.3% |
[ 63.0% - 63.5% ] 63.35% | 4,827 | 15.8% |
[ 63.5% - 64.0% ] 63.68% | 14,129 | 14.3% |
[ 64.0% - 64.5% ] 64.30% | 902 | 12.5% |
[ 64.5% - 65.0% ] 64.76% | 210 | 11.1% |
[ 65.5% - 66.0% ] 65.97% | 3,553 | 15.4% |
[ 67.5% - 68.0% ] 67.63% | 10,307 | 14.7% |
[ 70.0% - 70.5% ] 70.09% | 3,133 | 8.8% |
[ 73.5% - 74.0% ] 73.53% | 12,370 | 11.5% |
[ 74.0% - 74.5% ] 74.07% | 324 | 19.5% |
[ 75.5% - 76.0% ] 75.96% | 2,853 | 7.4% |
[ 78.0% - 78.5% ] 78.49% | 2,436 | 17.6% |
[ 78.5% - 79.0% ] 78.97% | 4,475 | 18.9% |
[ 92.0% - 92.5% ] 92.27% | 1,436 | 17.4% |