Immigrants from Jamaica vs Indonesian Disability Age Under 5

COMPARE

Immigrants from Jamaica
Race
Ancestry
AfghanAfricanAlaska NativeAlaskan AthabascanAlbanianAleutAlsatianAmericanApacheArabArapahoArgentineanArmenianAssyrian/Chaldean/SyriacAustralianAustrianBahamianBangladeshiBarbadianBasqueBelgianBelizeanBermudanBhutaneseBlackfeetBolivianBrazilianBritishBritish West IndianBulgarianBurmeseCajunCambodianCanadianCape VerdeanCarpatho RusynCelticCentral AmericanCentral American IndianCherokeeCheyenneChickasawChileanChineseChippewaChoctawColombianColvilleComancheCosta RicanCreeCreekCroatianCrowCubanCypriotCzechCzechoslovakianDanishDelawareDominicanDutchDutch West IndianEastern EuropeanEcuadorianEgyptianEnglishEstonianEthiopianEuropeanFijianFilipinoFinnishFrenchFrench American IndianFrench CanadianGermanGerman RussianGhanaianGreekGuamanian/ChamorroGuatemalanGuyaneseHaitianHmongHonduranHopiHoumaHungarianIcelanderIndian (Asian)InupiatIranianIraqiIrishIroquoisIsraeliItalianJamaicanJapaneseJordanianKenyanKiowaKoreanLaotianLatvianLebaneseLiberianLithuanianLumbeeLuxembourgerMacedonianMalaysianMalteseMarshalleseMenomineeMexicanMexican American IndianMongolianMoroccanNative HawaiianNavajoNepaleseNew ZealanderNicaraguanNigerianNorthern EuropeanNorwegianOkinawanOsageOttawaPaiutePakistaniPalestinianPanamanianParaguayanPennsylvania GermanPeruvianPimaPolishPortuguesePotawatomiPuebloPuerto RicanPuget Sound SalishRomanianRussianSalvadoranSamoanScandinavianScotch-IrishScottishSeminoleSenegaleseSerbianShoshoneSierra LeoneanSiouxSlavicSlovakSloveneSomaliSouth AfricanSouth AmericanSouth American IndianSoviet UnionSpaniardSpanishSpanish AmericanSpanish American IndianSri LankanSubsaharan AfricanSudaneseSwedishSwissSyrianTaiwaneseThaiTlingit-HaidaTohono O'OdhamTonganTrinidadian and TobagonianTsimshianTurkishU.S. Virgin IslanderUgandanUkrainianUruguayanUteVenezuelanVietnameseWelshWest IndianYakamaYaquiYugoslavianYumanYup'ikZimbabwean
Immigration
NonimmigrantsImmigrantsAfghanistanAfricaAlbaniaArgentinaArmeniaAsiaAustraliaAustriaBahamasBangladeshBarbadosBelarusBelgiumBelizeBoliviaBosnia and HerzegovinaBrazilBulgariaBurma/MyanmarCabo VerdeCambodiaCameroonCanadaCaribbeanCentral AmericaChileChinaColombiaCongoCosta RicaCroatiaCubaCzechoslovakiaDenmarkDominicaDominican RepublicEastern AfricaEastern AsiaEastern EuropeEcuadorEgyptEl SalvadorEnglandEritreaEthiopiaEuropeFijiFranceGermanyGhanaGreeceGrenadaGuatemalaGuyanaHaitiHondurasHong KongHungaryIndiaIndonesiaIranIraqIrelandIsraelItalyJamaicaJapanJordanKazakhstanKenyaKoreaKuwaitLaosLatin AmericaLatviaLebanonLiberiaLithuaniaMalaysiaMexicoMicronesiaMiddle AfricaMoldovaMoroccoNepalNetherlandsNicaraguaNigeriaNorth AmericaNorth MacedoniaNorthern AfricaNorthern EuropeNorwayOceaniaPakistanPanamaPeruPhilippinesPolandPortugalRomaniaRussiaSaudi ArabiaScotlandSenegalSerbiaSierra LeoneSingaporeSomaliaSouth AfricaSouth AmericaSouth Central AsiaSouth Eastern AsiaSouthern EuropeSpainSri LankaSt. Vincent and the GrenadinesSudanSwedenSwitzerlandSyriaTaiwanThailandTrinidad and TobagoTurkeyUgandaUkraineUruguayUzbekistanVenezuelaVietnamWest IndiesWestern AfricaWestern AsiaWestern EuropeYemenZaireZimbabweAzores
Indonesian
Race
Ancestry
AfghanAfricanAlaska NativeAlaskan AthabascanAlbanianAleutAlsatianAmericanApacheArabArapahoArgentineanArmenianAssyrian/Chaldean/SyriacAustralianAustrianBahamianBangladeshiBarbadianBasqueBelgianBelizeanBermudanBhutaneseBlackfeetBolivianBrazilianBritishBritish West IndianBulgarianBurmeseCajunCambodianCanadianCape VerdeanCarpatho RusynCelticCentral AmericanCentral American IndianCherokeeCheyenneChickasawChileanChineseChippewaChoctawColombianColvilleComancheCosta RicanCreeCreekCroatianCrowCubanCypriotCzechCzechoslovakianDanishDelawareDominicanDutchDutch West IndianEastern EuropeanEcuadorianEgyptianEnglishEstonianEthiopianEuropeanFijianFilipinoFinnishFrenchFrench American IndianFrench CanadianGermanGerman RussianGhanaianGreekGuamanian/ChamorroGuatemalanGuyaneseHaitianHmongHonduranHopiHoumaHungarianIcelanderIndian (Asian)IndonesianInupiatIranianIraqiIrishIroquoisIsraeliItalianJamaicanJapaneseJordanianKenyanKiowaKoreanLaotianLatvianLebaneseLiberianLithuanianLumbeeLuxembourgerMacedonianMalaysianMalteseMarshalleseMenomineeMexicanMexican American IndianMongolianMoroccanNative HawaiianNavajoNepaleseNew ZealanderNicaraguanNigerianNorthern EuropeanNorwegianOkinawanOsageOttawaPaiutePakistaniPalestinianPanamanianParaguayanPennsylvania GermanPeruvianPimaPolishPortuguesePotawatomiPuebloPuerto RicanPuget Sound SalishRomanianRussianSalvadoranSamoanScandinavianScotch-IrishScottishSeminoleSenegaleseSerbianShoshoneSierra LeoneanSiouxSlavicSlovakSloveneSomaliSouth AfricanSouth AmericanSouth American IndianSoviet UnionSpaniardSpanishSpanish AmericanSpanish American IndianSri LankanSubsaharan AfricanSudaneseSwedishSwissSyrianTaiwaneseThaiTlingit-HaidaTohono O'OdhamTonganTrinidadian and TobagonianTsimshianTurkishU.S. Virgin IslanderUgandanUkrainianUruguayanUteVenezuelanVietnameseWelshWest IndianYakamaYaquiYugoslavianYumanYup'ikZimbabwean
Immigration
NonimmigrantsImmigrantsAfghanistanAfricaAlbaniaArgentinaArmeniaAsiaAustraliaAustriaBahamasBangladeshBarbadosBelarusBelgiumBelizeBoliviaBosnia and HerzegovinaBrazilBulgariaBurma/MyanmarCabo VerdeCambodiaCameroonCanadaCaribbeanCentral AmericaChileChinaColombiaCongoCosta RicaCroatiaCubaCzechoslovakiaDenmarkDominicaDominican RepublicEastern AfricaEastern AsiaEastern EuropeEcuadorEgyptEl SalvadorEnglandEritreaEthiopiaEuropeFijiFranceGermanyGhanaGreeceGrenadaGuatemalaGuyanaHaitiHondurasHong KongHungaryIndiaIndonesiaIranIraqIrelandIsraelItalyJapanJordanKazakhstanKenyaKoreaKuwaitLaosLatin AmericaLatviaLebanonLiberiaLithuaniaMalaysiaMexicoMicronesiaMiddle AfricaMoldovaMoroccoNepalNetherlandsNicaraguaNigeriaNorth AmericaNorth MacedoniaNorthern AfricaNorthern EuropeNorwayOceaniaPakistanPanamaPeruPhilippinesPolandPortugalRomaniaRussiaSaudi ArabiaScotlandSenegalSerbiaSierra LeoneSingaporeSomaliaSouth AfricaSouth AmericaSouth Central AsiaSouth Eastern AsiaSouthern EuropeSpainSri LankaSt. Vincent and the GrenadinesSudanSwedenSwitzerlandSyriaTaiwanThailandTrinidad and TobagoTurkeyUgandaUkraineUruguayUzbekistanVenezuelaVietnamWest IndiesWestern AfricaWestern AsiaWestern EuropeYemenZaireZimbabweAzores
Disability Age Under 5
Income
Poverty
Unemployment
Labor Participation
Family Structure
Vehicle Availability
Education Level
Disability

Disability Age Under 5 Comparison

Immigrants from Jamaica

Indonesians

Average
Exceptional
1.2%
DISABILITY AGE UNDER 5
58.8/ 100
METRIC RATING
170th/ 347
METRIC RANK
1.2%
DISABILITY AGE UNDER 5
95.9/ 100
METRIC RATING
104th/ 347
METRIC RANK

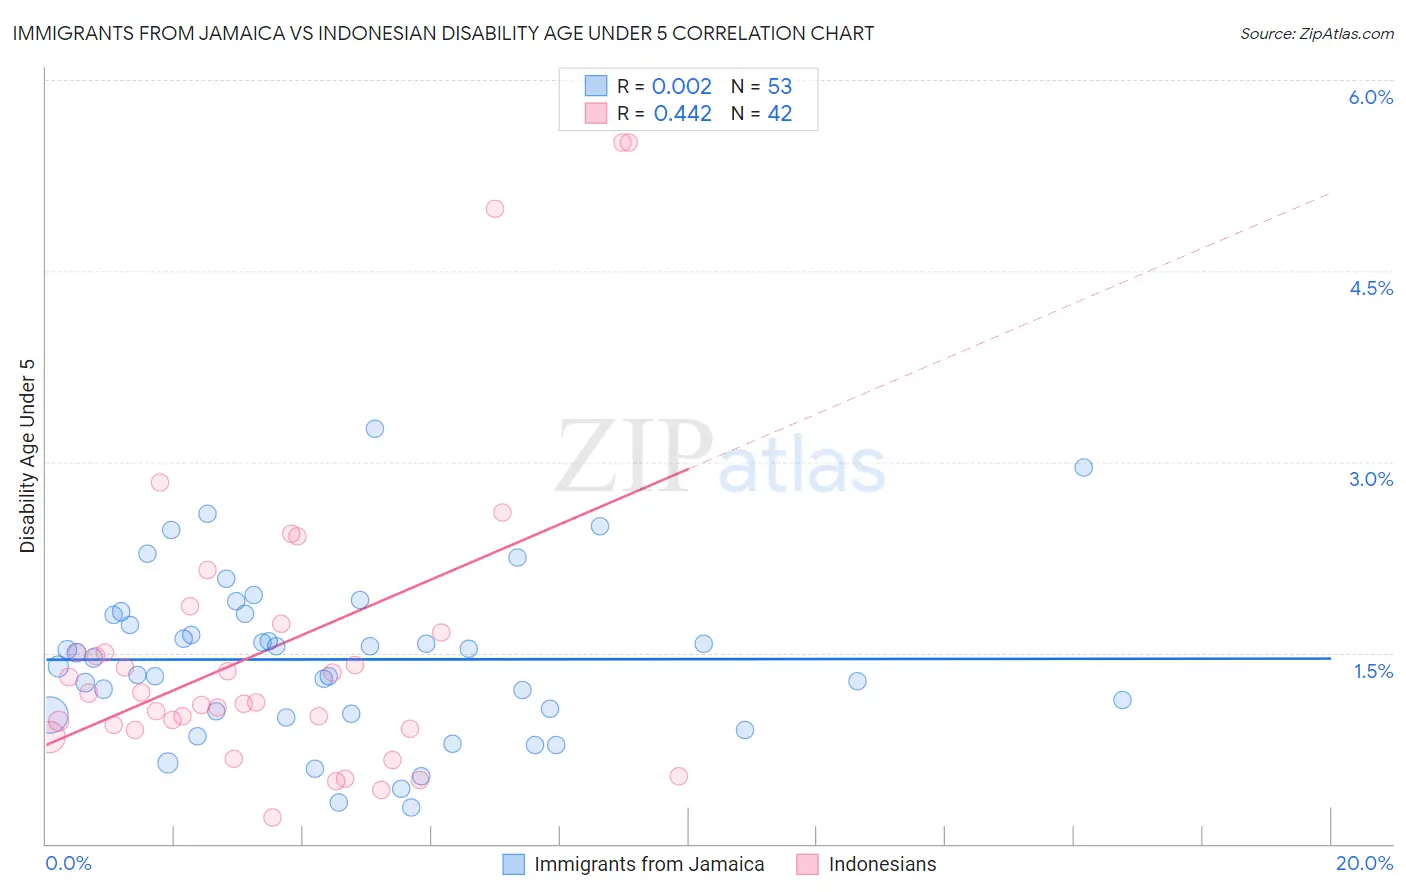
Immigrants from Jamaica vs Indonesian Disability Age Under 5 Correlation Chart

The statistical analysis conducted on geographies consisting of 173,327,307 people shows no correlation between the proportion of Immigrants from Jamaica and percentage of population with a disability under the age of 5 in the United States with a correlation coefficient (R) of 0.002 and weighted average of 1.2%. Similarly, the statistical analysis conducted on geographies consisting of 116,670,957 people shows a moderate positive correlation between the proportion of Indonesians and percentage of population with a disability under the age of 5 in the United States with a correlation coefficient (R) of 0.442 and weighted average of 1.2%, a difference of 6.8%.
Immigrants from Jamaica vs Indonesian Disability Age Under 5

Disability Age Under 5 Correlation Summary

MeasurementImmigrants from JamaicaIndonesian
Minimum0.28%0.21%
Maximum3.3%5.5%
Range3.0%5.3%
Mean1.4%1.5%
Median1.5%1.1%
Interquartile 25% (IQ1)1.0%0.90%
Interquartile 75% (IQ3)1.8%1.7%
Interquartile Range (IQR)0.78%0.76%
Standard Deviation (Sample)0.64%1.2%
Standard Deviation (Population)0.63%1.2%

Similar Demographics by Disability Age Under 5

Demographics Similar to Immigrants from Jamaica by Disability Age Under 5

In terms of disability age under 5, the demographic groups most similar to Immigrants from Jamaica are Immigrants from Uruguay (1.2%, a difference of 0.020%), Sierra Leonean (1.2%, a difference of 0.030%), Guamanian/Chamorro (1.2%, a difference of 0.090%), Immigrants from Argentina (1.2%, a difference of 0.13%), and Immigrants from Central America (1.2%, a difference of 0.25%).
DemographicsRating | RankDisability Age Under 5
Immigrants | Guatemala
63.2
/100
|
#163
Good
1.2%
Laotians
62.8
/100
|
#164
Good
1.2%
Immigrants | Kuwait
62.6
/100
|
#165
Good
1.2%
Immigrants | Central America
61.4
/100
|
#166
Good
1.2%
Immigrants | Argentina
60.2
/100
|
#167
Good
1.2%
Sierra Leoneans
59.1
/100
|
#168
Average
1.2%
Immigrants | Uruguay
59.0
/100
|
#169
Average
1.2%
Immigrants | Jamaica
58.8
/100
|
#170
Average
1.2%
Guamanians/Chamorros
57.8
/100
|
#171
Average
1.2%
Crow
51.0
/100
|
#172
Average
1.2%
Immigrants | Ireland
50.3
/100
|
#173
Average
1.2%
Immigrants | Latvia
50.0
/100
|
#174
Average
1.2%
Immigrants | Nigeria
50.0
/100
|
#175
Average
1.2%
Immigrants | Kenya
48.6
/100
|
#176
Average
1.2%
Comanche
47.5
/100
|
#177
Average
1.2%

Demographics Similar to Indonesians by Disability Age Under 5

In terms of disability age under 5, the demographic groups most similar to Indonesians are Immigrants from Morocco (1.2%, a difference of 0.070%), Immigrants from Nicaragua (1.2%, a difference of 0.070%), Immigrants from Uganda (1.1%, a difference of 0.12%), Immigrants from South Africa (1.2%, a difference of 0.19%), and Nicaraguan (1.1%, a difference of 0.24%).
DemographicsRating | RankDisability Age Under 5
Immigrants | Iraq
96.5
/100
|
#97
Exceptional
1.1%
Immigrants | South Eastern Asia
96.5
/100
|
#98
Exceptional
1.1%
Dominicans
96.3
/100
|
#99
Exceptional
1.1%
Nicaraguans
96.3
/100
|
#100
Exceptional
1.1%
Immigrants | Uganda
96.1
/100
|
#101
Exceptional
1.1%
Immigrants | Morocco
96.0
/100
|
#102
Exceptional
1.2%
Immigrants | Nicaragua
96.0
/100
|
#103
Exceptional
1.2%
Indonesians
95.9
/100
|
#104
Exceptional
1.2%
Immigrants | South Africa
95.6
/100
|
#105
Exceptional
1.2%
Cambodians
95.4
/100
|
#106
Exceptional
1.2%
Immigrants | West Indies
95.3
/100
|
#107
Exceptional
1.2%
Iraqis
95.1
/100
|
#108
Exceptional
1.2%
Immigrants | Panama
95.0
/100
|
#109
Exceptional
1.2%
Immigrants | Lebanon
95.0
/100
|
#110
Exceptional
1.2%
Senegalese
94.6
/100
|
#111
Exceptional
1.2%