Immigrants from France vs Immigrants from Peru 2 or more Vehicles in Household

COMPARE

Immigrants from France
Race
Ancestry
AfghanAfricanAlaska NativeAlaskan AthabascanAlbanianAleutAlsatianAmericanApacheArabArapahoArgentineanArmenianAssyrian/Chaldean/SyriacAustralianAustrianBahamianBangladeshiBarbadianBasqueBelgianBelizeanBermudanBhutaneseBlackfeetBolivianBrazilianBritishBritish West IndianBulgarianBurmeseCajunCambodianCanadianCape VerdeanCarpatho RusynCelticCentral AmericanCentral American IndianCherokeeCheyenneChickasawChileanChineseChippewaChoctawColombianColvilleComancheCosta RicanCreeCreekCroatianCrowCubanCypriotCzechCzechoslovakianDanishDelawareDominicanDutchDutch West IndianEastern EuropeanEcuadorianEgyptianEnglishEstonianEthiopianEuropeanFijianFilipinoFinnishFrenchFrench American IndianFrench CanadianGermanGerman RussianGhanaianGreekGuamanian/ChamorroGuatemalanGuyaneseHaitianHmongHonduranHopiHoumaHungarianIcelanderIndian (Asian)IndonesianInupiatIranianIraqiIrishIroquoisIsraeliItalianJamaicanJapaneseJordanianKenyanKiowaKoreanLaotianLatvianLebaneseLiberianLithuanianLumbeeLuxembourgerMacedonianMalaysianMalteseMarshalleseMenomineeMexicanMexican American IndianMongolianMoroccanNative HawaiianNavajoNepaleseNew ZealanderNicaraguanNigerianNorthern EuropeanNorwegianOkinawanOsageOttawaPaiutePakistaniPalestinianPanamanianParaguayanPennsylvania GermanPeruvianPimaPolishPortuguesePotawatomiPuebloPuerto RicanPuget Sound SalishRomanianRussianSalvadoranSamoanScandinavianScotch-IrishScottishSeminoleSenegaleseSerbianShoshoneSierra LeoneanSiouxSlavicSlovakSloveneSomaliSouth AfricanSouth AmericanSouth American IndianSoviet UnionSpaniardSpanishSpanish AmericanSpanish American IndianSri LankanSubsaharan AfricanSudaneseSwedishSwissSyrianTaiwaneseThaiTlingit-HaidaTohono O'OdhamTonganTrinidadian and TobagonianTsimshianTurkishU.S. Virgin IslanderUgandanUkrainianUruguayanUteVenezuelanVietnameseWelshWest IndianYakamaYaquiYugoslavianYumanYup'ikZimbabwean
Immigration
NonimmigrantsImmigrantsAfghanistanAfricaAlbaniaArgentinaArmeniaAsiaAustraliaAustriaBahamasBangladeshBarbadosBelarusBelgiumBelizeBoliviaBosnia and HerzegovinaBrazilBulgariaBurma/MyanmarCabo VerdeCambodiaCameroonCanadaCaribbeanCentral AmericaChileChinaColombiaCongoCosta RicaCroatiaCubaCzechoslovakiaDenmarkDominicaDominican RepublicEastern AfricaEastern AsiaEastern EuropeEcuadorEgyptEl SalvadorEnglandEritreaEthiopiaEuropeFijiFranceGermanyGhanaGreeceGrenadaGuatemalaGuyanaHaitiHondurasHong KongHungaryIndiaIndonesiaIranIraqIrelandIsraelItalyJamaicaJapanJordanKazakhstanKenyaKoreaKuwaitLaosLatin AmericaLatviaLebanonLiberiaLithuaniaMalaysiaMexicoMicronesiaMiddle AfricaMoldovaMoroccoNepalNetherlandsNicaraguaNigeriaNorth AmericaNorth MacedoniaNorthern AfricaNorthern EuropeNorwayOceaniaPakistanPanamaPhilippinesPolandPortugalRomaniaRussiaSaudi ArabiaScotlandSenegalSerbiaSierra LeoneSingaporeSomaliaSouth AfricaSouth AmericaSouth Central AsiaSouth Eastern AsiaSouthern EuropeSpainSri LankaSt. Vincent and the GrenadinesSudanSwedenSwitzerlandSyriaTaiwanThailandTrinidad and TobagoTurkeyUgandaUkraineUruguayUzbekistanVenezuelaVietnamWest IndiesWestern AfricaWestern AsiaWestern EuropeYemenZaireZimbabweAzores
Immigrants from Peru
Race
Ancestry
AfghanAfricanAlaska NativeAlaskan AthabascanAlbanianAleutAlsatianAmericanApacheArabArapahoArgentineanArmenianAssyrian/Chaldean/SyriacAustralianAustrianBahamianBangladeshiBarbadianBasqueBelgianBelizeanBermudanBhutaneseBlackfeetBolivianBrazilianBritishBritish West IndianBulgarianBurmeseCajunCambodianCanadianCape VerdeanCarpatho RusynCelticCentral AmericanCentral American IndianCherokeeCheyenneChickasawChileanChineseChippewaChoctawColombianColvilleComancheCosta RicanCreeCreekCroatianCrowCubanCypriotCzechCzechoslovakianDanishDelawareDominicanDutchDutch West IndianEastern EuropeanEcuadorianEgyptianEnglishEstonianEthiopianEuropeanFijianFilipinoFinnishFrenchFrench American IndianFrench CanadianGermanGerman RussianGhanaianGreekGuamanian/ChamorroGuatemalanGuyaneseHaitianHmongHonduranHopiHoumaHungarianIcelanderIndian (Asian)IndonesianInupiatIranianIraqiIrishIroquoisIsraeliItalianJamaicanJapaneseJordanianKenyanKiowaKoreanLaotianLatvianLebaneseLiberianLithuanianLumbeeLuxembourgerMacedonianMalaysianMalteseMarshalleseMenomineeMexicanMexican American IndianMongolianMoroccanNative HawaiianNavajoNepaleseNew ZealanderNicaraguanNigerianNorthern EuropeanNorwegianOkinawanOsageOttawaPaiutePakistaniPalestinianPanamanianParaguayanPennsylvania GermanPeruvianPimaPolishPortuguesePotawatomiPuebloPuerto RicanPuget Sound SalishRomanianRussianSalvadoranSamoanScandinavianScotch-IrishScottishSeminoleSenegaleseSerbianShoshoneSierra LeoneanSiouxSlavicSlovakSloveneSomaliSouth AfricanSouth AmericanSouth American IndianSoviet UnionSpaniardSpanishSpanish AmericanSpanish American IndianSri LankanSubsaharan AfricanSudaneseSwedishSwissSyrianTaiwaneseThaiTlingit-HaidaTohono O'OdhamTonganTrinidadian and TobagonianTsimshianTurkishU.S. Virgin IslanderUgandanUkrainianUruguayanUteVenezuelanVietnameseWelshWest IndianYakamaYaquiYugoslavianYumanYup'ikZimbabwean
Immigration
NonimmigrantsImmigrantsAfghanistanAfricaAlbaniaArgentinaArmeniaAsiaAustraliaAustriaBahamasBangladeshBarbadosBelarusBelgiumBelizeBoliviaBosnia and HerzegovinaBrazilBulgariaBurma/MyanmarCabo VerdeCambodiaCameroonCanadaCaribbeanCentral AmericaChileChinaColombiaCongoCosta RicaCroatiaCubaCzechoslovakiaDenmarkDominicaDominican RepublicEastern AfricaEastern AsiaEastern EuropeEcuadorEgyptEl SalvadorEnglandEritreaEthiopiaEuropeFijiGermanyGhanaGreeceGrenadaGuatemalaGuyanaHaitiHondurasHong KongHungaryIndiaIndonesiaIranIraqIrelandIsraelItalyJamaicaJapanJordanKazakhstanKenyaKoreaKuwaitLaosLatin AmericaLatviaLebanonLiberiaLithuaniaMalaysiaMexicoMicronesiaMiddle AfricaMoldovaMoroccoNepalNetherlandsNicaraguaNigeriaNorth AmericaNorth MacedoniaNorthern AfricaNorthern EuropeNorwayOceaniaPakistanPanamaPeruPhilippinesPolandPortugalRomaniaRussiaSaudi ArabiaScotlandSenegalSerbiaSierra LeoneSingaporeSomaliaSouth AfricaSouth AmericaSouth Central AsiaSouth Eastern AsiaSouthern EuropeSpainSri LankaSt. Vincent and the GrenadinesSudanSwedenSwitzerlandSyriaTaiwanThailandTrinidad and TobagoTurkeyUgandaUkraineUruguayUzbekistanVenezuelaVietnamWest IndiesWestern AfricaWestern AsiaWestern EuropeYemenZaireZimbabweAzores
2 or more Vehicles in Household
Income
Poverty
Unemployment
Labor Participation
Family Structure
Vehicle Availability
Education Level
Disability

2 or more Vehicles in Household Comparison

Immigrants from France

Immigrants from Peru

Tragic
Poor
52.0%
2 OR MORE VEHICLES IN HOUSEHOLD
0.2/ 100
METRIC RATING
266th/ 347
METRIC RANK
54.4%
2 OR MORE VEHICLES IN HOUSEHOLD
14.3/ 100
METRIC RATING
203rd/ 347
METRIC RANK

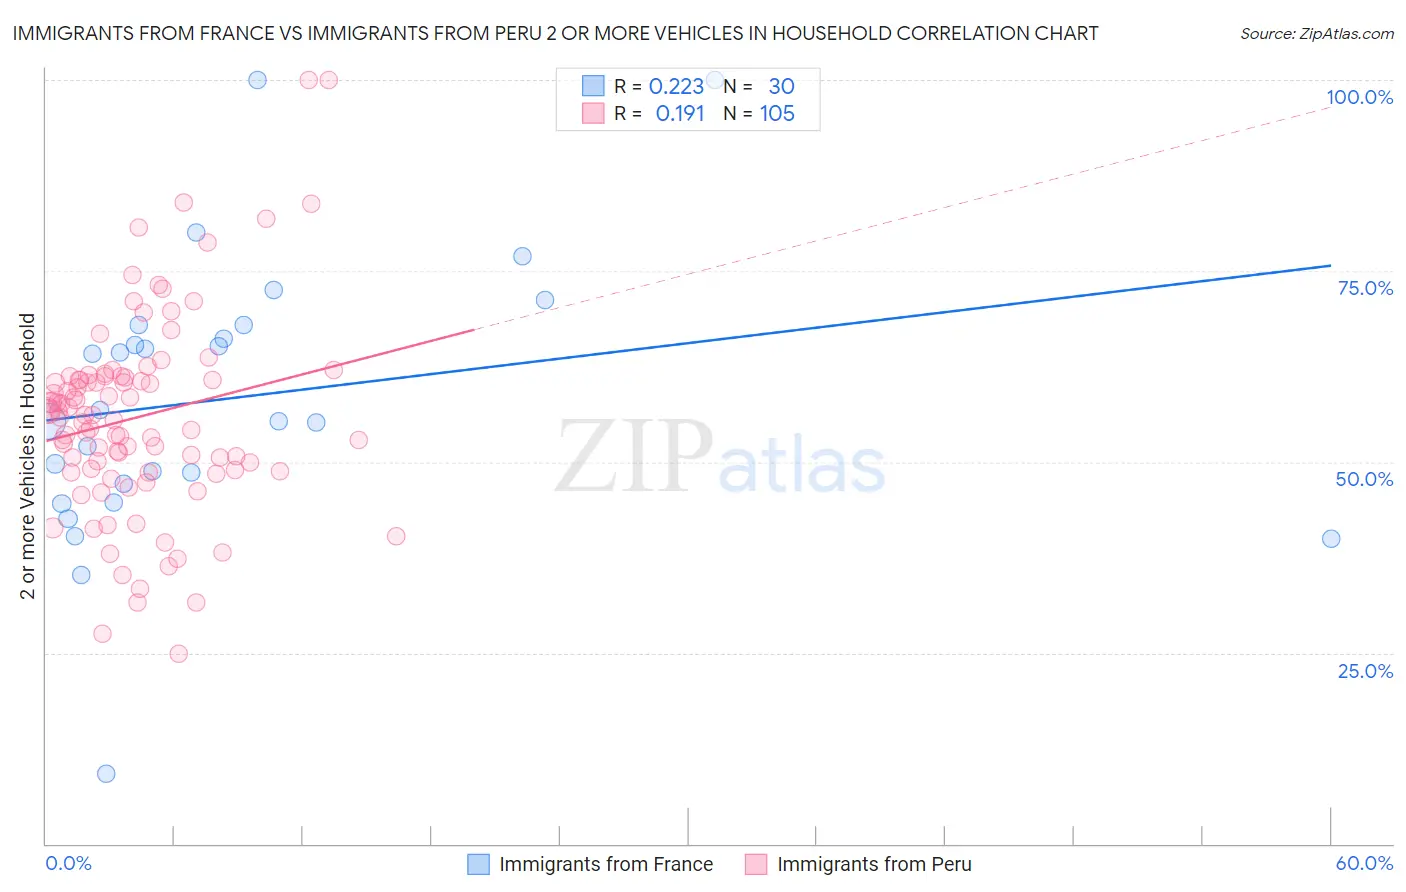
Immigrants from France vs Immigrants from Peru 2 or more Vehicles in Household Correlation Chart

The statistical analysis conducted on geographies consisting of 287,851,745 people shows a weak positive correlation between the proportion of Immigrants from France and percentage of households with 2 or more vehicles available in the United States with a correlation coefficient (R) of 0.223 and weighted average of 52.0%. Similarly, the statistical analysis conducted on geographies consisting of 328,775,084 people shows a poor positive correlation between the proportion of Immigrants from Peru and percentage of households with 2 or more vehicles available in the United States with a correlation coefficient (R) of 0.191 and weighted average of 54.4%, a difference of 4.5%.
Immigrants from France vs Immigrants from Peru 2 or more Vehicles in Household

2 or more Vehicles in Household Correlation Summary

MeasurementImmigrants from FranceImmigrants from Peru
Minimum9.2%24.9%
Maximum100.0%100.0%
Range90.8%75.1%
Mean58.4%55.9%
Median56.1%56.1%
Interquartile 25% (IQ1)47.1%48.8%
Interquartile 75% (IQ3)68.0%61.2%
Interquartile Range (IQR)20.9%12.4%
Standard Deviation (Sample)18.4%13.0%
Standard Deviation (Population)18.1%13.0%

Similar Demographics by 2 or more Vehicles in Household

Demographics Similar to Immigrants from France by 2 or more Vehicles in Household

In terms of 2 or more vehicles in household, the demographic groups most similar to Immigrants from France are Immigrants from Colombia (52.0%, a difference of 0.050%), Pima (52.0%, a difference of 0.060%), Honduran (52.0%, a difference of 0.060%), Immigrants from Ireland (52.0%, a difference of 0.080%), and Immigrants from Congo (52.1%, a difference of 0.14%).
DemographicsRating | Rank2 or more Vehicles in Household
Alsatians
0.6
/100
|
#259
Tragic
52.5%
Immigrants | Bahamas
0.5
/100
|
#260
Tragic
52.5%
Immigrants | Australia
0.5
/100
|
#261
Tragic
52.4%
Immigrants | Northern Africa
0.4
/100
|
#262
Tragic
52.3%
Immigrants | Southern Europe
0.4
/100
|
#263
Tragic
52.3%
Immigrants | Latvia
0.4
/100
|
#264
Tragic
52.2%
Immigrants | Congo
0.3
/100
|
#265
Tragic
52.1%
Immigrants | France
0.2
/100
|
#266
Tragic
52.0%
Immigrants | Colombia
0.2
/100
|
#267
Tragic
52.0%
Pima
0.2
/100
|
#268
Tragic
52.0%
Hondurans
0.2
/100
|
#269
Tragic
52.0%
Immigrants | Ireland
0.2
/100
|
#270
Tragic
52.0%
South Americans
0.2
/100
|
#271
Tragic
51.9%
Sub-Saharan Africans
0.2
/100
|
#272
Tragic
51.9%
Israelis
0.2
/100
|
#273
Tragic
51.9%

Demographics Similar to Immigrants from Peru by 2 or more Vehicles in Household

In terms of 2 or more vehicles in household, the demographic groups most similar to Immigrants from Peru are Immigrants from North Macedonia (54.4%, a difference of 0.040%), Immigrants from Belgium (54.3%, a difference of 0.050%), Cheyenne (54.3%, a difference of 0.060%), Immigrants from Italy (54.4%, a difference of 0.090%), and Immigrants from Latin America (54.3%, a difference of 0.11%).
DemographicsRating | Rank2 or more Vehicles in Household
Immigrants | Poland
19.3
/100
|
#196
Poor
54.6%
Argentineans
17.5
/100
|
#197
Poor
54.5%
Carpatho Rusyns
16.2
/100
|
#198
Poor
54.4%
Immigrants | Norway
15.9
/100
|
#199
Poor
54.4%
Houma
15.8
/100
|
#200
Poor
54.4%
Immigrants | Italy
15.5
/100
|
#201
Poor
54.4%
Immigrants | North Macedonia
14.9
/100
|
#202
Poor
54.4%
Immigrants | Peru
14.3
/100
|
#203
Poor
54.4%
Immigrants | Belgium
13.7
/100
|
#204
Poor
54.3%
Cheyenne
13.6
/100
|
#205
Poor
54.3%
Immigrants | Latin America
13.1
/100
|
#206
Poor
54.3%
Turks
13.0
/100
|
#207
Poor
54.3%
Egyptians
12.0
/100
|
#208
Poor
54.3%
Immigrants | Bulgaria
12.0
/100
|
#209
Poor
54.3%
Immigrants | Saudi Arabia
11.3
/100
|
#210
Poor
54.2%