Liberian vs Immigrants from Hungary Unemployment Among Women with Children Ages 6 to 17 years

COMPARE

Liberian
Race
Ancestry
AfghanAfricanAlaska NativeAlaskan AthabascanAlbanianAleutAlsatianAmericanApacheArabArapahoArgentineanArmenianAssyrian/Chaldean/SyriacAustralianAustrianBahamianBangladeshiBarbadianBasqueBelgianBelizeanBermudanBhutaneseBlackfeetBolivianBrazilianBritishBritish West IndianBulgarianBurmeseCajunCambodianCanadianCape VerdeanCarpatho RusynCelticCentral AmericanCentral American IndianCherokeeCheyenneChickasawChileanChineseChippewaChoctawColombianColvilleComancheCosta RicanCreeCreekCroatianCrowCubanCypriotCzechCzechoslovakianDanishDelawareDominicanDutchDutch West IndianEastern EuropeanEcuadorianEgyptianEnglishEstonianEthiopianEuropeanFijianFilipinoFinnishFrenchFrench American IndianFrench CanadianGermanGerman RussianGhanaianGreekGuamanian/ChamorroGuatemalanGuyaneseHaitianHmongHonduranHopiHoumaHungarianIcelanderIndian (Asian)IndonesianInupiatIranianIraqiIrishIroquoisIsraeliItalianJamaicanJapaneseJordanianKenyanKiowaKoreanLaotianLatvianLebaneseLiberianLithuanianLumbeeLuxembourgerMacedonianMalaysianMalteseMarshalleseMenomineeMexicanMexican American IndianMongolianMoroccanNative HawaiianNavajoNepaleseNew ZealanderNicaraguanNigerianNorthern EuropeanNorwegianOkinawanOsageOttawaPaiutePakistaniPalestinianPanamanianParaguayanPennsylvania GermanPeruvianPimaPolishPortuguesePotawatomiPuebloPuerto RicanPuget Sound SalishRomanianRussianSalvadoranSamoanScandinavianScotch-IrishScottishSeminoleSenegaleseSerbianShoshoneSierra LeoneanSiouxSlavicSlovakSloveneSomaliSouth AfricanSouth AmericanSouth American IndianSoviet UnionSpaniardSpanishSpanish AmericanSpanish American IndianSri LankanSubsaharan AfricanSudaneseSwedishSwissSyrianTaiwaneseThaiTlingit-HaidaTohono O'OdhamTonganTrinidadian and TobagonianTsimshianTurkishU.S. Virgin IslanderUgandanUkrainianUruguayanUteVenezuelanVietnameseWelshWest IndianYakamaYaquiYugoslavianYumanYup'ikZimbabwean
Immigration
NonimmigrantsImmigrantsAfghanistanAfricaAlbaniaArgentinaArmeniaAsiaAustraliaAustriaBahamasBangladeshBarbadosBelarusBelgiumBelizeBoliviaBosnia and HerzegovinaBrazilBulgariaBurma/MyanmarCabo VerdeCambodiaCameroonCanadaCaribbeanCentral AmericaChileChinaColombiaCongoCosta RicaCroatiaCubaCzechoslovakiaDenmarkDominicaDominican RepublicEastern AfricaEastern AsiaEastern EuropeEcuadorEgyptEl SalvadorEnglandEritreaEthiopiaEuropeFijiFranceGermanyGhanaGreeceGrenadaGuatemalaGuyanaHaitiHondurasHong KongIndiaIndonesiaIranIraqIrelandIsraelItalyJamaicaJapanJordanKazakhstanKenyaKoreaKuwaitLaosLatin AmericaLatviaLebanonLiberiaLithuaniaMalaysiaMexicoMicronesiaMiddle AfricaMoldovaMoroccoNepalNetherlandsNicaraguaNigeriaNorth AmericaNorth MacedoniaNorthern AfricaNorthern EuropeNorwayOceaniaPakistanPanamaPeruPhilippinesPolandPortugalRomaniaRussiaSaudi ArabiaScotlandSenegalSerbiaSierra LeoneSingaporeSomaliaSouth AfricaSouth AmericaSouth Central AsiaSouth Eastern AsiaSouthern EuropeSpainSri LankaSt. Vincent and the GrenadinesSudanSwedenSwitzerlandSyriaTaiwanThailandTrinidad and TobagoTurkeyUgandaUkraineUruguayUzbekistanVenezuelaVietnamWest IndiesWestern AfricaWestern AsiaWestern EuropeYemenZaireZimbabweAzores
Immigrants from Hungary
Race
Ancestry
AfghanAfricanAlaska NativeAlaskan AthabascanAlbanianAleutAlsatianAmericanApacheArabArapahoArgentineanArmenianAssyrian/Chaldean/SyriacAustralianAustrianBahamianBangladeshiBarbadianBasqueBelgianBelizeanBermudanBhutaneseBlackfeetBolivianBrazilianBritishBritish West IndianBulgarianBurmeseCajunCambodianCanadianCape VerdeanCarpatho RusynCelticCentral AmericanCentral American IndianCherokeeCheyenneChickasawChileanChineseChippewaChoctawColombianColvilleComancheCosta RicanCreeCreekCroatianCrowCubanCypriotCzechCzechoslovakianDanishDelawareDominicanDutchDutch West IndianEastern EuropeanEcuadorianEgyptianEnglishEstonianEthiopianEuropeanFijianFilipinoFinnishFrenchFrench American IndianFrench CanadianGermanGerman RussianGhanaianGreekGuamanian/ChamorroGuatemalanGuyaneseHaitianHmongHonduranHopiHoumaHungarianIcelanderIndian (Asian)IndonesianInupiatIranianIraqiIrishIroquoisIsraeliItalianJamaicanJapaneseJordanianKenyanKiowaKoreanLaotianLatvianLebaneseLithuanianLumbeeLuxembourgerMacedonianMalaysianMalteseMarshalleseMenomineeMexicanMexican American IndianMongolianMoroccanNative HawaiianNavajoNepaleseNew ZealanderNicaraguanNigerianNorthern EuropeanNorwegianOkinawanOsageOttawaPaiutePakistaniPalestinianPanamanianParaguayanPennsylvania GermanPeruvianPimaPolishPortuguesePotawatomiPuebloPuerto RicanPuget Sound SalishRomanianRussianSalvadoranSamoanScandinavianScotch-IrishScottishSeminoleSenegaleseSerbianShoshoneSierra LeoneanSiouxSlavicSlovakSloveneSomaliSouth AfricanSouth AmericanSouth American IndianSoviet UnionSpaniardSpanishSpanish AmericanSpanish American IndianSri LankanSubsaharan AfricanSudaneseSwedishSwissSyrianTaiwaneseThaiTlingit-HaidaTohono O'OdhamTonganTrinidadian and TobagonianTsimshianTurkishU.S. Virgin IslanderUgandanUkrainianUruguayanUteVenezuelanVietnameseWelshWest IndianYakamaYaquiYugoslavianYumanYup'ikZimbabwean
Immigration
NonimmigrantsImmigrantsAfghanistanAfricaAlbaniaArgentinaArmeniaAsiaAustraliaAustriaBahamasBangladeshBarbadosBelarusBelgiumBelizeBoliviaBosnia and HerzegovinaBrazilBulgariaBurma/MyanmarCabo VerdeCambodiaCameroonCanadaCaribbeanCentral AmericaChileChinaColombiaCongoCosta RicaCroatiaCubaCzechoslovakiaDenmarkDominicaDominican RepublicEastern AfricaEastern AsiaEastern EuropeEcuadorEgyptEl SalvadorEnglandEritreaEthiopiaEuropeFijiFranceGermanyGhanaGreeceGrenadaGuatemalaGuyanaHaitiHondurasHong KongHungaryIndiaIndonesiaIranIraqIrelandIsraelItalyJamaicaJapanJordanKazakhstanKenyaKoreaKuwaitLaosLatin AmericaLatviaLebanonLiberiaLithuaniaMalaysiaMexicoMicronesiaMiddle AfricaMoldovaMoroccoNepalNetherlandsNicaraguaNigeriaNorth AmericaNorth MacedoniaNorthern AfricaNorthern EuropeNorwayOceaniaPakistanPanamaPeruPhilippinesPolandPortugalRomaniaRussiaSaudi ArabiaScotlandSenegalSerbiaSierra LeoneSingaporeSomaliaSouth AfricaSouth AmericaSouth Central AsiaSouth Eastern AsiaSouthern EuropeSpainSri LankaSt. Vincent and the GrenadinesSudanSwedenSwitzerlandSyriaTaiwanThailandTrinidad and TobagoTurkeyUgandaUkraineUruguayUzbekistanVenezuelaVietnamWest IndiesWestern AfricaWestern AsiaWestern EuropeYemenZaireZimbabweAzores
Unemployment Among Women with Children Ages 6 to 17 years
Income
Poverty
Unemployment
Labor Participation
Family Structure
Vehicle Availability
Education Level
Disability

Unemployment Among Women with Children Ages 6 to 17 years Comparison

Liberians

Immigrants from Hungary

Tragic
Good
10.8%
UNEMPLOYMENT AMONG WOMEN WITH CHILDREN AGES 6 TO 17 YEARS
0.0/ 100
METRIC RATING
326th/ 347
METRIC RANK
8.9%
UNEMPLOYMENT AMONG WOMEN WITH CHILDREN AGES 6 TO 17 YEARS
63.4/ 100
METRIC RATING
160th/ 347
METRIC RANK

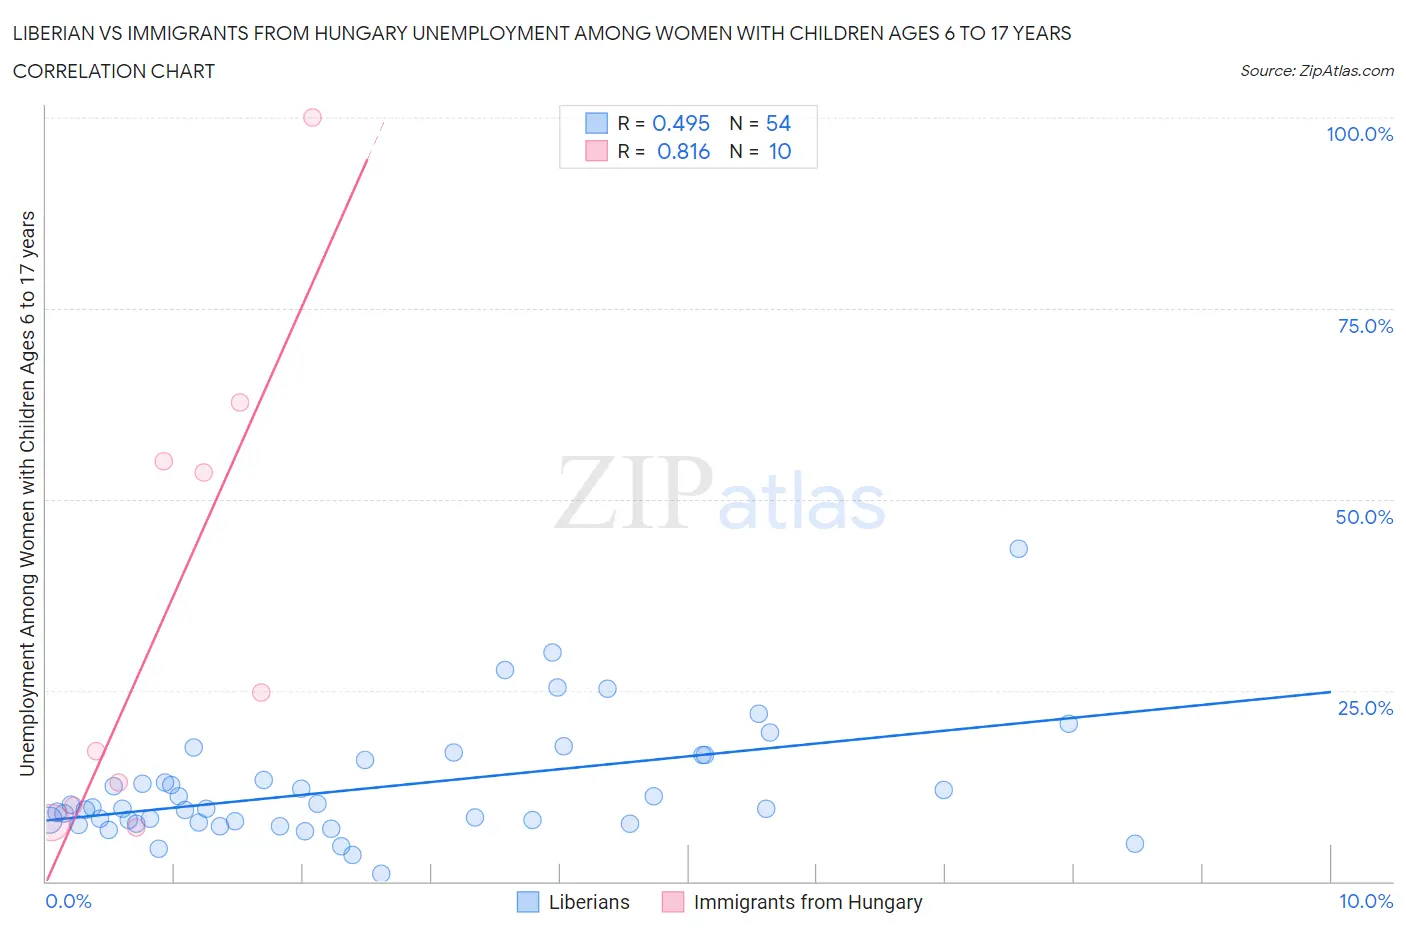
Liberian vs Immigrants from Hungary Unemployment Among Women with Children Ages 6 to 17 years Correlation Chart

The statistical analysis conducted on geographies consisting of 103,141,134 people shows a moderate positive correlation between the proportion of Liberians and unemployment rate among women with children between the ages 6 and 17 in the United States with a correlation coefficient (R) of 0.495 and weighted average of 10.8%. Similarly, the statistical analysis conducted on geographies consisting of 155,870,512 people shows a very strong positive correlation between the proportion of Immigrants from Hungary and unemployment rate among women with children between the ages 6 and 17 in the United States with a correlation coefficient (R) of 0.816 and weighted average of 8.9%, a difference of 21.8%.
Liberian vs Immigrants from Hungary Unemployment Among Women with Children Ages 6 to 17 years

Unemployment Among Women with Children Ages 6 to 17 years Correlation Summary

MeasurementLiberianImmigrants from Hungary
Minimum1.0%7.0%
Maximum43.6%100.0%
Range42.6%93.0%
Mean12.2%35.0%
Median9.5%20.8%
Interquartile 25% (IQ1)7.7%9.9%
Interquartile 75% (IQ3)15.8%55.0%
Interquartile Range (IQR)8.1%45.1%
Standard Deviation (Sample)7.6%31.3%
Standard Deviation (Population)7.5%29.7%

Similar Demographics by Unemployment Among Women with Children Ages 6 to 17 years

Demographics Similar to Liberians by Unemployment Among Women with Children Ages 6 to 17 years

In terms of unemployment among women with children ages 6 to 17 years, the demographic groups most similar to Liberians are Cajun (10.8%, a difference of 0.070%), Cape Verdean (10.9%, a difference of 0.070%), Ottawa (10.9%, a difference of 0.20%), Immigrants from Dominican Republic (10.8%, a difference of 0.25%), and Dominican (10.8%, a difference of 0.31%).
DemographicsRating | RankUnemployment Among Women with Children Ages 6 to 17 years
Immigrants | Uganda
0.0
/100
|
#319
Tragic
10.7%
Apache
0.0
/100
|
#320
Tragic
10.7%
Tohono O'odham
0.0
/100
|
#321
Tragic
10.7%
Cree
0.0
/100
|
#322
Tragic
10.8%
Dominicans
0.0
/100
|
#323
Tragic
10.8%
Immigrants | Dominican Republic
0.0
/100
|
#324
Tragic
10.8%
Cajuns
0.0
/100
|
#325
Tragic
10.8%
Liberians
0.0
/100
|
#326
Tragic
10.8%
Cape Verdeans
0.0
/100
|
#327
Tragic
10.9%
Ottawa
0.0
/100
|
#328
Tragic
10.9%
Pennsylvania Germans
0.0
/100
|
#329
Tragic
11.0%
Chippewa
0.0
/100
|
#330
Tragic
11.1%
Blacks/African Americans
0.0
/100
|
#331
Tragic
11.4%
Tsimshian
0.0
/100
|
#332
Tragic
11.4%
Natives/Alaskans
0.0
/100
|
#333
Tragic
11.5%

Demographics Similar to Immigrants from Hungary by Unemployment Among Women with Children Ages 6 to 17 years

In terms of unemployment among women with children ages 6 to 17 years, the demographic groups most similar to Immigrants from Hungary are Spanish (8.9%, a difference of 0.020%), Immigrants from Guyana (8.9%, a difference of 0.020%), Immigrants from Chile (8.9%, a difference of 0.090%), Immigrants from Belgium (8.9%, a difference of 0.11%), and Osage (8.9%, a difference of 0.12%).
DemographicsRating | RankUnemployment Among Women with Children Ages 6 to 17 years
Immigrants | Europe
73.4
/100
|
#153
Good
8.9%
Vietnamese
72.1
/100
|
#154
Good
8.9%
Immigrants | Greece
71.8
/100
|
#155
Good
8.9%
Osage
65.9
/100
|
#156
Good
8.9%
Immigrants | Belgium
65.6
/100
|
#157
Good
8.9%
Immigrants | Chile
65.3
/100
|
#158
Good
8.9%
Spanish
63.8
/100
|
#159
Good
8.9%
Immigrants | Hungary
63.4
/100
|
#160
Good
8.9%
Immigrants | Guyana
63.0
/100
|
#161
Good
8.9%
Immigrants | Netherlands
60.8
/100
|
#162
Good
8.9%
Mexican American Indians
60.6
/100
|
#163
Good
8.9%
Ukrainians
59.7
/100
|
#164
Average
8.9%
Immigrants | Micronesia
59.2
/100
|
#165
Average
8.9%
Moroccans
58.3
/100
|
#166
Average
8.9%
Immigrants | England
57.7
/100
|
#167
Average
8.9%