Cities with the Highest Percentage of Immigrants from Guatemala in Illinois
RELATED REPORTS & OPTIONS
Guatemala
Illinois
Compare Cities
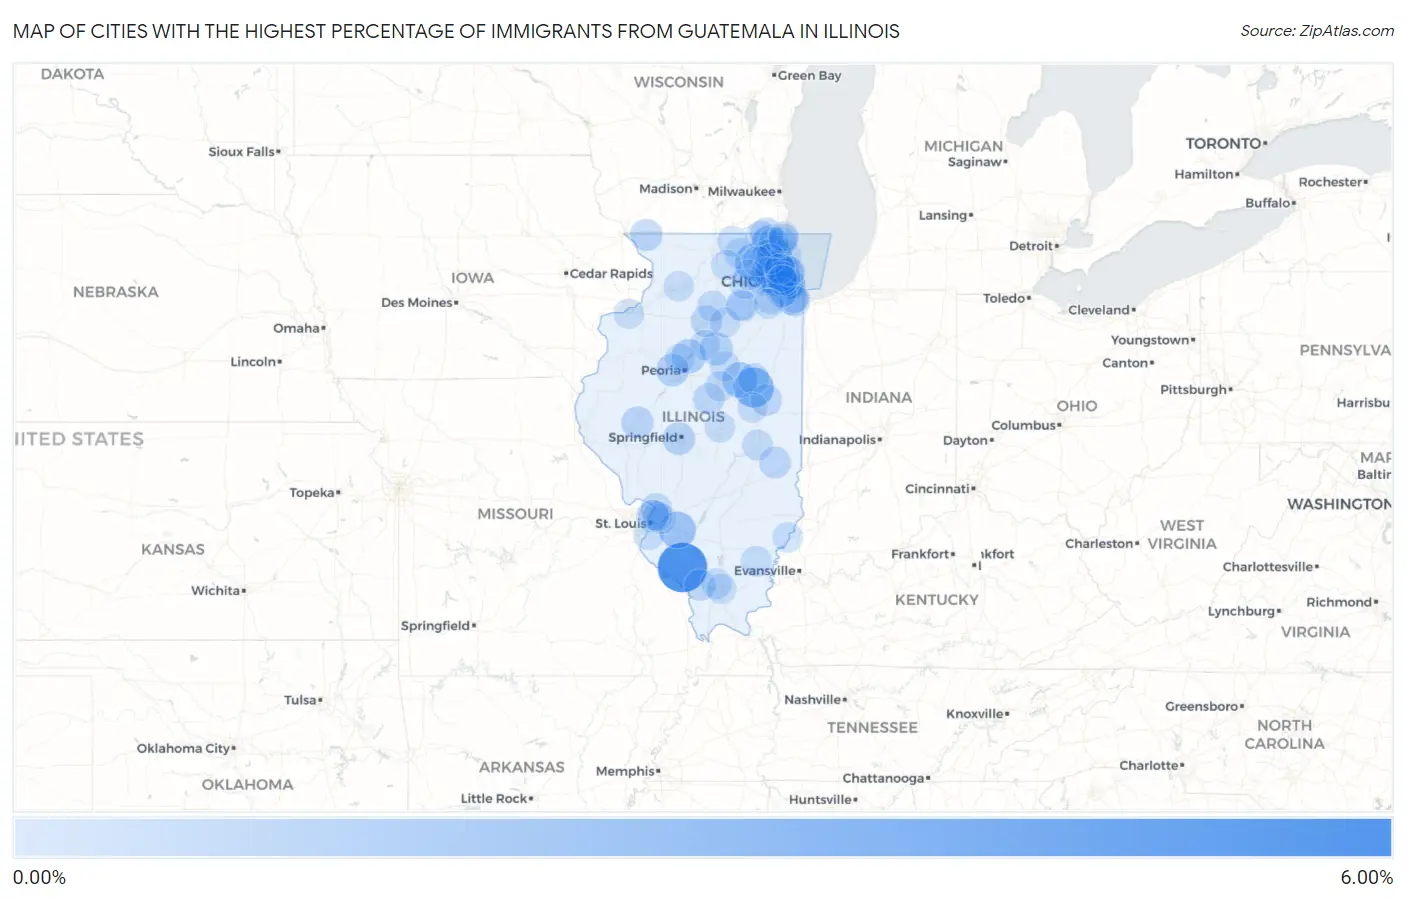
Map of Cities with the Highest Percentage of Immigrants from Guatemala in Illinois
0.00%
6.00%
Cities with the Highest Percentage of Immigrants from Guatemala in Illinois
| City | Guatemala | vs State | vs National | |
| 1. | Percy | 5.30% | 0.18%(+5.12)#-1 | 0.32%(+4.98)#0 |
| 2. | Bensenville | 3.62% | 0.18%(+3.44)#42 | 0.32%(+3.30)#1,738 |
| 3. | Gibson City | 2.74% | 0.18%(+2.56)#43 | 0.32%(+2.42)#1,739 |
| 4. | Gilberts | 2.03% | 0.18%(+1.85)#44 | 0.32%(+1.71)#1,740 |
| 5. | Melrose Park | 1.92% | 0.18%(+1.74)#45 | 0.32%(+1.60)#1,741 |
| 6. | New Baden | 1.89% | 0.18%(+1.71)#47 | 0.32%(+1.57)#1,846 |
| 7. | Holcomb | 1.80% | 0.18%(+1.62)#48 | 0.32%(+1.48)#1,847 |
| 8. | Colfax | 1.57% | 0.18%(+1.39)#49 | 0.32%(+1.26)#1,848 |
| 9. | Berkeley | 1.51% | 0.18%(+1.34)#50 | 0.32%(+1.20)#1,849 |
| 10. | Long Grove | 1.44% | 0.18%(+1.26)#51 | 0.32%(+1.12)#1,850 |
| 11. | Harwood Heights | 1.41% | 0.18%(+1.23)#52 | 0.32%(+1.09)#1,851 |
| 12. | Summit | 1.40% | 0.18%(+1.22)#53 | 0.32%(+1.08)#1,852 |
| 13. | Addison | 1.34% | 0.18%(+1.16)#54 | 0.32%(+1.02)#1,853 |
| 14. | Rome | 1.25% | 0.18%(+1.07)#55 | 0.32%(+0.928)#1,854 |
| 15. | Northlake | 1.15% | 0.18%(+0.972)#56 | 0.32%(+0.833)#1,855 |
| 16. | Rutland | 0.98% | 0.18%(+0.797)#57 | 0.32%(+0.658)#1,856 |
| 17. | Rosemont | 0.96% | 0.18%(+0.779)#58 | 0.32%(+0.640)#1,857 |
| 18. | Cicero | 0.94% | 0.18%(+0.759)#61 | 0.32%(+0.619)#2,191 |
| 19. | Villa Park | 0.89% | 0.18%(+0.709)#62 | 0.32%(+0.570)#2,192 |
| 20. | Schiller Park | 0.86% | 0.18%(+0.683)#63 | 0.32%(+0.544)#2,193 |
| 21. | Hanna City | 0.85% | 0.18%(+0.668)#64 | 0.32%(+0.529)#2,194 |
| 22. | Leland Grove | 0.81% | 0.18%(+0.633)#65 | 0.32%(+0.494)#2,195 |
| 23. | Madison | 0.75% | 0.18%(+0.568)#66 | 0.32%(+0.429)#2,196 |
| 24. | Round Lake Heights | 0.74% | 0.18%(+0.566)#67 | 0.32%(+0.427)#2,197 |
| 25. | Robbins | 0.73% | 0.18%(+0.550)#68 | 0.32%(+0.411)#2,198 |
| 26. | River Grove | 0.72% | 0.18%(+0.543)#69 | 0.32%(+0.404)#2,199 |
| 27. | Beardstown | 0.71% | 0.18%(+0.535)#70 | 0.32%(+0.396)#2,200 |
| 28. | Scales Mound | 0.69% | 0.18%(+0.513)#71 | 0.32%(+0.374)#2,201 |
| 29. | Channel Lake | 0.62% | 0.18%(+0.438)#72 | 0.32%(+0.299)#2,202 |
| 30. | Westfield | 0.60% | 0.18%(+0.418)#73 | 0.32%(+0.279)#2,203 |
| 31. | Mundelein | 0.59% | 0.18%(+0.413)#74 | 0.32%(+0.274)#2,317 |
| 32. | Stone Park | 0.59% | 0.18%(+0.413)#75 | 0.32%(+0.274)#2,318 |
| 33. | Long Lake | 0.58% | 0.18%(+0.400)#76 | 0.32%(+0.261)#2,319 |
| 34. | Broadview | 0.57% | 0.18%(+0.387)#77 | 0.32%(+0.248)#2,320 |
| 35. | Rantoul | 0.56% | 0.18%(+0.379)#78 | 0.32%(+0.240)#2,321 |
| 36. | Itasca | 0.55% | 0.18%(+0.372)#79 | 0.32%(+0.233)#2,322 |
| 37. | Murphysboro | 0.52% | 0.18%(+0.342)#80 | 0.32%(+0.203)#2,323 |
| 38. | Mclean | 0.51% | 0.18%(+0.336)#81 | 0.32%(+0.197)#2,324 |
| 39. | Spring Valley | 0.49% | 0.18%(+0.311)#82 | 0.32%(+0.172)#2,325 |
| 40. | Glendale Heights | 0.49% | 0.18%(+0.308)#83 | 0.32%(+0.169)#2,326 |
| 41. | Berwyn | 0.49% | 0.18%(+0.308)#84 | 0.32%(+0.169)#2,327 |
| 42. | Spring Grove | 0.46% | 0.18%(+0.278)#85 | 0.32%(+0.139)#2,328 |
| 43. | Sibley | 0.45% | 0.18%(+0.272)#86 | 0.32%(+0.133)#2,329 |
| 44. | Barrington Hills | 0.44% | 0.18%(+0.258)#87 | 0.32%(+0.119)#2,330 |
| 45. | Newark | 0.43% | 0.18%(+0.254)#88 | 0.32%(+0.115)#2,331 |
| 46. | Norridge | 0.43% | 0.18%(+0.253)#89 | 0.32%(+0.114)#2,332 |
| 47. | Hartford | 0.43% | 0.18%(+0.252)#90 | 0.32%(+0.113)#2,333 |
| 48. | Carol Stream | 0.41% | 0.18%(+0.235)#91 | 0.32%(+0.096)#2,334 |
| 49. | Prospect Heights | 0.41% | 0.18%(+0.231)#92 | 0.32%(+0.092)#2,335 |
| 50. | Wood Dale | 0.40% | 0.18%(+0.224)#93 | 0.32%(+0.085)#2,336 |
| 51. | Mendota | 0.40% | 0.18%(+0.224)#94 | 0.32%(+0.085)#2,337 |
| 52. | West Chicago | 0.40% | 0.18%(+0.223)#95 | 0.32%(+0.084)#2,338 |
| 53. | Chicago | 0.39% | 0.18%(+0.213)#96 | 0.32%(+0.074)#2,339 |
| 54. | Hillside | 0.39% | 0.18%(+0.211)#97 | 0.32%(+0.072)#2,340 |
| 55. | Hanover Park | 0.39% | 0.18%(+0.211)#98 | 0.32%(+0.072)#2,341 |
| 56. | Elmwood Park | 0.37% | 0.18%(+0.188)#99 | 0.32%(+0.049)#2,342 |
| 57. | Blue Island | 0.37% | 0.18%(+0.188)#100 | 0.32%(+0.049)#2,343 |
| 58. | Millington | 0.36% | 0.18%(+0.182)#101 | 0.32%(+0.043)#2,344 |
| 59. | Harvey | 0.36% | 0.18%(+0.181)#102 | 0.32%(+0.042)#2,345 |
| 60. | Herrin | 0.36% | 0.18%(+0.178)#103 | 0.32%(+0.039)#2,346 |
| 61. | Kaneville | 0.35% | 0.18%(+0.172)#104 | 0.32%(+0.033)#2,347 |
| 62. | Enfield | 0.34% | 0.18%(+0.165)#105 | 0.32%(+0.026)#2,348 |
| 63. | Mount Prospect | 0.34% | 0.18%(+0.158)#106 | 0.32%(+0.019)#2,349 |
| 64. | Arcola | 0.33% | 0.18%(+0.151)#107 | 0.32%(+0.012)#2,350 |
| 65. | Romeoville | 0.32% | 0.18%(+0.143)#108 | 0.32%(+0.004)#2,885 |
| 66. | Marengo | 0.32% | 0.18%(+0.143)#109 | 0.32%(+0.004)#2,886 |
| 67. | Forest Park | 0.32% | 0.18%(+0.139)#110 | 0.32%(-0.000)#2,887 |
| 68. | Columbia | 0.31% | 0.18%(+0.129)#111 | 0.32%(-0.010)#2,888 |
| 69. | Highwood | 0.31% | 0.18%(+0.127)#112 | 0.32%(-0.012)#2,889 |
| 70. | Waukegan | 0.30% | 0.18%(+0.122)#113 | 0.32%(-0.017)#2,890 |
| 71. | Capron | 0.29% | 0.18%(+0.115)#114 | 0.32%(-0.024)#2,891 |
| 72. | North Barrington | 0.29% | 0.18%(+0.110)#115 | 0.32%(-0.029)#2,892 |
| 73. | Kirkland | 0.27% | 0.18%(+0.089)#116 | 0.32%(-0.050)#2,893 |
| 74. | Roselle | 0.26% | 0.18%(+0.084)#117 | 0.32%(-0.055)#2,894 |
| 75. | Forsyth | 0.26% | 0.18%(+0.081)#118 | 0.32%(-0.058)#2,895 |
| 76. | Willow Springs | 0.26% | 0.18%(+0.077)#119 | 0.32%(-0.062)#2,896 |
| 77. | Collinsville | 0.26% | 0.18%(+0.077)#120 | 0.32%(-0.063)#2,897 |
| 78. | Franklin Park | 0.25% | 0.18%(+0.072)#121 | 0.32%(-0.067)#2,898 |
| 79. | Granite City | 0.25% | 0.18%(+0.069)#122 | 0.32%(-0.070)#2,899 |
| 80. | Third Lake | 0.25% | 0.18%(+0.068)#123 | 0.32%(-0.071)#2,900 |
| 81. | Gridley | 0.25% | 0.18%(+0.068)#124 | 0.32%(-0.071)#2,901 |
| 82. | Mount Carmel | 0.24% | 0.18%(+0.065)#125 | 0.32%(-0.074)#2,902 |
| 83. | Mahomet | 0.24% | 0.18%(+0.062)#126 | 0.32%(-0.077)#2,903 |
| 84. | Sterling | 0.24% | 0.18%(+0.057)#127 | 0.32%(-0.082)#2,904 |
| 85. | Varna | 0.23% | 0.18%(+0.050)#128 | 0.32%(-0.089)#2,905 |
| 86. | Lincolnwood | 0.23% | 0.18%(+0.047)#129 | 0.32%(-0.092)#2,906 |
| 87. | Bloomington | 0.22% | 0.18%(+0.046)#130 | 0.32%(-0.093)#2,907 |
| 88. | Zion | 0.22% | 0.18%(+0.041)#131 | 0.32%(-0.098)#2,908 |
| 89. | Marion | 0.22% | 0.18%(+0.041)#132 | 0.32%(-0.098)#2,909 |
| 90. | Milan | 0.22% | 0.18%(+0.038)#133 | 0.32%(-0.101)#2,910 |
| 91. | Deer Park | 0.22% | 0.18%(+0.038)#134 | 0.32%(-0.101)#2,911 |
| 92. | Lily Lake | 0.22% | 0.18%(+0.037)#135 | 0.32%(-0.102)#2,912 |
| 93. | Carpentersville | 0.21% | 0.18%(+0.035)#136 | 0.32%(-0.104)#2,913 |
| 94. | Dunlap | 0.21% | 0.18%(+0.033)#137 | 0.32%(-0.106)#2,914 |
| 95. | Naplate | 0.21% | 0.18%(+0.031)#138 | 0.32%(-0.108)#2,915 |
| 96. | Beach Park | 0.21% | 0.18%(+0.029)#139 | 0.32%(-0.111)#2,916 |
| 97. | Pontoon Beach | 0.20% | 0.18%(+0.020)#140 | 0.32%(-0.119)#2,917 |
| 98. | Des Plaines | 0.20% | 0.18%(+0.019)#141 | 0.32%(-0.120)#2,918 |
| 99. | Bellwood | 0.19% | 0.18%(+0.015)#142 | 0.32%(-0.124)#2,919 |
| 100. | Crest Hill | 0.19% | 0.18%(+0.012)#143 | 0.32%(-0.127)#2,920 |
Common Questions
What are the Top 10 Cities with the Highest Percentage of Immigrants from Guatemala in Illinois?
Top 10 Cities with the Highest Percentage of Immigrants from Guatemala in Illinois are:
#1
5.30%
#2
3.62%
#3
2.74%
#4
2.03%
#5
1.92%
#6
1.89%
#7
1.57%
#8
1.51%
#9
1.44%
#10
1.41%
What city has the Highest Percentage of Immigrants from Guatemala in Illinois?
Percy has the Highest Percentage of Immigrants from Guatemala in Illinois with 5.30%.
What is the Percentage of Immigrants from Guatemala in the State of Illinois?
Percentage of Immigrants from Guatemala in Illinois is 0.18%.
What is the Percentage of Immigrants from Guatemala in the United States?
Percentage of Immigrants from Guatemala in the United States is 0.32%.