Cities with the Highest Percentage of Immigrants from Guatemala in South Carolina
RELATED REPORTS & OPTIONS
Guatemala
South Carolina
Compare Cities
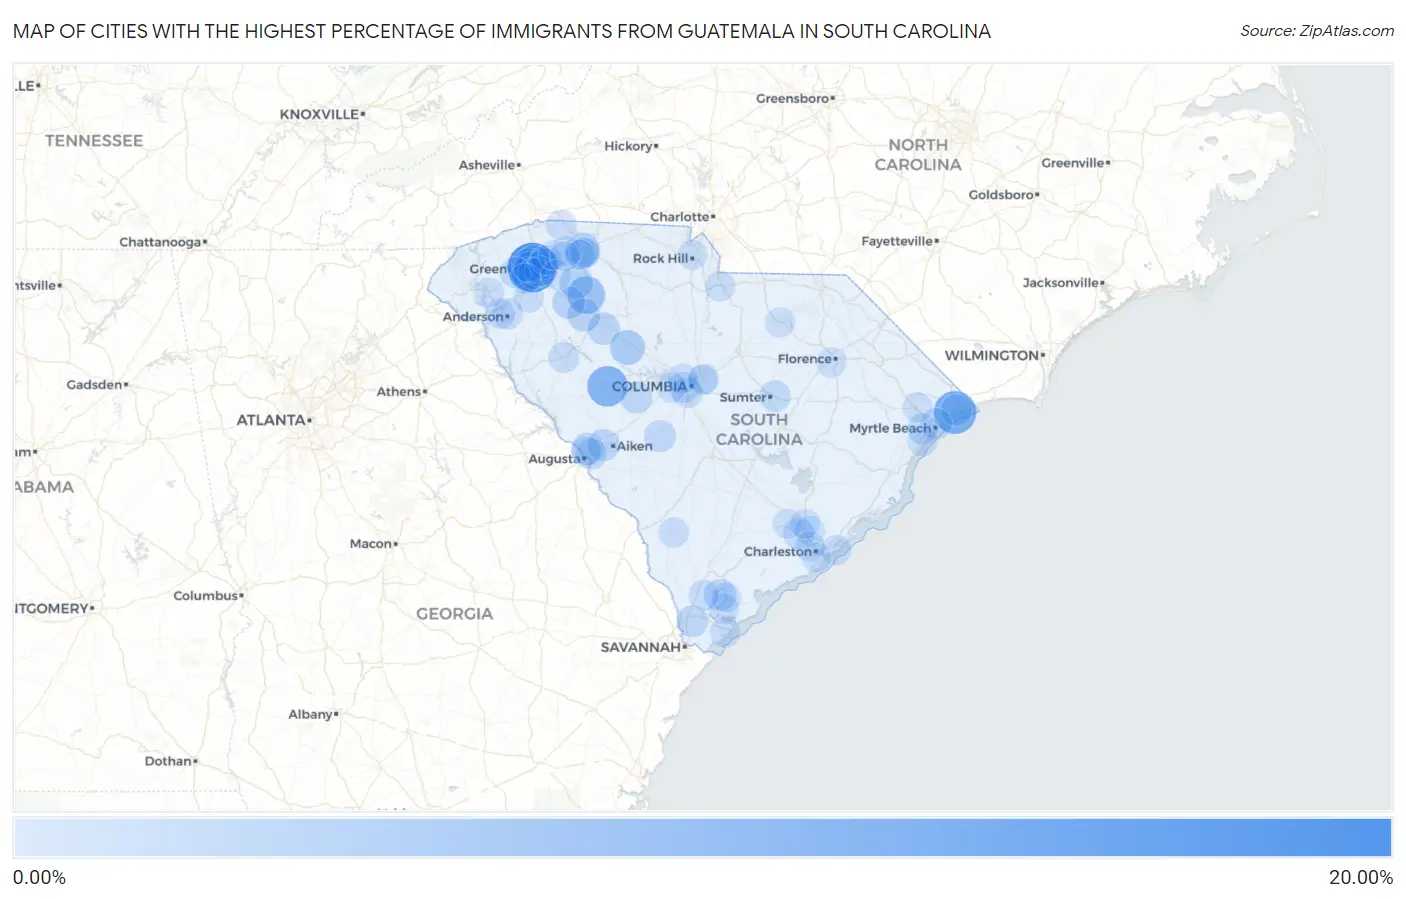
Map of Cities with the Highest Percentage of Immigrants from Guatemala in South Carolina
0.00%
20.00%
Cities with the Highest Percentage of Immigrants from Guatemala in South Carolina
| City | Guatemala | vs State | vs National | |
| 1. | City View | 16.45% | 0.18%(+16.3)#-1 | 0.32%(+16.1)#0 |
| 2. | Atlantic Beach | 10.54% | 0.18%(+10.4)#10 | 0.32%(+10.2)#304 |
| 3. | Sandy Springs | 10.54% | 0.18%(+10.4)#11 | 0.32%(+10.2)#305 |
| 4. | Saluda | 8.67% | 0.18%(+8.50)#12 | 0.32%(+8.36)#306 |
| 5. | Enoree | 6.12% | 0.18%(+5.95)#13 | 0.32%(+5.80)#307 |
| 6. | Camp Croft | 4.37% | 0.18%(+4.19)#14 | 0.32%(+4.05)#308 |
| 7. | Newberry | 3.89% | 0.18%(+3.71)#15 | 0.32%(+3.57)#309 |
| 8. | Southern Shops | 3.45% | 0.18%(+3.27)#16 | 0.32%(+3.13)#310 |
| 9. | Sans Souci | 3.43% | 0.18%(+3.26)#17 | 0.32%(+3.11)#311 |
| 10. | Woodruff | 2.84% | 0.18%(+2.66)#18 | 0.32%(+2.52)#312 |
| 11. | Welcome | 2.74% | 0.18%(+2.56)#19 | 0.32%(+2.42)#313 |
| 12. | Berea | 2.54% | 0.18%(+2.36)#20 | 0.32%(+2.22)#314 |
| 13. | Watts Mills | 2.29% | 0.18%(+2.11)#21 | 0.32%(+1.97)#315 |
| 14. | Gray Court | 2.06% | 0.18%(+1.88)#22 | 0.32%(+1.74)#316 |
| 15. | Joanna | 1.92% | 0.18%(+1.74)#23 | 0.32%(+1.60)#317 |
| 16. | Laurel Bay | 1.80% | 0.18%(+1.62)#24 | 0.32%(+1.48)#318 |
| 17. | Belvedere | 1.61% | 0.18%(+1.43)#25 | 0.32%(+1.29)#319 |
| 18. | Graniteville | 1.54% | 0.18%(+1.37)#26 | 0.32%(+1.22)#320 |
| 19. | Batesburg Leesville | 1.48% | 0.18%(+1.30)#27 | 0.32%(+1.16)#321 |
| 20. | Perry | 1.39% | 0.18%(+1.21)#28 | 0.32%(+1.07)#322 |
| 21. | Hardeeville | 1.38% | 0.18%(+1.20)#29 | 0.32%(+1.06)#323 |
| 22. | Parker | 1.32% | 0.18%(+1.15)#30 | 0.32%(+1.01)#324 |
| 23. | East Sumter | 1.14% | 0.18%(+0.965)#31 | 0.32%(+0.823)#325 |
| 24. | North Myrtle Beach | 1.04% | 0.18%(+0.864)#32 | 0.32%(+0.722)#326 |
| 25. | North Charleston | 1.02% | 0.18%(+0.845)#38 | 0.32%(+0.703)#1,688 |
| 26. | Myrtle Beach | 0.94% | 0.18%(+0.767)#39 | 0.32%(+0.625)#1,689 |
| 27. | Arcadia | 0.88% | 0.18%(+0.702)#40 | 0.32%(+0.561)#1,690 |
| 28. | Socastee | 0.86% | 0.18%(+0.682)#41 | 0.32%(+0.541)#1,691 |
| 29. | Clearwater | 0.82% | 0.18%(+0.647)#42 | 0.32%(+0.505)#1,692 |
| 30. | West Columbia | 0.78% | 0.18%(+0.603)#43 | 0.32%(+0.461)#1,693 |
| 31. | Dunean | 0.76% | 0.18%(+0.583)#44 | 0.32%(+0.441)#1,694 |
| 32. | Anderson | 0.65% | 0.18%(+0.478)#56 | 0.32%(+0.337)#2,773 |
| 33. | Arkwright | 0.62% | 0.18%(+0.442)#57 | 0.32%(+0.300)#2,774 |
| 34. | Easley | 0.61% | 0.18%(+0.438)#58 | 0.32%(+0.296)#2,775 |
| 35. | Cayce | 0.51% | 0.18%(+0.333)#59 | 0.32%(+0.191)#2,776 |
| 36. | Greenwood | 0.45% | 0.18%(+0.272)#60 | 0.32%(+0.131)#2,777 |
| 37. | Pelzer | 0.41% | 0.18%(+0.229)#61 | 0.32%(+0.088)#2,778 |
| 38. | Landrum | 0.36% | 0.18%(+0.183)#62 | 0.32%(+0.042)#2,779 |
| 39. | Port Royal | 0.35% | 0.18%(+0.174)#63 | 0.32%(+0.032)#2,780 |
| 40. | Saxon | 0.34% | 0.18%(+0.160)#64 | 0.32%(+0.018)#2,781 |
| 41. | Wade Hampton | 0.30% | 0.18%(+0.128)#65 | 0.32%(-0.013)#2,782 |
| 42. | Lyman | 0.30% | 0.18%(+0.119)#66 | 0.32%(-0.023)#2,783 |
| 43. | Greenville | 0.28% | 0.18%(+0.101)#67 | 0.32%(-0.041)#2,784 |
| 44. | Garden City | 0.28% | 0.18%(+0.099)#68 | 0.32%(-0.042)#2,785 |
| 45. | Powdersville | 0.23% | 0.18%(+0.058)#69 | 0.32%(-0.084)#2,786 |
| 46. | Lancaster | 0.23% | 0.18%(+0.057)#70 | 0.32%(-0.085)#2,787 |
| 47. | Centerville | 0.21% | 0.18%(+0.032)#71 | 0.32%(-0.110)#2,788 |
| 48. | Hilton Head Island | 0.20% | 0.18%(+0.025)#72 | 0.32%(-0.116)#2,789 |
| 49. | Brunson | 0.19% | 0.18%(+0.014)#73 | 0.32%(-0.127)#2,790 |
| 50. | Ridgeland | 0.19% | 0.18%(+0.011)#74 | 0.32%(-0.130)#2,791 |
| 51. | Clemson | 0.18% | 0.18%(+0.006)#75 | 0.32%(-0.135)#2,792 |
| 52. | Isle Of Palms | 0.16% | 0.18%(-0.015)#76 | 0.32%(-0.157)#2,793 |
| 53. | St Andrews | 0.15% | 0.18%(-0.030)#77 | 0.32%(-0.172)#2,794 |
| 54. | Woodfield | 0.14% | 0.18%(-0.039)#78 | 0.32%(-0.180)#2,795 |
| 55. | Taylors | 0.12% | 0.18%(-0.054)#79 | 0.32%(-0.196)#2,796 |
| 56. | Hanahan | 0.11% | 0.18%(-0.070)#80 | 0.32%(-0.212)#2,797 |
| 57. | Mcbee | 0.096% | 0.18%(-0.081)#81 | 0.32%(-0.222)#2,798 |
| 58. | Columbia | 0.072% | 0.18%(-0.104)#82 | 0.32%(-0.245)#2,799 |
| 59. | Florence | 0.065% | 0.18%(-0.111)#83 | 0.32%(-0.253)#2,800 |
| 60. | Fairforest | 0.061% | 0.18%(-0.115)#84 | 0.32%(-0.256)#2,801 |
| 61. | Charleston | 0.061% | 0.18%(-0.115)#85 | 0.32%(-0.256)#2,802 |
| 62. | Five Forks | 0.059% | 0.18%(-0.117)#86 | 0.32%(-0.259)#2,803 |
| 63. | Greer | 0.046% | 0.18%(-0.130)#87 | 0.32%(-0.272)#2,804 |
| 64. | Summerville | 0.041% | 0.18%(-0.135)#88 | 0.32%(-0.276)#2,805 |
| 65. | James Island | 0.034% | 0.18%(-0.142)#89 | 0.32%(-0.284)#2,806 |
| 66. | Lexington | 0.034% | 0.18%(-0.142)#90 | 0.32%(-0.284)#2,807 |
| 67. | Goose Creek | 0.033% | 0.18%(-0.143)#91 | 0.32%(-0.285)#2,808 |
| 68. | Duncan | 0.025% | 0.18%(-0.151)#92 | 0.32%(-0.293)#2,809 |
| 69. | Conway | 0.024% | 0.18%(-0.152)#93 | 0.32%(-0.294)#2,810 |
| 70. | Beaufort | 0.022% | 0.18%(-0.154)#94 | 0.32%(-0.296)#2,811 |
| 71. | Rock Hill | 0.022% | 0.18%(-0.155)#95 | 0.32%(-0.296)#2,812 |
| 72. | North Augusta | 0.0041% | 0.18%(-0.172)#96 | 0.32%(-0.314)#2,813 |
Common Questions
What are the Top 10 Cities with the Highest Percentage of Immigrants from Guatemala in South Carolina?
Top 10 Cities with the Highest Percentage of Immigrants from Guatemala in South Carolina are:
#1
16.45%
#2
10.54%
#3
8.67%
#4
6.12%
#5
3.89%
#6
3.45%
#7
3.43%
#8
2.84%
#9
2.74%
#10
2.54%
What city has the Highest Percentage of Immigrants from Guatemala in South Carolina?
City View has the Highest Percentage of Immigrants from Guatemala in South Carolina with 16.45%.
What is the Percentage of Immigrants from Guatemala in the State of South Carolina?
Percentage of Immigrants from Guatemala in South Carolina is 0.18%.
What is the Percentage of Immigrants from Guatemala in the United States?
Percentage of Immigrants from Guatemala in the United States is 0.32%.