Cities with the Highest Percentage of Immigrants from Guatemala in Oregon

RELATED REPORTS & OPTIONS

Guatemala
Population
Families and Households
Female Fertility
Female Fertility (Unmarried)
Race (Community Size)
Race (Percentage)
Ancestry (Community Size)
AfghanAfricanAlaska NativeAlaskan AthabascanAlbanianAleutAlsatianAmericanApacheArabArapahoArgentineanArmenianAssyrian / Chaldean / SyriacAustralianAustrianBahamianBangladeshiBarbadianBasqueBelgianBelizeanBermudanBhutaneseBlackfeetBolivianBrazilianBritishBritish West IndianBulgarianBurmeseCajunCambodianCanadianCape VerdeanCarpatho RusynCelticCentral AmericanCentral American IndianCherokeeCheyenneChickasawChileanChineseChippewaChoctawColombianColvilleComancheCosta RicanCreeCreekCroatianCrowCubanCypriotCzechCzechoslovakianDanishDelawareDominicanDutchDutch West IndianEastern EuropeanEcuadorianEgyptianEnglishEstonianEthiopianEuropeanFijianFilipinoFinnishFrenchFrench American IndianFrench CanadianGermanGerman RussianGhanaianGreekGuamanian / ChamorroGuatemalanGuyaneseHaitianHmongHonduranHopiHoumaHungarianIcelanderIndian (Asian)IndonesianInupiatIranianIraqiIrishIroquoisIsraeliItalianJamaicanJapaneseJordanianKenyanKiowaKoreanLaotianLatvianLebaneseLiberianLithuanianLumbeeLuxembourgerMacedonianMalaysianMalteseMarshalleseMenomineeMexicanMexican American IndianMongolianMoroccanNative HawaiianNavajoNepaleseNew ZealanderNicaraguanNigerianNorthern EuropeanNorwegianOkinawanOsageOttawaPaiutePakistaniPalestinianPanamanianParaguayanPennsylvania GermanPeruvianPimaPolishPortuguesePotawatomiPuebloPuerto RicanPuget Sound SalishRomanianRussianSalvadoranSamoanScandinavianScotch-IrishScottishSeminoleSenegaleseSerbianShoshoneSierra LeoneanSiouxSlavicSlovakSloveneSomaliSouth AfricanSouth AmericanSouth American IndianSoviet UnionSpaniardSpanishSpanish AmericanSpanish American IndianSri LankanSubsaharan AfricanSudaneseSwedishSwissSyrianTaiwaneseThaiTlingit-HaidaTohono O'OdhamTonganTrinidadian and TobagonianTsimshianTurkishU.S. Virgin IslanderUgandanUkrainianUruguayanUteVenezuelanVietnameseWelshWest IndianYakamaYaquiYugoslavianYumanYup'ikZimbabwean
Ancestry (Percentage)
AfghanAfricanAlaska NativeAlaskan AthabascanAlbanianAleutAlsatianAmericanApacheArabArapahoArgentineanArmenianAssyrian / Chaldean / SyriacAustralianAustrianBahamianBangladeshiBarbadianBasqueBelgianBelizeanBermudanBhutaneseBlackfeetBolivianBrazilianBritishBritish West IndianBulgarianBurmeseCajunCambodianCanadianCape VerdeanCarpatho RusynCelticCentral AmericanCentral American IndianCherokeeCheyenneChickasawChileanChineseChippewaChoctawColombianColvilleComancheCosta RicanCreeCreekCroatianCrowCubanCypriotCzechCzechoslovakianDanishDelawareDominicanDutchDutch West IndianEastern EuropeanEcuadorianEgyptianEnglishEstonianEthiopianEuropeanFijianFilipinoFinnishFrenchFrench American IndianFrench CanadianGermanGerman RussianGhanaianGreekGuamanian / ChamorroGuatemalanGuyaneseHaitianHmongHonduranHopiHoumaHungarianIcelanderIndian (Asian)IndonesianInupiatIranianIraqiIrishIroquoisIsraeliItalianJamaicanJapaneseJordanianKenyanKiowaKoreanLaotianLatvianLebaneseLiberianLithuanianLumbeeLuxembourgerMacedonianMalaysianMalteseMarshalleseMenomineeMexicanMexican American IndianMongolianMoroccanNative HawaiianNavajoNepaleseNew ZealanderNicaraguanNigerianNorthern EuropeanNorwegianOkinawanOsageOttawaPaiutePakistaniPalestinianPanamanianParaguayanPennsylvania GermanPeruvianPimaPolishPortuguesePotawatomiPuebloPuerto RicanPuget Sound SalishRomanianRussianSalvadoranSamoanScandinavianScotch-IrishScottishSeminoleSenegaleseSerbianShoshoneSierra LeoneanSiouxSlavicSlovakSloveneSomaliSouth AfricanSouth AmericanSouth American IndianSoviet UnionSpaniardSpanishSpanish AmericanSpanish American IndianSri LankanSubsaharan AfricanSudaneseSwedishSwissSyrianTaiwaneseThaiTlingit-HaidaTohono O'OdhamTonganTrinidadian and TobagonianTsimshianTurkishU.S. Virgin IslanderUgandanUkrainianUruguayanUteVenezuelanVietnameseWelshWest IndianYakamaYaquiYugoslavianYumanYup'ikZimbabwean
Immigrant Origin (Total)
AfghanistanAfricaAlbaniaArgentinaArmeniaAsiaAustraliaAustriaAzoresBahamasBangladeshBarbadosBelarusBelgiumBelizeBoliviaBosnia and HerzegovinaBrazilBulgariaBurma / MyanmarCabo VerdeCambodiaCameroonCanadaCaribbeanCentral AmericaChileChinaColombiaCongoCosta RicaCroatiaCubaCzechoslovakiaDenmarkDominicaDominican RepublicEastern AfricaEastern AsiaEastern EuropeEcuadorEgyptEl SalvadorEnglandEritreaEthiopiaEuropeFijiFranceGermanyGhanaGreeceGrenadaGuatemalaGuyanaHaitiHondurasHong KongHungaryIndiaIndonesiaIranIraqIrelandIsraelItalyJamaicaJapanJordanKazakhstanKenyaKoreaKuwaitLaosLatin AmericaLatviaLebanonLiberiaLithuaniaMalaysiaMexicoMicronesiaMiddle AfricaMoldovaMoroccoNepalNetherlandsNicaraguaNigeriaNorth MacedoniaNorthern AfricaNorthern EuropeNorwayOceaniaPakistanPanamaPeruPhilippinesPolandPortugalRomaniaRussiaSaudi ArabiaScotlandSenegalSerbiaSierra LeoneSingaporeSomaliaSouth AfricaSouth AmericaSouth Central AsiaSouth Eastern AsiaSouthern EuropeSpainSri LankaSt. Vincent and the GrenadinesSudanSwedenSwitzerlandSyriaTaiwanThailandTrinidad and TobagoTurkeyUgandaUkraineUruguayUzbekistanVenezuelaVietnamWest IndiesWestern AfricaWestern AsiaWestern EuropeYemenZaireZimbabwe
Immigrant Origin (Percentage)
AfghanistanAfricaAlbaniaArgentinaArmeniaAsiaAustraliaAustriaAzoresBahamasBangladeshBarbadosBelarusBelgiumBelizeBoliviaBosnia and HerzegovinaBrazilBulgariaBurma / MyanmarCabo VerdeCambodiaCameroonCanadaCaribbeanCentral AmericaChileChinaColombiaCongoCosta RicaCroatiaCubaCzechoslovakiaDenmarkDominicaDominican RepublicEastern AfricaEastern AsiaEastern EuropeEcuadorEgyptEl SalvadorEnglandEritreaEthiopiaEuropeFijiFranceGermanyGhanaGreeceGrenadaGuatemalaGuyanaHaitiHondurasHong KongHungaryIndiaIndonesiaIranIraqIrelandIsraelItalyJamaicaJapanJordanKazakhstanKenyaKoreaKuwaitLaosLatin AmericaLatviaLebanonLiberiaLithuaniaMalaysiaMexicoMicronesiaMiddle AfricaMoldovaMoroccoNepalNetherlandsNicaraguaNigeriaNorth MacedoniaNorthern AfricaNorthern EuropeNorwayOceaniaPakistanPanamaPeruPhilippinesPolandPortugalRomaniaRussiaSaudi ArabiaScotlandSenegalSerbiaSierra LeoneSingaporeSomaliaSouth AfricaSouth AmericaSouth Central AsiaSouth Eastern AsiaSouthern EuropeSpainSri LankaSt. Vincent and the GrenadinesSudanSwedenSwitzerlandSyriaTaiwanThailandTrinidad and TobagoTurkeyUgandaUkraineUruguayUzbekistanVenezuelaVietnamWest IndiesWestern AfricaWestern AsiaWestern EuropeYemenZaireZimbabwe
Income
Income (Families)
Income (Households)
Poverty
Poverty (Families)
Unemployment
Employment Occupations
Employment Industries
Employer Class
Commute Time
Commute Means
School Enrollment
Education by Degree Field
Occupancy
Finances
Physical Characteristics
Oregon
Compare Cities
Comparison Subject

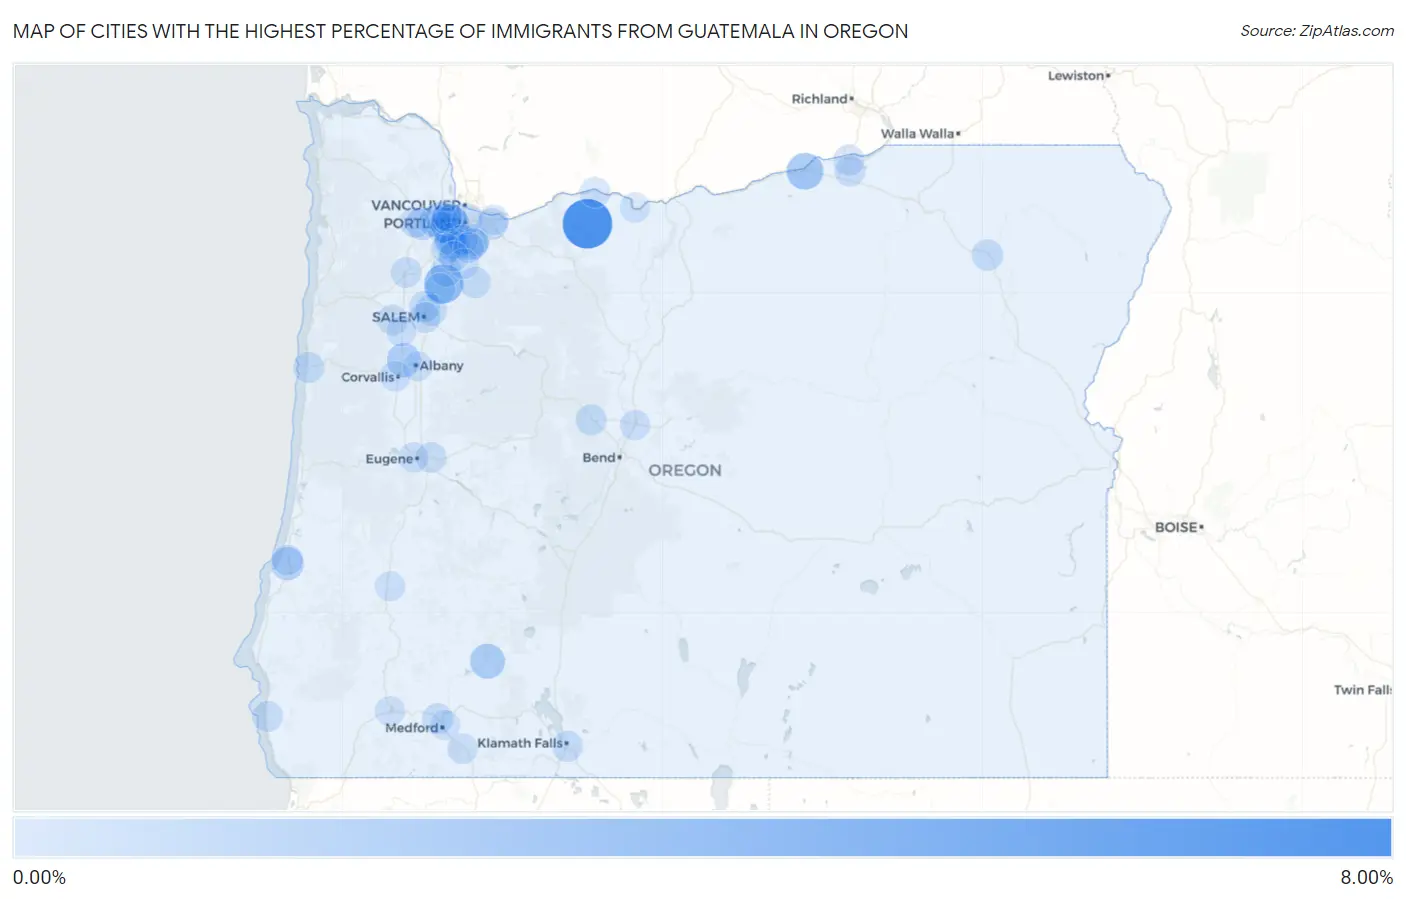
Map of Cities with the Highest Percentage of Immigrants from Guatemala in Oregon

0.00%
8.00%
Cities with the Highest Percentage of Immigrants from Guatemala in Oregon Map

Cities with the Highest Percentage of Immigrants from Guatemala in Oregon

City Guatemala vs State vs National
1.Parkdale7.04%0.17%(+6.87)#-10.32%(+6.72)#0
2.Woodburn3.17%0.17%(+3.00)#00.32%(+2.86)#1
3.Cedar Hills2.93%0.17%(+2.76)#10.32%(+2.61)#2
4.Boardman2.27%0.17%(+2.10)#20.32%(+1.95)#3
5.Prospect1.66%0.17%(+1.50)#30.32%(+1.35)#4
6.Adair Village1.35%0.17%(+1.18)#40.32%(+1.03)#5
7.Marlene1.23%0.17%(+1.06)#50.32%(+0.912)#6
8.Coos Bay1.00%0.17%(+0.835)#60.32%(+0.685)#7
9.Cornelius0.93%0.17%(+0.761)#70.32%(+0.611)#8
10.Jennings Lodge0.80%0.17%(+0.628)#80.32%(+0.478)#9
11.Hillsboro0.64%0.17%(+0.476)#90.32%(+0.327)#1,128
12.Beaverton0.62%0.17%(+0.454)#100.32%(+0.304)#1,129
13.Rockcreek0.61%0.17%(+0.447)#110.32%(+0.297)#1,130
14.King City0.59%0.17%(+0.425)#120.32%(+0.275)#1,131
15.Tualatin0.53%0.17%(+0.361)#130.32%(+0.211)#2,474
16.Aloha0.52%0.17%(+0.348)#140.32%(+0.198)#2,475
17.Hayesville0.45%0.17%(+0.281)#150.32%(+0.131)#2,476
18.La Grande0.44%0.17%(+0.275)#160.32%(+0.125)#2,477
19.Tigard0.43%0.17%(+0.264)#170.32%(+0.114)#2,478
20.Oatfield0.42%0.17%(+0.253)#180.32%(+0.103)#2,479
21.Cedar Mill0.41%0.17%(+0.239)#190.32%(+0.090)#2,480
22.Molalla0.37%0.17%(+0.207)#200.32%(+0.057)#2,481
23.Keizer0.36%0.17%(+0.190)#210.32%(+0.040)#2,757
24.Donald0.35%0.17%(+0.180)#220.32%(+0.030)#2,758
25.Newport0.31%0.17%(+0.142)#230.32%(-0.008)#2,759
26.Klamath Falls0.31%0.17%(+0.139)#240.32%(-0.010)#2,760
27.Gervais0.31%0.17%(+0.139)#250.32%(-0.011)#2,761
28.Sisters0.30%0.17%(+0.133)#260.32%(-0.017)#2,762
29.Umatilla0.28%0.17%(+0.115)#270.32%(-0.035)#2,763
30.Durham0.27%0.17%(+0.101)#280.32%(-0.049)#2,764
31.Salem0.25%0.17%(+0.086)#290.32%(-0.063)#2,845
32.Gold Beach0.24%0.17%(+0.069)#300.32%(-0.081)#2,846
33.Gresham0.23%0.17%(+0.058)#310.32%(-0.091)#2,847
34.Dallas0.22%0.17%(+0.050)#320.32%(-0.099)#2,848
35.Central Point0.21%0.17%(+0.041)#330.32%(-0.109)#2,849
36.Mcminnville0.19%0.17%(+0.021)#340.32%(-0.129)#2,850
37.Hood River0.17%0.17%(+0.001)#350.32%(-0.149)#2,851
38.Oak Hills0.15%0.17%(-0.015)#360.32%(-0.165)#2,852
39.Lake Oswego0.14%0.17%(-0.030)#370.32%(-0.179)#2,853
40.Springfield0.14%0.17%(-0.030)#380.32%(-0.180)#2,854
41.North Bend0.14%0.17%(-0.031)#390.32%(-0.181)#2,855
42.Portland0.14%0.17%(-0.032)#400.32%(-0.182)#2,856
43.Eugene0.13%0.17%(-0.042)#410.32%(-0.192)#2,970
44.Hermiston0.11%0.17%(-0.054)#420.32%(-0.204)#2,971
45.Gladstone0.10%0.17%(-0.068)#430.32%(-0.218)#2,972
46.Ashland0.093%0.17%(-0.074)#440.32%(-0.224)#2,973
47.Corvallis0.092%0.17%(-0.076)#450.32%(-0.226)#2,974
48.Sherwood0.079%0.17%(-0.089)#460.32%(-0.239)#2,975
49.Forest Grove0.076%0.17%(-0.091)#470.32%(-0.241)#2,976
50.Redmond0.073%0.17%(-0.095)#480.32%(-0.245)#2,977
51.West Linn0.059%0.17%(-0.109)#490.32%(-0.259)#2,978
52.Canby0.055%0.17%(-0.113)#500.32%(-0.263)#2,979
53.Monmouth0.054%0.17%(-0.114)#510.32%(-0.263)#2,980
54.Wilsonville0.046%0.17%(-0.122)#520.32%(-0.272)#2,981
55.Bethany0.045%0.17%(-0.123)#530.32%(-0.273)#2,982
56.The Dalles0.044%0.17%(-0.124)#540.32%(-0.274)#2,983
57.Roseburg0.030%0.17%(-0.138)#550.32%(-0.288)#2,984
58.Wood Village0.022%0.17%(-0.146)#560.32%(-0.296)#2,985
59.Medford0.014%0.17%(-0.154)#570.32%(-0.304)#2,986
60.Albany0.0071%0.17%(-0.161)#580.32%(-0.311)#2,987
61.Grants Pass0.0051%0.17%(-0.163)#590.32%(-0.313)#2,988

Common Questions

What are the Top 10 Cities with the Highest Percentage of Immigrants from Guatemala in Oregon?
Top 10 Cities with the Highest Percentage of Immigrants from Guatemala in Oregon are:
#1
7.04%
#2
3.17%
#3
2.93%
#4
2.27%
#5
1.66%
#6
1.35%
#7
1.00%
#8
0.93%
#9
0.80%
#10
0.64%
What city has the Highest Percentage of Immigrants from Guatemala in Oregon?
Parkdale has the Highest Percentage of Immigrants from Guatemala in Oregon with 7.04%.
What is the Percentage of Immigrants from Guatemala in the State of Oregon?
Percentage of Immigrants from Guatemala in Oregon is 0.17%.
What is the Percentage of Immigrants from Guatemala in the United States?
Percentage of Immigrants from Guatemala in the United States is 0.32%.