Cities with the Highest Percentage of Immigrants from Guatemala in Indiana
RELATED REPORTS & OPTIONS
Guatemala
Indiana
Compare Cities
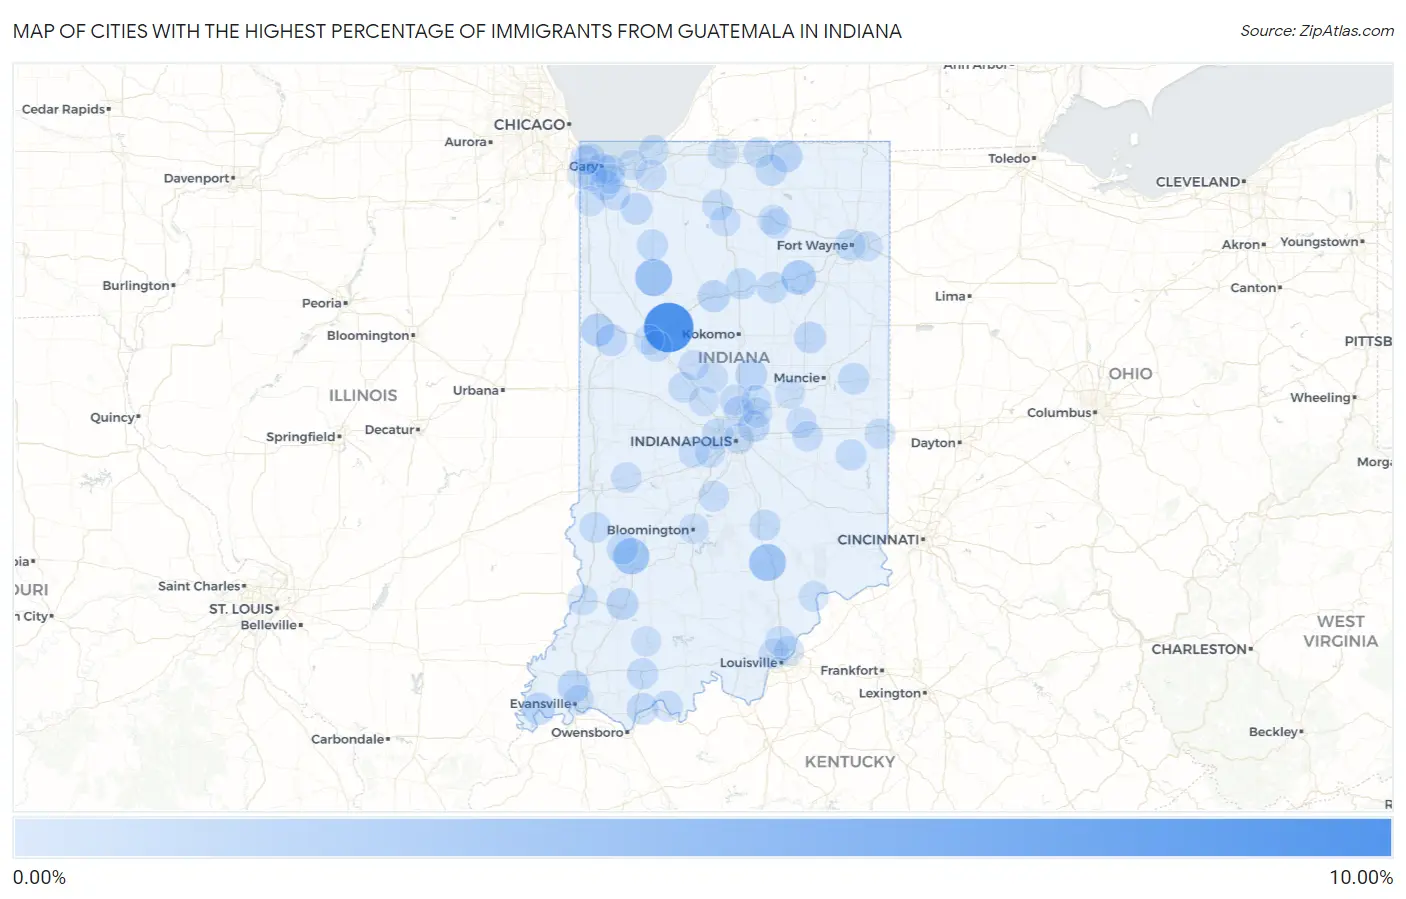
Map of Cities with the Highest Percentage of Immigrants from Guatemala in Indiana
0.00%
10.00%
Cities with the Highest Percentage of Immigrants from Guatemala in Indiana
| City | Guatemala | vs State | vs National | |
| 1. | Americus | 8.74% | 0.13%(+8.61)#-1 | 0.32%(+8.42)#0 |
| 2. | Young America | 3.33% | 0.13%(+3.21)#0 | 0.32%(+3.02)#1 |
| 3. | Monon | 3.06% | 0.13%(+2.93)#1 | 0.32%(+2.74)#2 |
| 4. | Seymour | 2.97% | 0.13%(+2.84)#2 | 0.32%(+2.65)#3 |
| 5. | Lyons | 2.62% | 0.13%(+2.49)#3 | 0.32%(+2.30)#4 |
| 6. | Andrews | 1.89% | 0.13%(+1.76)#4 | 0.32%(+1.57)#5 |
| 7. | Boswell | 1.29% | 0.13%(+1.17)#5 | 0.32%(+0.975)#6 |
| 8. | Darmstadt | 0.95% | 0.13%(+0.824)#6 | 0.32%(+0.634)#7 |
| 9. | Mount Vernon | 0.93% | 0.13%(+0.798)#7 | 0.32%(+0.608)#8 |
| 10. | Atlanta | 0.91% | 0.13%(+0.778)#8 | 0.32%(+0.588)#9 |
| 11. | Middlebury | 0.90% | 0.13%(+0.770)#9 | 0.32%(+0.580)#10 |
| 12. | Logansport | 0.88% | 0.13%(+0.753)#10 | 0.32%(+0.563)#11 |
| 13. | Mineral Springs | 0.87% | 0.13%(+0.741)#11 | 0.32%(+0.551)#12 |
| 14. | Washington | 0.85% | 0.13%(+0.725)#12 | 0.32%(+0.535)#13 |
| 15. | Pine Village | 0.74% | 0.13%(+0.610)#13 | 0.32%(+0.420)#14 |
| 16. | Kouts | 0.72% | 0.13%(+0.593)#14 | 0.32%(+0.403)#15 |
| 17. | Upland | 0.71% | 0.13%(+0.579)#15 | 0.32%(+0.389)#16 |
| 18. | Grandview | 0.68% | 0.13%(+0.554)#16 | 0.32%(+0.363)#17 |
| 19. | Lawrence | 0.68% | 0.13%(+0.551)#18 | 0.32%(+0.361)#2,511 |
| 20. | Farmland | 0.62% | 0.13%(+0.489)#19 | 0.32%(+0.299)#2,512 |
| 21. | Wabash | 0.60% | 0.13%(+0.477)#20 | 0.32%(+0.287)#2,513 |
| 22. | Goshen | 0.60% | 0.13%(+0.472)#21 | 0.32%(+0.282)#2,514 |
| 23. | Linton | 0.54% | 0.13%(+0.416)#22 | 0.32%(+0.226)#2,515 |
| 24. | Mexico | 0.53% | 0.13%(+0.404)#23 | 0.32%(+0.214)#2,516 |
| 25. | Medaryville | 0.51% | 0.13%(+0.385)#24 | 0.32%(+0.195)#2,517 |
| 26. | Fort Wayne | 0.50% | 0.13%(+0.368)#25 | 0.32%(+0.178)#2,880 |
| 27. | Clermont | 0.49% | 0.13%(+0.365)#26 | 0.32%(+0.175)#2,881 |
| 28. | Dale | 0.49% | 0.13%(+0.363)#27 | 0.32%(+0.173)#2,882 |
| 29. | Shelburn | 0.47% | 0.13%(+0.342)#28 | 0.32%(+0.152)#2,883 |
| 30. | Connersville | 0.42% | 0.13%(+0.290)#29 | 0.32%(+0.100)#2,884 |
| 31. | Lafayette | 0.42% | 0.13%(+0.290)#30 | 0.32%(+0.100)#2,952 |
| 32. | Columbus | 0.39% | 0.13%(+0.259)#31 | 0.32%(+0.069)#2,953 |
| 33. | Thorntown | 0.36% | 0.13%(+0.230)#32 | 0.32%(+0.040)#2,954 |
| 34. | East Chicago | 0.35% | 0.13%(+0.221)#33 | 0.32%(+0.031)#2,955 |
| 35. | Tell City | 0.32% | 0.13%(+0.194)#34 | 0.32%(+0.004)#2,956 |
| 36. | Painted Hills | 0.30% | 0.13%(+0.174)#35 | 0.32%(-0.017)#2,957 |
| 37. | Plymouth | 0.30% | 0.13%(+0.171)#36 | 0.32%(-0.019)#2,958 |
| 38. | Elkhart | 0.27% | 0.13%(+0.142)#37 | 0.32%(-0.048)#2,959 |
| 39. | Lakes Of The Four Seasons | 0.26% | 0.13%(+0.136)#38 | 0.32%(-0.054)#2,960 |
| 40. | Westfield | 0.24% | 0.13%(+0.115)#39 | 0.32%(-0.075)#2,961 |
| 41. | Munster | 0.24% | 0.13%(+0.108)#40 | 0.32%(-0.082)#2,962 |
| 42. | Kirklin | 0.23% | 0.13%(+0.104)#41 | 0.32%(-0.087)#2,963 |
| 43. | Richmond | 0.22% | 0.13%(+0.094)#42 | 0.32%(-0.096)#2,964 |
| 44. | Vincennes | 0.21% | 0.13%(+0.082)#43 | 0.32%(-0.108)#2,965 |
| 45. | Indianapolis | 0.20% | 0.13%(+0.074)#44 | 0.32%(-0.116)#2,966 |
| 46. | Clayton | 0.19% | 0.13%(+0.067)#45 | 0.32%(-0.123)#2,967 |
| 47. | Shirley | 0.19% | 0.13%(+0.067)#46 | 0.32%(-0.123)#2,968 |
| 48. | Knightstown | 0.18% | 0.13%(+0.056)#47 | 0.32%(-0.134)#2,969 |
| 49. | Frankfort | 0.18% | 0.13%(+0.048)#48 | 0.32%(-0.142)#2,970 |
| 50. | Argos | 0.17% | 0.13%(+0.043)#49 | 0.32%(-0.147)#2,971 |
| 51. | Merrillville | 0.17% | 0.13%(+0.041)#50 | 0.32%(-0.149)#2,972 |
| 52. | New Albany | 0.15% | 0.13%(+0.024)#51 | 0.32%(-0.166)#2,973 |
| 53. | Brazil | 0.15% | 0.13%(+0.020)#52 | 0.32%(-0.170)#2,974 |
| 54. | Gary | 0.14% | 0.13%(+0.016)#53 | 0.32%(-0.175)#2,975 |
| 55. | Hammond | 0.13% | 0.13%(+0.006)#54 | 0.32%(-0.185)#2,976 |
| 56. | Carmel | 0.12% | 0.13%(-0.003)#55 | 0.32%(-0.193)#2,977 |
| 57. | Westville | 0.12% | 0.13%(-0.009)#56 | 0.32%(-0.199)#2,978 |
| 58. | Plainfield | 0.11% | 0.13%(-0.016)#57 | 0.32%(-0.207)#2,979 |
| 59. | Hanover | 0.11% | 0.13%(-0.018)#58 | 0.32%(-0.209)#2,980 |
| 60. | Evansville | 0.11% | 0.13%(-0.019)#59 | 0.32%(-0.209)#2,981 |
| 61. | Winona Lake | 0.098% | 0.13%(-0.029)#60 | 0.32%(-0.219)#2,982 |
| 62. | Michigan City | 0.091% | 0.13%(-0.037)#61 | 0.32%(-0.227)#2,983 |
| 63. | Jeffersonville | 0.080% | 0.13%(-0.047)#62 | 0.32%(-0.237)#2,984 |
| 64. | Lake Station | 0.075% | 0.13%(-0.053)#63 | 0.32%(-0.243)#2,985 |
| 65. | Hobart | 0.071% | 0.13%(-0.057)#64 | 0.32%(-0.247)#2,986 |
| 66. | Griffith | 0.062% | 0.13%(-0.066)#65 | 0.32%(-0.256)#2,987 |
| 67. | Bloomington | 0.058% | 0.13%(-0.069)#66 | 0.32%(-0.260)#2,988 |
| 68. | Anderson | 0.051% | 0.13%(-0.077)#67 | 0.32%(-0.267)#2,989 |
| 69. | Warsaw | 0.042% | 0.13%(-0.085)#68 | 0.32%(-0.275)#2,990 |
| 70. | Lebanon | 0.041% | 0.13%(-0.087)#69 | 0.32%(-0.277)#2,991 |
| 71. | South Bend | 0.040% | 0.13%(-0.088)#70 | 0.32%(-0.278)#2,992 |
| 72. | West Lafayette | 0.033% | 0.13%(-0.094)#71 | 0.32%(-0.284)#2,993 |
| 73. | New Haven | 0.032% | 0.13%(-0.095)#72 | 0.32%(-0.286)#2,994 |
| 74. | Noblesville | 0.031% | 0.13%(-0.096)#73 | 0.32%(-0.286)#2,995 |
| 75. | Cedar Lake | 0.028% | 0.13%(-0.099)#74 | 0.32%(-0.290)#2,996 |
| 76. | Fishers | 0.027% | 0.13%(-0.100)#75 | 0.32%(-0.290)#2,997 |
| 77. | Jasper | 0.024% | 0.13%(-0.103)#76 | 0.32%(-0.293)#2,998 |
| 78. | Chesterton | 0.014% | 0.13%(-0.113)#77 | 0.32%(-0.304)#2,999 |
| 79. | Sellersburg | 0.010% | 0.13%(-0.118)#78 | 0.32%(-0.308)#3,000 |
Common Questions
What are the Top 10 Cities with the Highest Percentage of Immigrants from Guatemala in Indiana?
Top 10 Cities with the Highest Percentage of Immigrants from Guatemala in Indiana are:
#1
8.74%
#2
3.06%
#3
2.97%
#4
2.62%
#5
1.89%
#6
1.29%
#7
0.95%
#8
0.93%
#9
0.91%
#10
0.90%
What city has the Highest Percentage of Immigrants from Guatemala in Indiana?
Americus has the Highest Percentage of Immigrants from Guatemala in Indiana with 8.74%.
What is the Percentage of Immigrants from Guatemala in the State of Indiana?
Percentage of Immigrants from Guatemala in Indiana is 0.13%.
What is the Percentage of Immigrants from Guatemala in the United States?
Percentage of Immigrants from Guatemala in the United States is 0.32%.