Cities with the Highest Percentage of Immigrants from Guatemala in Ohio
RELATED REPORTS & OPTIONS
Guatemala
Ohio
Compare Cities
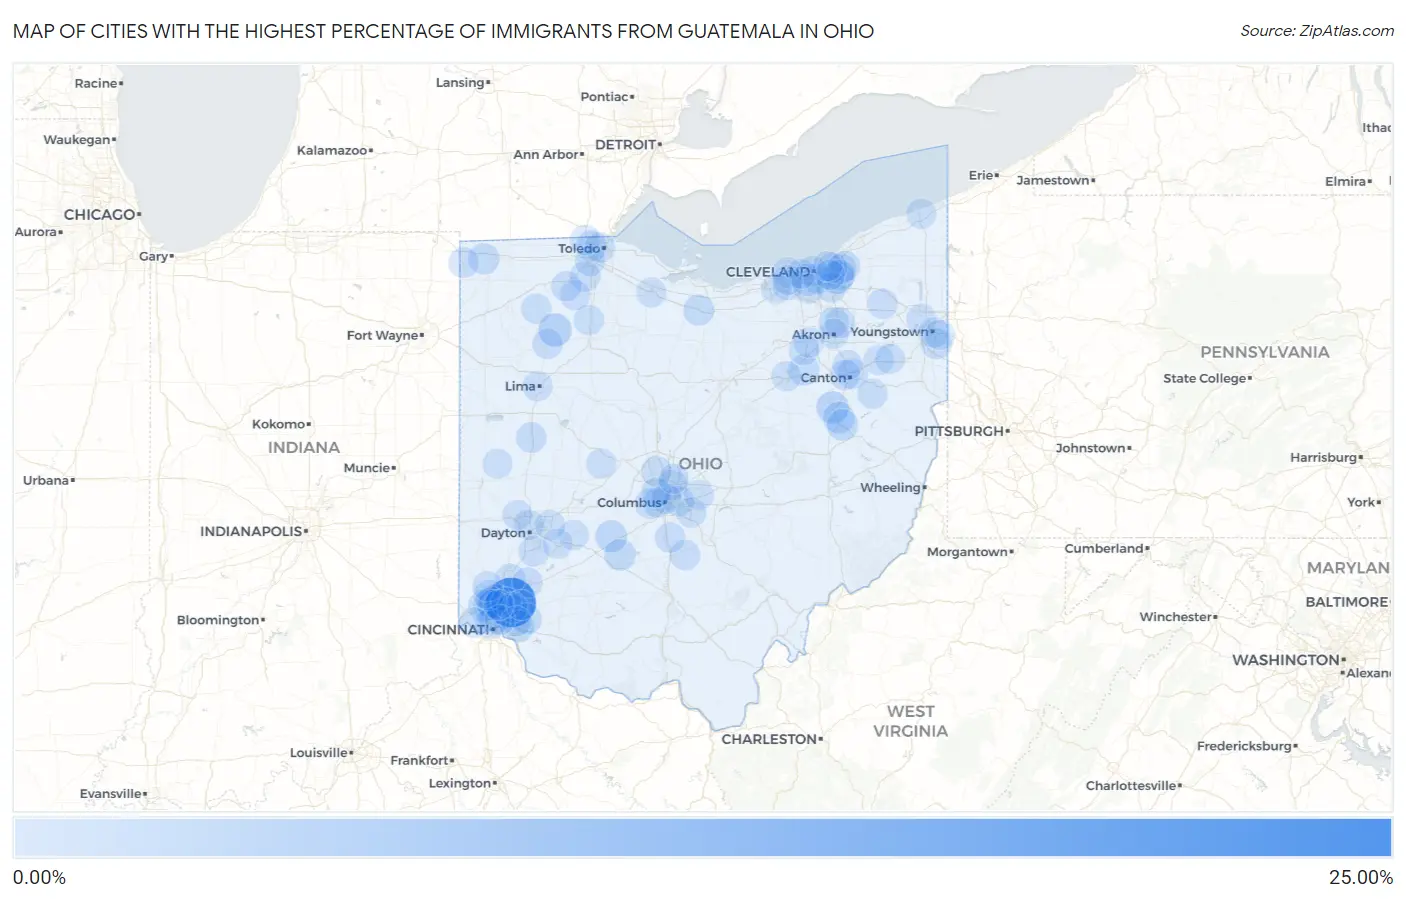
Map of Cities with the Highest Percentage of Immigrants from Guatemala in Ohio
0.00%
25.00%
Cities with the Highest Percentage of Immigrants from Guatemala in Ohio
| City | Guatemala | vs State | vs National | |
| 1. | Brecon | 21.82% | 0.079%(+21.7)#-1 | 0.32%(+21.5)#0 |
| 2. | Leipsic | 3.39% | 0.079%(+3.31)#0 | 0.32%(+3.07)#1 |
| 3. | Springdale | 3.34% | 0.079%(+3.26)#1 | 0.32%(+3.02)#2 |
| 4. | Woodmere | 2.93% | 0.079%(+2.85)#2 | 0.32%(+2.61)#3 |
| 5. | Strasburg | 2.40% | 0.079%(+2.32)#3 | 0.32%(+2.08)#4 |
| 6. | Midway | 1.95% | 0.079%(+1.87)#4 | 0.32%(+1.63)#5 |
| 7. | Brooklyn | 1.79% | 0.079%(+1.72)#5 | 0.32%(+1.48)#6 |
| 8. | Dover | 1.59% | 0.079%(+1.51)#6 | 0.32%(+1.27)#7 |
| 9. | New Philadelphia | 1.53% | 0.079%(+1.45)#7 | 0.32%(+1.21)#8 |
| 10. | Bloomingburg | 1.47% | 0.079%(+1.39)#8 | 0.32%(+1.15)#9 |
| 11. | Northgate | 1.47% | 0.079%(+1.39)#9 | 0.32%(+1.15)#10 |
| 12. | Summerside | 1.35% | 0.079%(+1.27)#10 | 0.32%(+1.03)#11 |
| 13. | Montpelier | 1.20% | 0.079%(+1.12)#11 | 0.32%(+0.879)#12 |
| 14. | Orrville | 1.19% | 0.079%(+1.11)#12 | 0.32%(+0.874)#1,173 |
| 15. | Day Heights | 1.05% | 0.079%(+0.973)#13 | 0.32%(+0.734)#1,174 |
| 16. | New Burlington | 1.00% | 0.079%(+0.917)#14 | 0.32%(+0.678)#1,175 |
| 17. | Forest Park | 0.99% | 0.079%(+0.916)#15 | 0.32%(+0.677)#1,176 |
| 18. | Monroeville | 0.94% | 0.079%(+0.858)#16 | 0.32%(+0.619)#1,177 |
| 19. | St Bernard | 0.87% | 0.079%(+0.790)#17 | 0.32%(+0.552)#1,178 |
| 20. | Poland | 0.70% | 0.079%(+0.620)#18 | 0.32%(+0.382)#1,179 |
| 21. | Ottawa Hills | 0.67% | 0.079%(+0.590)#19 | 0.32%(+0.351)#1,180 |
| 22. | Cincinnati | 0.62% | 0.079%(+0.543)#25 | 0.32%(+0.305)#1,857 |
| 23. | Gates Mills | 0.56% | 0.079%(+0.477)#26 | 0.32%(+0.238)#1,858 |
| 24. | Anna | 0.55% | 0.079%(+0.475)#27 | 0.32%(+0.236)#1,859 |
| 25. | Monroe | 0.52% | 0.079%(+0.441)#28 | 0.32%(+0.202)#1,860 |
| 26. | Ottawa | 0.52% | 0.079%(+0.438)#40 | 0.32%(+0.199)#2,307 |
| 27. | Pepper Pike | 0.52% | 0.079%(+0.437)#41 | 0.32%(+0.199)#2,308 |
| 28. | Stoutsville | 0.48% | 0.079%(+0.405)#42 | 0.32%(+0.166)#2,309 |
| 29. | Garrettsville | 0.46% | 0.079%(+0.384)#43 | 0.32%(+0.145)#2,310 |
| 30. | Edon | 0.44% | 0.079%(+0.364)#44 | 0.32%(+0.126)#2,311 |
| 31. | Lincoln Village | 0.44% | 0.079%(+0.361)#45 | 0.32%(+0.122)#2,312 |
| 32. | Silver Lake | 0.42% | 0.079%(+0.341)#46 | 0.32%(+0.102)#2,313 |
| 33. | Canton | 0.40% | 0.079%(+0.325)#56 | 0.32%(+0.086)#2,679 |
| 34. | Haskins | 0.40% | 0.079%(+0.321)#57 | 0.32%(+0.083)#2,680 |
| 35. | Lebanon | 0.36% | 0.079%(+0.283)#58 | 0.32%(+0.044)#2,681 |
| 36. | Meyers Lake | 0.36% | 0.079%(+0.279)#59 | 0.32%(+0.041)#2,682 |
| 37. | Centerville | 0.35% | 0.079%(+0.276)#60 | 0.32%(+0.037)#2,683 |
| 38. | Newburgh Heights | 0.34% | 0.079%(+0.262)#61 | 0.32%(+0.023)#2,684 |
| 39. | Greenhills | 0.32% | 0.079%(+0.245)#62 | 0.32%(+0.006)#2,685 |
| 40. | Minerva Park | 0.32% | 0.079%(+0.238)#63 | 0.32%(-0.001)#2,686 |
| 41. | Fairfield | 0.29% | 0.079%(+0.210)#64 | 0.32%(-0.029)#2,687 |
| 42. | Holgate | 0.29% | 0.079%(+0.208)#65 | 0.32%(-0.030)#2,688 |
| 43. | North Baltimore | 0.28% | 0.079%(+0.197)#66 | 0.32%(-0.042)#2,689 |
| 44. | North Lima | 0.27% | 0.079%(+0.193)#67 | 0.32%(-0.045)#2,690 |
| 45. | Whitehall | 0.24% | 0.079%(+0.160)#68 | 0.32%(-0.078)#2,691 |
| 46. | Weston | 0.21% | 0.079%(+0.128)#69 | 0.32%(-0.111)#2,692 |
| 47. | Powell | 0.21% | 0.079%(+0.126)#70 | 0.32%(-0.112)#2,693 |
| 48. | Mayfield Heights | 0.20% | 0.079%(+0.120)#71 | 0.32%(-0.119)#2,694 |
| 49. | Dayton | 0.20% | 0.079%(+0.118)#72 | 0.32%(-0.121)#2,695 |
| 50. | Ashville | 0.20% | 0.079%(+0.117)#73 | 0.32%(-0.121)#2,696 |
| 51. | Grand Rapids | 0.19% | 0.079%(+0.115)#74 | 0.32%(-0.124)#2,697 |
| 52. | Malvern | 0.19% | 0.079%(+0.114)#75 | 0.32%(-0.125)#2,698 |
| 53. | Sharonville | 0.19% | 0.079%(+0.106)#76 | 0.32%(-0.132)#2,699 |
| 54. | Rittman | 0.18% | 0.079%(+0.102)#77 | 0.32%(-0.136)#2,700 |
| 55. | Bedford | 0.18% | 0.079%(+0.097)#78 | 0.32%(-0.141)#2,701 |
| 56. | North Lewisburg | 0.17% | 0.079%(+0.091)#79 | 0.32%(-0.148)#2,702 |
| 57. | Maumee | 0.17% | 0.079%(+0.087)#80 | 0.32%(-0.151)#2,703 |
| 58. | Cleveland | 0.17% | 0.079%(+0.087)#81 | 0.32%(-0.152)#2,704 |
| 59. | Hamilton | 0.16% | 0.079%(+0.079)#82 | 0.32%(-0.159)#2,705 |
| 60. | Wadsworth | 0.15% | 0.079%(+0.075)#83 | 0.32%(-0.164)#2,706 |
| 61. | Valleyview | 0.15% | 0.079%(+0.070)#84 | 0.32%(-0.169)#2,707 |
| 62. | Niles | 0.14% | 0.079%(+0.065)#85 | 0.32%(-0.174)#2,708 |
| 63. | Lima | 0.14% | 0.079%(+0.064)#86 | 0.32%(-0.174)#2,709 |
| 64. | Bay Village | 0.14% | 0.079%(+0.064)#87 | 0.32%(-0.174)#2,710 |
| 65. | Montgomery | 0.13% | 0.079%(+0.050)#88 | 0.32%(-0.188)#2,711 |
| 66. | Cedarville | 0.13% | 0.079%(+0.049)#89 | 0.32%(-0.190)#2,712 |
| 67. | Clayton | 0.12% | 0.079%(+0.041)#90 | 0.32%(-0.197)#2,713 |
| 68. | Columbus | 0.11% | 0.079%(+0.032)#91 | 0.32%(-0.207)#2,714 |
| 69. | Cuyahoga Falls | 0.11% | 0.079%(+0.027)#92 | 0.32%(-0.212)#2,715 |
| 70. | Youngstown | 0.10% | 0.079%(+0.026)#93 | 0.32%(-0.213)#2,716 |
| 71. | Versailles | 0.10% | 0.079%(+0.023)#94 | 0.32%(-0.216)#2,717 |
| 72. | Pickerington | 0.099% | 0.079%(+0.020)#95 | 0.32%(-0.219)#2,718 |
| 73. | North Olmsted | 0.096% | 0.079%(+0.017)#96 | 0.32%(-0.222)#2,719 |
| 74. | Mack | 0.094% | 0.079%(+0.014)#97 | 0.32%(-0.224)#2,720 |
| 75. | Terrace Park | 0.093% | 0.079%(+0.014)#98 | 0.32%(-0.225)#2,721 |
| 76. | North Ridgeville | 0.093% | 0.079%(+0.014)#99 | 0.32%(-0.225)#2,722 |
| 77. | Campbell | 0.090% | 0.079%(+0.010)#100 | 0.32%(-0.228)#2,723 |
| 78. | Parma | 0.089% | 0.079%(+0.010)#101 | 0.32%(-0.228)#2,724 |
| 79. | Upper Arlington | 0.082% | 0.079%(+0.003)#102 | 0.32%(-0.236)#2,901 |
| 80. | Pataskala | 0.073% | 0.079%(-0.006)#103 | 0.32%(-0.245)#2,902 |
| 81. | Toledo | 0.071% | 0.079%(-0.008)#104 | 0.32%(-0.247)#2,903 |
| 82. | Lakewood | 0.069% | 0.079%(-0.010)#105 | 0.32%(-0.249)#2,904 |
| 83. | North Canton | 0.068% | 0.079%(-0.012)#106 | 0.32%(-0.250)#2,905 |
| 84. | Norwood | 0.063% | 0.079%(-0.016)#107 | 0.32%(-0.255)#2,906 |
| 85. | Sylvania | 0.063% | 0.079%(-0.016)#108 | 0.32%(-0.255)#2,907 |
| 86. | Akron | 0.061% | 0.079%(-0.018)#109 | 0.32%(-0.257)#2,908 |
| 87. | Fremont | 0.057% | 0.079%(-0.022)#110 | 0.32%(-0.261)#2,909 |
| 88. | Loveland | 0.053% | 0.079%(-0.026)#111 | 0.32%(-0.265)#2,910 |
| 89. | Westlake | 0.047% | 0.079%(-0.032)#112 | 0.32%(-0.271)#2,911 |
| 90. | Glendale | 0.046% | 0.079%(-0.033)#113 | 0.32%(-0.271)#2,912 |
| 91. | South Euclid | 0.041% | 0.079%(-0.038)#114 | 0.32%(-0.276)#2,913 |
| 92. | Westerville | 0.036% | 0.079%(-0.043)#115 | 0.32%(-0.282)#2,914 |
| 93. | Shaker Heights | 0.034% | 0.079%(-0.045)#116 | 0.32%(-0.283)#2,915 |
| 94. | East Cleveland | 0.029% | 0.079%(-0.050)#117 | 0.32%(-0.289)#2,916 |
| 95. | Alliance | 0.028% | 0.079%(-0.051)#118 | 0.32%(-0.290)#2,917 |
| 96. | Fairborn | 0.026% | 0.079%(-0.053)#119 | 0.32%(-0.292)#2,918 |
| 97. | Sebring | 0.024% | 0.079%(-0.055)#120 | 0.32%(-0.294)#2,919 |
| 98. | Xenia | 0.024% | 0.079%(-0.056)#121 | 0.32%(-0.294)#2,920 |
| 99. | Edgewood | 0.023% | 0.079%(-0.056)#122 | 0.32%(-0.295)#2,921 |
| 100. | Wooster | 0.022% | 0.079%(-0.057)#123 | 0.32%(-0.296)#2,922 |
Common Questions
What are the Top 10 Cities with the Highest Percentage of Immigrants from Guatemala in Ohio?
Top 10 Cities with the Highest Percentage of Immigrants from Guatemala in Ohio are:
#1
21.82%
#2
3.39%
#3
3.34%
#4
2.93%
#5
2.40%
#6
1.95%
#7
1.79%
#8
1.59%
#9
1.53%
#10
1.47%
What city has the Highest Percentage of Immigrants from Guatemala in Ohio?
Brecon has the Highest Percentage of Immigrants from Guatemala in Ohio with 21.82%.
What is the Percentage of Immigrants from Guatemala in the State of Ohio?
Percentage of Immigrants from Guatemala in Ohio is 0.079%.
What is the Percentage of Immigrants from Guatemala in the United States?
Percentage of Immigrants from Guatemala in the United States is 0.32%.