Cities with the Highest Percentage of Immigrants from Guatemala in Virginia
RELATED REPORTS & OPTIONS
Guatemala
Virginia
Compare Cities
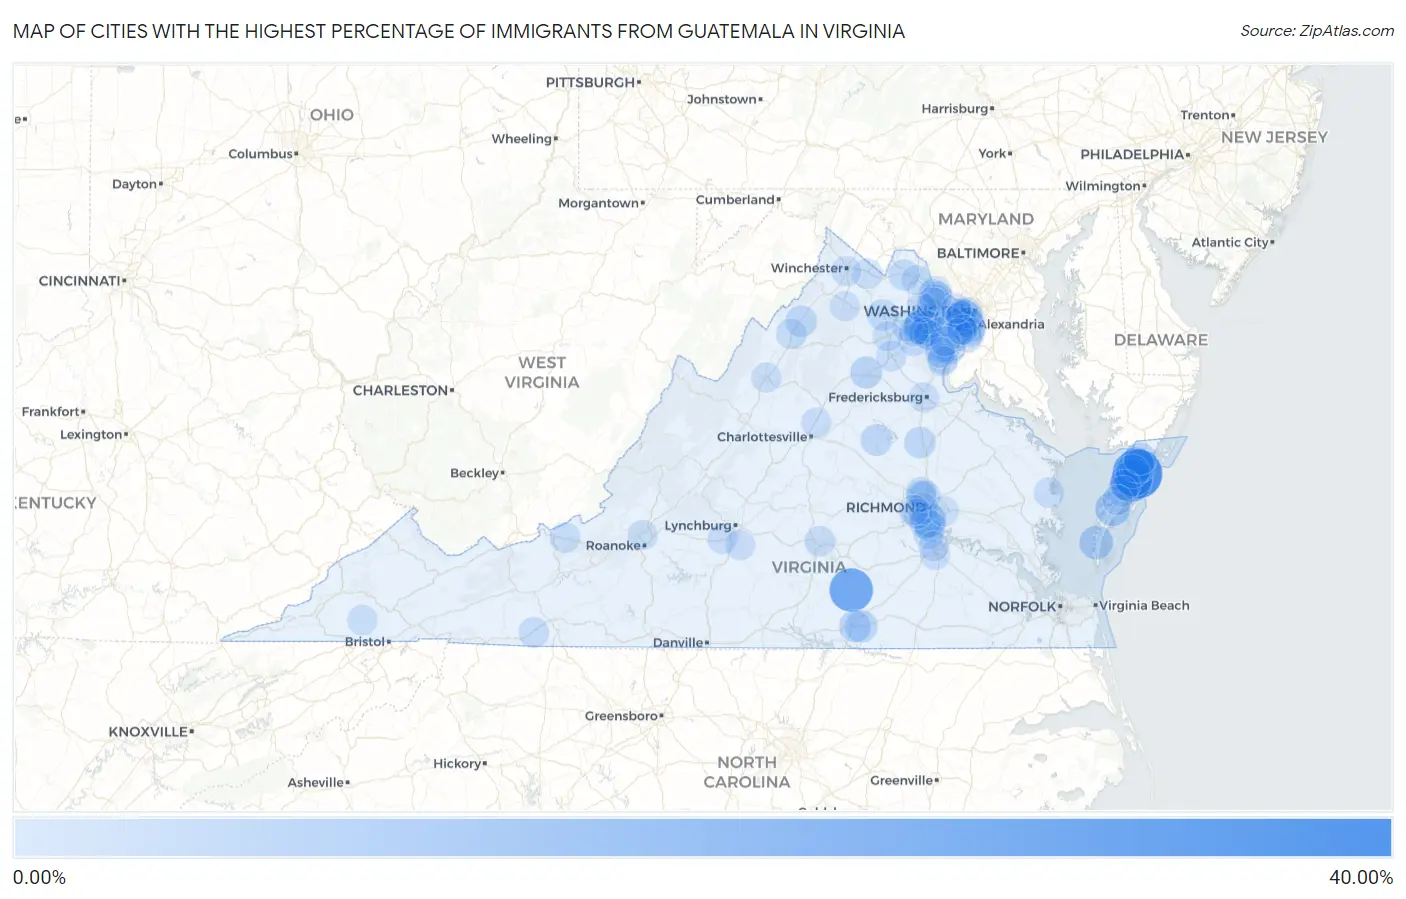
Map of Cities with the Highest Percentage of Immigrants from Guatemala in Virginia
0.00%
40.00%
Cities with the Highest Percentage of Immigrants from Guatemala in Virginia
| City | Guatemala | vs State | vs National | |
| 1. | Metompkin | 33.61% | 0.42%(+33.2)#-1 | 0.32%(+33.3)#0 |
| 2. | Kenbridge | 22.97% | 0.42%(+22.5)#0 | 0.32%(+22.6)#1 |
| 3. | Accomac | 19.16% | 0.42%(+18.7)#1 | 0.32%(+18.8)#2 |
| 4. | Pastoria | 13.53% | 0.42%(+13.1)#2 | 0.32%(+13.2)#3 |
| 5. | Bloxom | 8.54% | 0.42%(+8.13)#3 | 0.32%(+8.22)#4 |
| 6. | Bailey S Crossroads | 8.45% | 0.42%(+8.03)#4 | 0.32%(+8.13)#5 |
| 7. | Exmore | 8.03% | 0.42%(+7.61)#40 | 0.32%(+7.71)#1,328 |
| 8. | Sudley | 7.95% | 0.42%(+7.53)#41 | 0.32%(+7.63)#1,329 |
| 9. | Bensley | 7.34% | 0.42%(+6.93)#42 | 0.32%(+7.03)#1,330 |
| 10. | Cheriton | 6.76% | 0.42%(+6.34)#43 | 0.32%(+6.44)#1,331 |
| 11. | Manassas Park | 6.61% | 0.42%(+6.19)#44 | 0.32%(+6.29)#1,332 |
| 12. | Bull Run | 6.09% | 0.42%(+5.67)#89 | 0.32%(+5.77)#2,180 |
| 13. | Nelsonia | 6.05% | 0.42%(+5.63)#90 | 0.32%(+5.73)#2,181 |
| 14. | Parksley | 6.02% | 0.42%(+5.60)#91 | 0.32%(+5.70)#2,182 |
| 15. | Brodnax | 4.11% | 0.42%(+3.69)#92 | 0.32%(+3.79)#2,183 |
| 16. | Hallwood | 4.07% | 0.42%(+3.65)#93 | 0.32%(+3.75)#2,184 |
| 17. | Culpeper | 3.46% | 0.42%(+3.05)#94 | 0.32%(+3.14)#2,185 |
| 18. | La Crosse | 3.36% | 0.42%(+2.95)#95 | 0.32%(+3.05)#2,186 |
| 19. | Meadowbrook | 3.27% | 0.42%(+2.85)#96 | 0.32%(+2.95)#2,187 |
| 20. | Seven Corners | 3.23% | 0.42%(+2.81)#97 | 0.32%(+2.91)#2,188 |
| 21. | Lake Caroline | 3.02% | 0.42%(+2.60)#98 | 0.32%(+2.70)#2,189 |
| 22. | Annandale | 2.97% | 0.42%(+2.55)#99 | 0.32%(+2.65)#2,233 |
| 23. | West Falls Church | 2.86% | 0.42%(+2.44)#100 | 0.32%(+2.54)#2,234 |
| 24. | Mineral | 2.77% | 0.42%(+2.35)#101 | 0.32%(+2.45)#2,235 |
| 25. | Nokesville | 2.69% | 0.42%(+2.27)#102 | 0.32%(+2.37)#2,236 |
| 26. | Lincolnia | 2.62% | 0.42%(+2.21)#103 | 0.32%(+2.31)#2,237 |
| 27. | Edinburg | 2.57% | 0.42%(+2.16)#104 | 0.32%(+2.26)#2,238 |
| 28. | Potomac Mills | 2.47% | 0.42%(+2.06)#105 | 0.32%(+2.16)#2,239 |
| 29. | Chantilly | 2.46% | 0.42%(+2.04)#106 | 0.32%(+2.14)#2,240 |
| 30. | Marshall | 2.24% | 0.42%(+1.83)#107 | 0.32%(+1.92)#2,241 |
| 31. | Bellwood | 2.09% | 0.42%(+1.68)#108 | 0.32%(+1.78)#2,242 |
| 32. | Yorkshire | 2.08% | 0.42%(+1.67)#109 | 0.32%(+1.77)#2,243 |
| 33. | Lakeside | 1.80% | 0.42%(+1.38)#110 | 0.32%(+1.48)#2,244 |
| 34. | Hamilton | 1.78% | 0.42%(+1.36)#111 | 0.32%(+1.46)#2,245 |
| 35. | Sterling | 1.78% | 0.42%(+1.36)#112 | 0.32%(+1.46)#2,246 |
| 36. | Chester | 1.57% | 0.42%(+1.15)#113 | 0.32%(+1.25)#2,247 |
| 37. | Earlysville | 1.52% | 0.42%(+1.11)#114 | 0.32%(+1.21)#2,248 |
| 38. | Groveton | 1.52% | 0.42%(+1.10)#115 | 0.32%(+1.20)#2,249 |
| 39. | Richmond | 1.48% | 0.42%(+1.06)#116 | 0.32%(+1.16)#2,250 |
| 40. | Melfa | 1.38% | 0.42%(+0.959)#117 | 0.32%(+1.06)#2,251 |
| 41. | Centreville | 1.35% | 0.42%(+0.930)#118 | 0.32%(+1.03)#2,816 |
| 42. | Woodbridge | 1.33% | 0.42%(+0.911)#119 | 0.32%(+1.01)#2,817 |
| 43. | Herndon | 1.29% | 0.42%(+0.871)#120 | 0.32%(+0.970)#2,818 |
| 44. | Kings Park | 1.25% | 0.42%(+0.832)#121 | 0.32%(+0.931)#2,819 |
| 45. | Galax | 1.23% | 0.42%(+0.810)#122 | 0.32%(+0.909)#2,820 |
| 46. | Farmville | 1.19% | 0.42%(+0.773)#123 | 0.32%(+0.872)#2,821 |
| 47. | Dumbarton | 1.18% | 0.42%(+0.768)#124 | 0.32%(+0.867)#2,822 |
| 48. | Sugarland Run | 1.17% | 0.42%(+0.754)#125 | 0.32%(+0.852)#2,823 |
| 49. | Huntington | 1.16% | 0.42%(+0.748)#126 | 0.32%(+0.847)#2,824 |
| 50. | Lake Barcroft | 1.13% | 0.42%(+0.716)#127 | 0.32%(+0.815)#2,825 |
| 51. | Gainesville | 1.10% | 0.42%(+0.685)#128 | 0.32%(+0.784)#2,826 |
| 52. | Franconia | 1.09% | 0.42%(+0.678)#129 | 0.32%(+0.777)#2,827 |
| 53. | Pembroke | 1.09% | 0.42%(+0.678)#130 | 0.32%(+0.777)#2,828 |
| 54. | Onley | 1.07% | 0.42%(+0.650)#131 | 0.32%(+0.749)#2,829 |
| 55. | Navy | 1.04% | 0.42%(+0.628)#132 | 0.32%(+0.727)#2,830 |
| 56. | Manassas | 1.02% | 0.42%(+0.602)#133 | 0.32%(+0.701)#2,831 |
| 57. | Laurel | 1.00% | 0.42%(+0.584)#134 | 0.32%(+0.683)#2,832 |
| 58. | Woodlawn Cdp Fairfax County | 0.97% | 0.42%(+0.550)#135 | 0.32%(+0.649)#2,833 |
| 59. | Alexandria | 0.94% | 0.42%(+0.527)#136 | 0.32%(+0.626)#2,834 |
| 60. | Mount Jackson | 0.93% | 0.42%(+0.511)#137 | 0.32%(+0.610)#2,835 |
| 61. | Dale City | 0.85% | 0.42%(+0.431)#138 | 0.32%(+0.530)#2,836 |
| 62. | Nickelsville | 0.83% | 0.42%(+0.417)#139 | 0.32%(+0.516)#2,837 |
| 63. | Manchester | 0.83% | 0.42%(+0.413)#140 | 0.32%(+0.512)#2,838 |
| 64. | Timberlake | 0.82% | 0.42%(+0.399)#141 | 0.32%(+0.498)#2,839 |
| 65. | Arlington | 0.82% | 0.42%(+0.399)#142 | 0.32%(+0.498)#2,840 |
| 66. | Bealeton | 0.81% | 0.42%(+0.397)#143 | 0.32%(+0.496)#2,841 |
| 67. | Dumfries | 0.81% | 0.42%(+0.391)#144 | 0.32%(+0.490)#2,842 |
| 68. | Rose Hill Cdp Fairfax County | 0.78% | 0.42%(+0.366)#145 | 0.32%(+0.465)#2,843 |
| 69. | Berryville | 0.74% | 0.42%(+0.323)#146 | 0.32%(+0.422)#2,844 |
| 70. | Bon Air | 0.74% | 0.42%(+0.322)#147 | 0.32%(+0.421)#2,845 |
| 71. | Sandston | 0.69% | 0.42%(+0.268)#148 | 0.32%(+0.367)#2,846 |
| 72. | Triangle | 0.67% | 0.42%(+0.254)#149 | 0.32%(+0.353)#2,847 |
| 73. | White Stone | 0.64% | 0.42%(+0.226)#150 | 0.32%(+0.325)#2,848 |
| 74. | Long Branch | 0.62% | 0.42%(+0.199)#151 | 0.32%(+0.298)#2,849 |
| 75. | Union Mill | 0.60% | 0.42%(+0.188)#152 | 0.32%(+0.287)#2,850 |
| 76. | Fredericksburg | 0.59% | 0.42%(+0.171)#153 | 0.32%(+0.270)#2,851 |
| 77. | Buckhall | 0.58% | 0.42%(+0.161)#154 | 0.32%(+0.260)#2,852 |
| 78. | Mount Vernon | 0.57% | 0.42%(+0.155)#155 | 0.32%(+0.254)#2,853 |
| 79. | Montclair | 0.57% | 0.42%(+0.149)#156 | 0.32%(+0.248)#2,854 |
| 80. | Rustburg | 0.56% | 0.42%(+0.142)#157 | 0.32%(+0.241)#2,855 |
| 81. | Dranesville | 0.53% | 0.42%(+0.118)#158 | 0.32%(+0.217)#2,856 |
| 82. | Hutchison | 0.50% | 0.42%(+0.087)#159 | 0.32%(+0.186)#2,857 |
| 83. | Hybla Valley | 0.49% | 0.42%(+0.075)#160 | 0.32%(+0.174)#2,858 |
| 84. | Winchester | 0.48% | 0.42%(+0.067)#161 | 0.32%(+0.166)#2,859 |
| 85. | Harrisonburg | 0.48% | 0.42%(+0.064)#162 | 0.32%(+0.163)#2,860 |
| 86. | Newington | 0.47% | 0.42%(+0.055)#163 | 0.32%(+0.154)#2,861 |
| 87. | Hollymead | 0.46% | 0.42%(+0.041)#164 | 0.32%(+0.140)#2,862 |
| 88. | Petersburg | 0.41% | 0.42%(-0.002)#165 | 0.32%(+0.097)#2,863 |
| 89. | Painter | 0.41% | 0.42%(-0.007)#166 | 0.32%(+0.092)#2,864 |
| 90. | Warrenton | 0.41% | 0.42%(-0.011)#167 | 0.32%(+0.088)#2,865 |
| 91. | Hollins | 0.39% | 0.42%(-0.026)#168 | 0.32%(+0.073)#2,866 |
| 92. | Kingstowne | 0.39% | 0.42%(-0.027)#169 | 0.32%(+0.072)#2,867 |
| 93. | Mcnair | 0.38% | 0.42%(-0.034)#170 | 0.32%(+0.065)#2,868 |
| 94. | Linton Hall | 0.38% | 0.42%(-0.040)#171 | 0.32%(+0.059)#2,869 |
| 95. | Front Royal | 0.37% | 0.42%(-0.045)#172 | 0.32%(+0.054)#2,870 |
| 96. | Lake Ridge | 0.37% | 0.42%(-0.045)#173 | 0.32%(+0.053)#2,871 |
| 97. | Pimmit Hills | 0.37% | 0.42%(-0.047)#174 | 0.32%(+0.051)#2,872 |
| 98. | South Riding | 0.36% | 0.42%(-0.057)#175 | 0.32%(+0.042)#2,873 |
| 99. | Colonial Heights | 0.32% | 0.42%(-0.092)#176 | 0.32%(+0.007)#2,874 |
| 100. | Leesburg | 0.32% | 0.42%(-0.093)#177 | 0.32%(+0.006)#2,875 |
Common Questions
What are the Top 10 Cities with the Highest Percentage of Immigrants from Guatemala in Virginia?
Top 10 Cities with the Highest Percentage of Immigrants from Guatemala in Virginia are:
What city has the Highest Percentage of Immigrants from Guatemala in Virginia?
Metompkin has the Highest Percentage of Immigrants from Guatemala in Virginia with 33.61%.
What is the Percentage of Immigrants from Guatemala in the State of Virginia?
Percentage of Immigrants from Guatemala in Virginia is 0.42%.
What is the Percentage of Immigrants from Guatemala in the United States?
Percentage of Immigrants from Guatemala in the United States is 0.32%.