Cities with the Highest Percentage of Immigrants from South Eastern Asia in Illinois
RELATED REPORTS & OPTIONS
South Eastern Asia
Illinois
Compare Cities
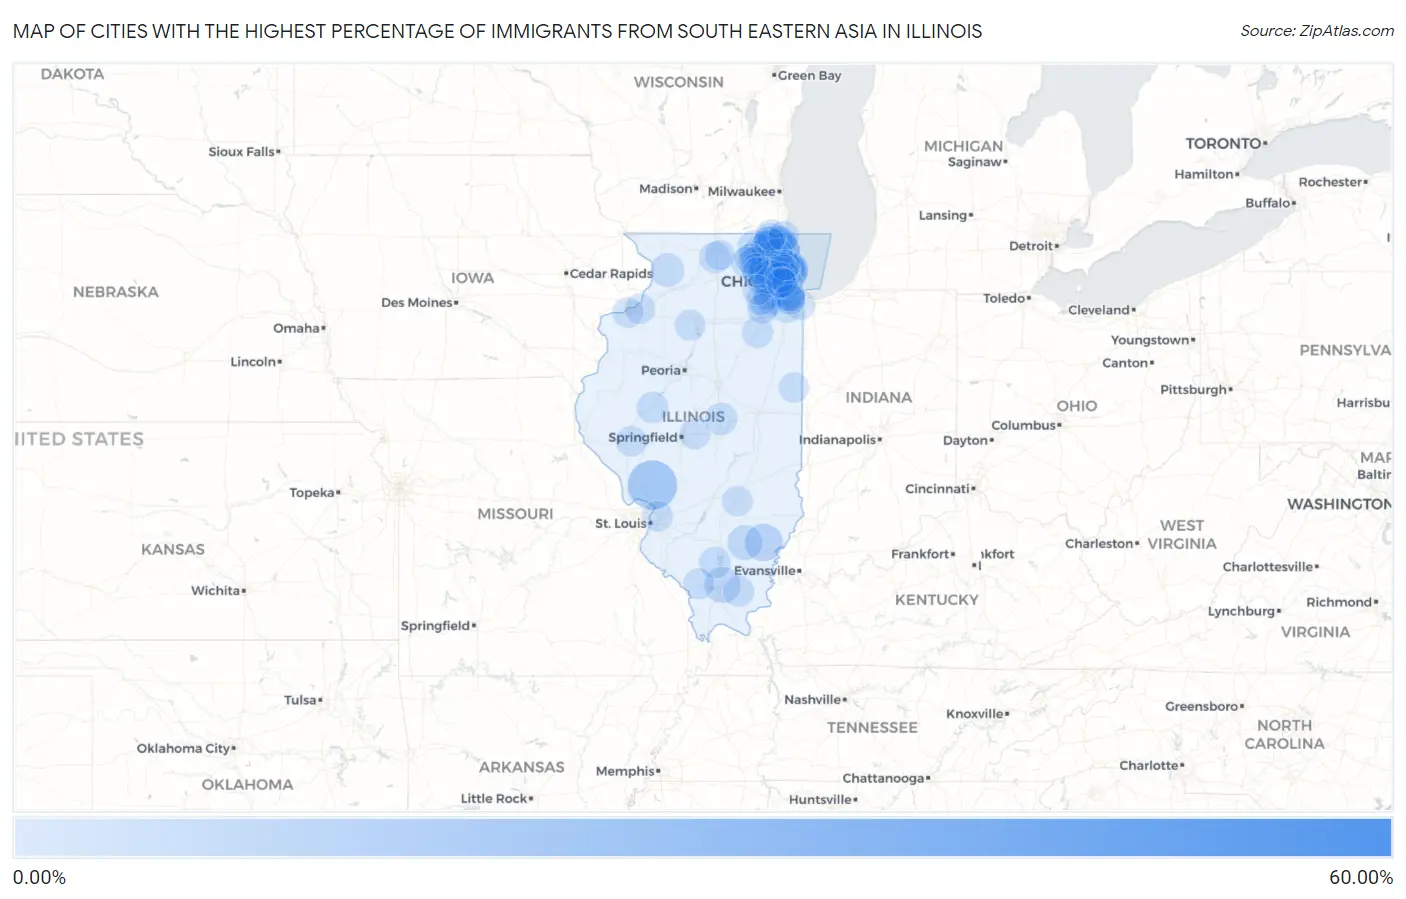
Map of Cities with the Highest Percentage of Immigrants from South Eastern Asia in Illinois
0.00%
60.00%
Cities with the Highest Percentage of Immigrants from South Eastern Asia in Illinois
| City | South Eastern Asia | vs State | vs National | |
| 1. | Marley | 60.00% | 1.10%(+58.9)#-1 | 1.30%(+58.7)#0 |
| 2. | Eagle Lake | 43.10% | 1.10%(+42.0)#0 | 1.30%(+41.8)#1 |
| 3. | Fidelity | 17.33% | 1.10%(+16.2)#1 | 1.30%(+16.0)#2 |
| 4. | Indian Creek | 16.27% | 1.10%(+15.2)#2 | 1.30%(+15.0)#3 |
| 5. | Harwood Heights | 9.27% | 1.10%(+8.17)#3 | 1.30%(+7.97)#4 |
| 6. | Morton Grove | 8.56% | 1.10%(+7.46)#4 | 1.30%(+7.26)#5 |
| 7. | Golden Gate | 7.78% | 1.10%(+6.68)#5 | 1.30%(+6.48)#6 |
| 8. | Glendale Heights | 7.76% | 1.10%(+6.66)#6 | 1.30%(+6.46)#7 |
| 9. | Skokie | 6.78% | 1.10%(+5.68)#7 | 1.30%(+5.48)#8 |
| 10. | Arbury Hills | 6.76% | 1.10%(+5.66)#8 | 1.30%(+5.46)#9 |
| 11. | Niles | 6.74% | 1.10%(+5.65)#10 | 1.30%(+5.45)#175 |
| 12. | Campbell's Island | 6.71% | 1.10%(+5.62)#11 | 1.30%(+5.42)#176 |
| 13. | Lincolnwood | 6.59% | 1.10%(+5.49)#12 | 1.30%(+5.29)#177 |
| 14. | Spillertown | 6.35% | 1.10%(+5.25)#13 | 1.30%(+5.05)#178 |
| 15. | Sims | 5.46% | 1.10%(+4.37)#14 | 1.30%(+4.17)#179 |
| 16. | Chicago Ridge | 4.40% | 1.10%(+3.30)#15 | 1.30%(+3.10)#180 |
| 17. | Round Lake | 4.39% | 1.10%(+3.29)#16 | 1.30%(+3.09)#181 |
| 18. | Carol Stream | 4.22% | 1.10%(+3.13)#17 | 1.30%(+2.93)#182 |
| 19. | Chadwick | 4.17% | 1.10%(+3.07)#18 | 1.30%(+2.87)#183 |
| 20. | Grandwood Park | 3.54% | 1.10%(+2.45)#19 | 1.30%(+2.25)#184 |
| 21. | Hoffman Estates | 3.53% | 1.10%(+2.43)#20 | 1.30%(+2.23)#185 |
| 22. | Streamwood | 3.47% | 1.10%(+2.38)#21 | 1.30%(+2.18)#186 |
| 23. | Gurnee | 3.36% | 1.10%(+2.26)#22 | 1.30%(+2.06)#187 |
| 24. | Maroa | 3.31% | 1.10%(+2.22)#23 | 1.30%(+2.02)#188 |
| 25. | Hanover Park | 3.30% | 1.10%(+2.20)#24 | 1.30%(+2.01)#189 |
| 26. | Hainesville | 3.30% | 1.10%(+2.20)#25 | 1.30%(+2.00)#190 |
| 27. | Lake Bluff | 3.29% | 1.10%(+2.20)#26 | 1.30%(+2.00)#191 |
| 28. | Itasca | 3.29% | 1.10%(+2.20)#27 | 1.30%(+2.00)#192 |
| 29. | Bull Valley | 3.29% | 1.10%(+2.19)#28 | 1.30%(+1.99)#193 |
| 30. | Woodridge | 2.97% | 1.10%(+1.87)#29 | 1.30%(+1.67)#194 |
| 31. | Norridge | 2.95% | 1.10%(+1.85)#30 | 1.30%(+1.65)#195 |
| 32. | Rolling Meadows | 2.94% | 1.10%(+1.84)#31 | 1.30%(+1.64)#242 |
| 33. | Waukegan | 2.93% | 1.10%(+1.83)#32 | 1.30%(+1.63)#243 |
| 34. | South Barrington | 2.92% | 1.10%(+1.82)#33 | 1.30%(+1.62)#244 |
| 35. | Des Plaines | 2.89% | 1.10%(+1.80)#34 | 1.30%(+1.60)#245 |
| 36. | Bath | 2.78% | 1.10%(+1.68)#35 | 1.30%(+1.48)#246 |
| 37. | Sesser | 2.78% | 1.10%(+1.68)#36 | 1.30%(+1.48)#247 |
| 38. | New Milford | 2.75% | 1.10%(+1.65)#37 | 1.30%(+1.46)#248 |
| 39. | Prairie Grove | 2.75% | 1.10%(+1.65)#38 | 1.30%(+1.45)#249 |
| 40. | Romeoville | 2.72% | 1.10%(+1.62)#39 | 1.30%(+1.42)#250 |
| 41. | Darien | 2.71% | 1.10%(+1.62)#40 | 1.30%(+1.42)#251 |
| 42. | Schiller Park | 2.66% | 1.10%(+1.56)#41 | 1.30%(+1.36)#252 |
| 43. | Forest Lake | 2.60% | 1.10%(+1.51)#42 | 1.30%(+1.31)#253 |
| 44. | Wheeling | 2.57% | 1.10%(+1.48)#43 | 1.30%(+1.28)#254 |
| 45. | Carpentersville | 2.51% | 1.10%(+1.42)#44 | 1.30%(+1.22)#255 |
| 46. | Worth | 2.39% | 1.10%(+1.29)#45 | 1.30%(+1.09)#256 |
| 47. | Addison | 2.35% | 1.10%(+1.25)#46 | 1.30%(+1.05)#257 |
| 48. | Carrier Mills | 2.33% | 1.10%(+1.23)#47 | 1.30%(+1.03)#258 |
| 49. | Lake In The Hills | 2.33% | 1.10%(+1.23)#48 | 1.30%(+1.03)#259 |
| 50. | Gardner | 2.30% | 1.10%(+1.21)#49 | 1.30%(+1.01)#260 |
| 51. | Buffalo | 2.27% | 1.10%(+1.17)#50 | 1.30%(+0.971)#261 |
| 52. | Lake Villa | 2.25% | 1.10%(+1.16)#51 | 1.30%(+0.956)#262 |
| 53. | Bolingbrook | 2.22% | 1.10%(+1.12)#52 | 1.30%(+0.919)#263 |
| 54. | Oakbrook Terrace | 2.19% | 1.10%(+1.09)#53 | 1.30%(+0.893)#264 |
| 55. | Elmwood Park | 2.18% | 1.10%(+1.09)#54 | 1.30%(+0.886)#265 |
| 56. | Elk Grove Village | 2.18% | 1.10%(+1.08)#55 | 1.30%(+0.885)#266 |
| 57. | Bartlett | 2.17% | 1.10%(+1.08)#56 | 1.30%(+0.876)#287 |
| 58. | Mount Prospect | 2.17% | 1.10%(+1.07)#57 | 1.30%(+0.875)#288 |
| 59. | Hampshire | 2.17% | 1.10%(+1.07)#58 | 1.30%(+0.873)#289 |
| 60. | Harrison | 2.16% | 1.10%(+1.06)#59 | 1.30%(+0.860)#290 |
| 61. | Justice | 2.16% | 1.10%(+1.06)#60 | 1.30%(+0.859)#291 |
| 62. | Rosemont | 2.15% | 1.10%(+1.05)#61 | 1.30%(+0.852)#292 |
| 63. | Volo | 2.14% | 1.10%(+1.04)#62 | 1.30%(+0.839)#293 |
| 64. | Schaumburg | 2.09% | 1.10%(+0.995)#63 | 1.30%(+0.796)#294 |
| 65. | Frankfort Square | 2.07% | 1.10%(+0.974)#64 | 1.30%(+0.775)#295 |
| 66. | Vernon Hills | 2.07% | 1.10%(+0.970)#65 | 1.30%(+0.771)#296 |
| 67. | Antioch | 2.03% | 1.10%(+0.928)#66 | 1.30%(+0.729)#297 |
| 68. | Oak Brook | 2.02% | 1.10%(+0.924)#67 | 1.30%(+0.725)#298 |
| 69. | West Chicago | 2.02% | 1.10%(+0.924)#68 | 1.30%(+0.725)#299 |
| 70. | Gilberts | 2.02% | 1.10%(+0.920)#69 | 1.30%(+0.721)#300 |
| 71. | Tiskilwa | 2.01% | 1.10%(+0.914)#70 | 1.30%(+0.714)#301 |
| 72. | Pontoon Beach | 2.00% | 1.10%(+0.907)#71 | 1.30%(+0.707)#302 |
| 73. | Bluffs | 1.99% | 1.10%(+0.892)#72 | 1.30%(+0.692)#303 |
| 74. | Berwyn | 1.98% | 1.10%(+0.887)#73 | 1.30%(+0.688)#304 |
| 75. | Wheaton | 1.91% | 1.10%(+0.813)#74 | 1.30%(+0.613)#305 |
| 76. | Broadview | 1.90% | 1.10%(+0.801)#75 | 1.30%(+0.601)#306 |
| 77. | Edgewood | 1.86% | 1.10%(+0.768)#76 | 1.30%(+0.568)#307 |
| 78. | Park Ridge | 1.85% | 1.10%(+0.752)#77 | 1.30%(+0.553)#308 |
| 79. | Elgin | 1.83% | 1.10%(+0.733)#78 | 1.30%(+0.534)#309 |
| 80. | Round Lake Heights | 1.82% | 1.10%(+0.727)#79 | 1.30%(+0.527)#310 |
| 81. | Rock Island | 1.80% | 1.10%(+0.706)#80 | 1.30%(+0.507)#311 |
| 82. | Cherry Valley | 1.80% | 1.10%(+0.699)#81 | 1.30%(+0.500)#312 |
| 83. | Bloomingdale | 1.79% | 1.10%(+0.695)#82 | 1.30%(+0.496)#313 |
| 84. | Lansing | 1.79% | 1.10%(+0.693)#83 | 1.30%(+0.494)#314 |
| 85. | La Grange Park | 1.78% | 1.10%(+0.681)#84 | 1.30%(+0.481)#315 |
| 86. | East Moline | 1.76% | 1.10%(+0.661)#85 | 1.30%(+0.461)#316 |
| 87. | Huntley | 1.75% | 1.10%(+0.650)#86 | 1.30%(+0.450)#317 |
| 88. | Zion | 1.75% | 1.10%(+0.649)#87 | 1.30%(+0.450)#318 |
| 89. | Midlothian | 1.73% | 1.10%(+0.636)#88 | 1.30%(+0.436)#319 |
| 90. | Crestwood | 1.72% | 1.10%(+0.626)#89 | 1.30%(+0.427)#320 |
| 91. | Hoopeston | 1.72% | 1.10%(+0.624)#90 | 1.30%(+0.424)#321 |
| 92. | South Elgin | 1.71% | 1.10%(+0.614)#91 | 1.30%(+0.415)#322 |
| 93. | Northlake | 1.66% | 1.10%(+0.567)#92 | 1.30%(+0.367)#323 |
| 94. | Alsip | 1.66% | 1.10%(+0.562)#93 | 1.30%(+0.363)#324 |
| 95. | Crystal Lawns | 1.62% | 1.10%(+0.527)#94 | 1.30%(+0.327)#325 |
| 96. | Glenview | 1.60% | 1.10%(+0.502)#95 | 1.30%(+0.303)#326 |
| 97. | Plainfield | 1.59% | 1.10%(+0.490)#96 | 1.30%(+0.290)#327 |
| 98. | Shorewood | 1.56% | 1.10%(+0.460)#97 | 1.30%(+0.261)#328 |
| 99. | Aurora | 1.54% | 1.10%(+0.445)#98 | 1.30%(+0.246)#329 |
| 100. | Westchester | 1.53% | 1.10%(+0.431)#99 | 1.30%(+0.231)#330 |
Common Questions
What are the Top 10 Cities with the Highest Percentage of Immigrants from South Eastern Asia in Illinois?
Top 10 Cities with the Highest Percentage of Immigrants from South Eastern Asia in Illinois are:
#1
17.33%
#2
16.27%
#3
9.27%
#4
8.56%
#5
7.78%
#6
7.76%
#7
6.78%
#8
6.74%
#9
6.59%
#10
6.35%
What city has the Highest Percentage of Immigrants from South Eastern Asia in Illinois?
Fidelity has the Highest Percentage of Immigrants from South Eastern Asia in Illinois with 17.33%.
What is the Percentage of Immigrants from South Eastern Asia in the State of Illinois?
Percentage of Immigrants from South Eastern Asia in Illinois is 1.10%.
What is the Percentage of Immigrants from South Eastern Asia in the United States?
Percentage of Immigrants from South Eastern Asia in the United States is 1.30%.