Cities with the Most Immigrants from Vietnam in Illinois
RELATED REPORTS & OPTIONS
Vietnam
Illinois
Compare Cities
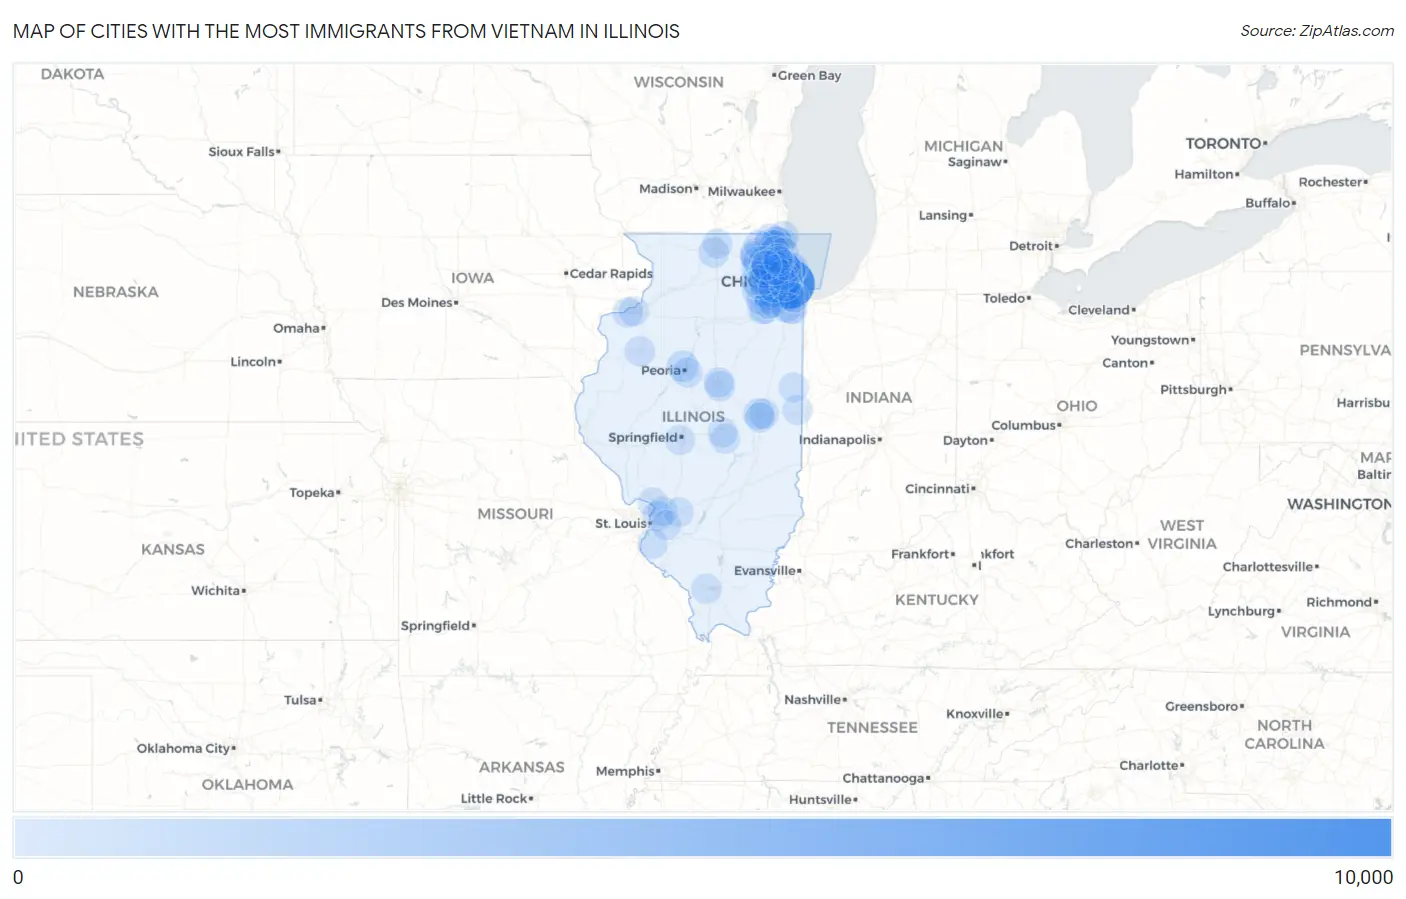
Map of Cities with the Most Immigrants from Vietnam in Illinois
0
10,000
Cities with the Most Immigrants from Vietnam in Illinois
| City | Vietnam | vs State | vs National | |
| 1. | Chicago | 8,325 | 22,269(37.38%)#1 | 1,349,684(0.62%)#19 |
| 2. | Carol Stream | 789 | 22,269(3.54%)#2 | 1,349,684(0.06%)#231 |
| 3. | Glendale Heights | 631 | 22,269(2.83%)#3 | 1,349,684(0.05%)#293 |
| 4. | Skokie | 566 | 22,269(2.54%)#4 | 1,349,684(0.04%)#320 |
| 5. | Peoria | 563 | 22,269(2.53%)#5 | 1,349,684(0.04%)#321 |
| 6. | Morton Grove | 504 | 22,269(2.26%)#6 | 1,349,684(0.04%)#358 |
| 7. | Aurora | 438 | 22,269(1.97%)#7 | 1,349,684(0.03%)#404 |
| 8. | Champaign | 401 | 22,269(1.80%)#8 | 1,349,684(0.03%)#436 |
| 9. | Naperville | 362 | 22,269(1.63%)#9 | 1,349,684(0.03%)#486 |
| 10. | Lincolnwood | 336 | 22,269(1.51%)#10 | 1,349,684(0.02%)#524 |
| 11. | Mount Prospect | 293 | 22,269(1.32%)#11 | 1,349,684(0.02%)#581 |
| 12. | Des Plaines | 266 | 22,269(1.19%)#12 | 1,349,684(0.02%)#635 |
| 13. | Niles | 250 | 22,269(1.12%)#13 | 1,349,684(0.02%)#661 |
| 14. | Evanston | 245 | 22,269(1.10%)#14 | 1,349,684(0.02%)#669 |
| 15. | Shorewood | 224 | 22,269(1.01%)#15 | 1,349,684(0.02%)#723 |
| 16. | Rockford | 222 | 22,269(1.00%)#16 | 1,349,684(0.02%)#726 |
| 17. | Burbank | 210 | 22,269(0.94%)#17 | 1,349,684(0.02%)#759 |
| 18. | Waukegan | 198 | 22,269(0.89%)#18 | 1,349,684(0.01%)#791 |
| 19. | Harwood Heights | 198 | 22,269(0.89%)#19 | 1,349,684(0.01%)#795 |
| 20. | Arlington Heights | 179 | 22,269(0.80%)#20 | 1,349,684(0.01%)#863 |
| 21. | Algonquin | 171 | 22,269(0.77%)#21 | 1,349,684(0.01%)#892 |
| 22. | Wheaton | 145 | 22,269(0.65%)#22 | 1,349,684(0.01%)#1,003 |
| 23. | Berwyn | 141 | 22,269(0.63%)#23 | 1,349,684(0.01%)#1,027 |
| 24. | Round Lake | 140 | 22,269(0.63%)#24 | 1,349,684(0.01%)#1,037 |
| 25. | Bloomington | 132 | 22,269(0.59%)#25 | 1,349,684(0.01%)#1,079 |
| 26. | Schaumburg | 130 | 22,269(0.58%)#26 | 1,349,684(0.01%)#1,092 |
| 27. | Plainfield | 127 | 22,269(0.57%)#27 | 1,349,684(0.01%)#1,111 |
| 28. | East Peoria | 124 | 22,269(0.56%)#28 | 1,349,684(0.01%)#1,128 |
| 29. | Pontoon Beach | 121 | 22,269(0.54%)#29 | 1,349,684(0.01%)#1,155 |
| 30. | Crystal Lake | 120 | 22,269(0.54%)#30 | 1,349,684(0.01%)#1,159 |
| 31. | Gurnee | 120 | 22,269(0.54%)#31 | 1,349,684(0.01%)#1,160 |
| 32. | Elgin | 118 | 22,269(0.53%)#32 | 1,349,684(0.01%)#1,179 |
| 33. | Oak Lawn | 112 | 22,269(0.50%)#33 | 1,349,684(0.01%)#1,219 |
| 34. | Normal | 111 | 22,269(0.50%)#34 | 1,349,684(0.01%)#1,225 |
| 35. | Zion | 111 | 22,269(0.50%)#35 | 1,349,684(0.01%)#1,228 |
| 36. | Lake In The Hills | 110 | 22,269(0.49%)#36 | 1,349,684(0.01%)#1,238 |
| 37. | Hanover Park | 109 | 22,269(0.49%)#37 | 1,349,684(0.01%)#1,248 |
| 38. | Galesburg | 98 | 22,269(0.44%)#38 | 1,349,684(0.01%)#1,339 |
| 39. | Urbana | 97 | 22,269(0.44%)#39 | 1,349,684(0.01%)#1,349 |
| 40. | Arbury Hills | 97 | 22,269(0.44%)#40 | 1,349,684(0.01%)#1,354 |
| 41. | Northlake | 93 | 22,269(0.42%)#41 | 1,349,684(0.01%)#1,382 |
| 42. | Matteson | 92 | 22,269(0.41%)#42 | 1,349,684(0.01%)#1,388 |
| 43. | Lake Villa | 87 | 22,269(0.39%)#43 | 1,349,684(0.01%)#1,434 |
| 44. | Grayslake | 75 | 22,269(0.34%)#44 | 1,349,684(0.01%)#1,566 |
| 45. | Grandwood Park | 73 | 22,269(0.33%)#45 | 1,349,684(0.01%)#1,592 |
| 46. | Rock Island | 70 | 22,269(0.31%)#46 | 1,349,684(0.01%)#1,622 |
| 47. | Carbondale | 68 | 22,269(0.31%)#47 | 1,349,684(0.01%)#1,658 |
| 48. | Mundelein | 67 | 22,269(0.30%)#48 | 1,349,684(0.00%)#1,670 |
| 49. | Alton | 67 | 22,269(0.30%)#49 | 1,349,684(0.00%)#1,672 |
| 50. | Olympia Fields | 67 | 22,269(0.30%)#50 | 1,349,684(0.00%)#1,679 |
| 51. | Romeoville | 66 | 22,269(0.30%)#51 | 1,349,684(0.00%)#1,683 |
| 52. | Springfield | 65 | 22,269(0.29%)#52 | 1,349,684(0.00%)#1,697 |
| 53. | Rolling Meadows | 64 | 22,269(0.29%)#53 | 1,349,684(0.00%)#1,714 |
| 54. | Bensenville | 61 | 22,269(0.27%)#54 | 1,349,684(0.00%)#1,755 |
| 55. | Lake Forest | 60 | 22,269(0.27%)#55 | 1,349,684(0.00%)#1,769 |
| 56. | Alsip | 59 | 22,269(0.26%)#56 | 1,349,684(0.00%)#1,792 |
| 57. | Bolingbrook | 58 | 22,269(0.26%)#57 | 1,349,684(0.00%)#1,802 |
| 58. | Palatine | 58 | 22,269(0.26%)#58 | 1,349,684(0.00%)#1,803 |
| 59. | Carpentersville | 57 | 22,269(0.26%)#59 | 1,349,684(0.00%)#1,821 |
| 60. | Woodridge | 57 | 22,269(0.26%)#60 | 1,349,684(0.00%)#1,823 |
| 61. | Warrenville | 57 | 22,269(0.26%)#61 | 1,349,684(0.00%)#1,832 |
| 62. | Mount Zion | 57 | 22,269(0.26%)#62 | 1,349,684(0.00%)#1,836 |
| 63. | Villa Park | 54 | 22,269(0.24%)#63 | 1,349,684(0.00%)#1,856 |
| 64. | Broadview | 54 | 22,269(0.24%)#64 | 1,349,684(0.00%)#1,868 |
| 65. | Joliet | 53 | 22,269(0.24%)#65 | 1,349,684(0.00%)#1,874 |
| 66. | Machesney Park | 52 | 22,269(0.23%)#66 | 1,349,684(0.00%)#1,898 |
| 67. | Lockport | 50 | 22,269(0.22%)#67 | 1,349,684(0.00%)#1,935 |
| 68. | Eagle Lake | 50 | 22,269(0.22%)#68 | 1,349,684(0.00%)#1,953 |
| 69. | Addison | 48 | 22,269(0.22%)#69 | 1,349,684(0.00%)#1,977 |
| 70. | Crest Hill | 46 | 22,269(0.21%)#70 | 1,349,684(0.00%)#2,013 |
| 71. | Lombard | 45 | 22,269(0.20%)#71 | 1,349,684(0.00%)#2,031 |
| 72. | Bartlett | 45 | 22,269(0.20%)#72 | 1,349,684(0.00%)#2,032 |
| 73. | Bloomingdale | 45 | 22,269(0.20%)#73 | 1,349,684(0.00%)#2,043 |
| 74. | Geneva | 44 | 22,269(0.20%)#74 | 1,349,684(0.00%)#2,071 |
| 75. | Barrington Hills | 44 | 22,269(0.20%)#75 | 1,349,684(0.00%)#2,080 |
| 76. | Decatur | 42 | 22,269(0.19%)#76 | 1,349,684(0.00%)#2,105 |
| 77. | Hoffman Estates | 42 | 22,269(0.19%)#77 | 1,349,684(0.00%)#2,106 |
| 78. | Batavia | 42 | 22,269(0.19%)#78 | 1,349,684(0.00%)#2,112 |
| 79. | Edwardsville | 40 | 22,269(0.18%)#79 | 1,349,684(0.00%)#2,158 |
| 80. | Streamwood | 39 | 22,269(0.18%)#80 | 1,349,684(0.00%)#2,182 |
| 81. | Danville | 39 | 22,269(0.18%)#81 | 1,349,684(0.00%)#2,185 |
| 82. | Savoy | 38 | 22,269(0.17%)#82 | 1,349,684(0.00%)#2,216 |
| 83. | West Chicago | 37 | 22,269(0.17%)#83 | 1,349,684(0.00%)#2,235 |
| 84. | Moline | 36 | 22,269(0.16%)#84 | 1,349,684(0.00%)#2,267 |
| 85. | Waterloo | 35 | 22,269(0.16%)#85 | 1,349,684(0.00%)#2,306 |
| 86. | Highland | 35 | 22,269(0.16%)#86 | 1,349,684(0.00%)#2,307 |
| 87. | Frankfort Square | 35 | 22,269(0.16%)#87 | 1,349,684(0.00%)#2,309 |
| 88. | Hoopeston | 35 | 22,269(0.16%)#88 | 1,349,684(0.00%)#2,316 |
| 89. | Mchenry | 34 | 22,269(0.15%)#89 | 1,349,684(0.00%)#2,332 |
| 90. | O Fallon | 33 | 22,269(0.15%)#90 | 1,349,684(0.00%)#2,362 |
| 91. | Oak Park | 32 | 22,269(0.14%)#91 | 1,349,684(0.00%)#2,394 |
| 92. | Downers Grove | 32 | 22,269(0.14%)#92 | 1,349,684(0.00%)#2,396 |
| 93. | Schiller Park | 31 | 22,269(0.14%)#93 | 1,349,684(0.00%)#2,444 |
| 94. | Lyons | 31 | 22,269(0.14%)#94 | 1,349,684(0.00%)#2,448 |
| 95. | Blue Island | 29 | 22,269(0.13%)#95 | 1,349,684(0.00%)#2,498 |
| 96. | Glenview | 27 | 22,269(0.12%)#96 | 1,349,684(0.00%)#2,564 |
| 97. | Elk Grove Village | 27 | 22,269(0.12%)#97 | 1,349,684(0.00%)#2,569 |
| 98. | Buffalo Grove | 26 | 22,269(0.12%)#98 | 1,349,684(0.00%)#2,595 |
| 99. | Wheeling | 26 | 22,269(0.12%)#99 | 1,349,684(0.00%)#2,597 |
| 100. | South Barrington | 25 | 22,269(0.11%)#100 | 1,349,684(0.00%)#2,678 |
Common Questions
What are the Top 10 Cities with the Most Immigrants from Vietnam in Illinois?
Top 10 Cities with the Most Immigrants from Vietnam in Illinois are:
#1
8,325
#2
789
#3
631
#4
566
#5
563
#6
504
#7
438
#8
401
#9
362
#10
336
What city has the Most Immigrants from Vietnam in Illinois?
Chicago has the Most Immigrants from Vietnam in Illinois with 8,325.
What is the Total Immigrants from Vietnam in the State of Illinois?
Total Immigrants from Vietnam in Illinois is 22,269.
What is the Total Immigrants from Vietnam in the United States?
Total Immigrants from Vietnam in the United States is 1,349,684.