Cities with the Most Immigrants from Colombia in Illinois
RELATED REPORTS & OPTIONS
Colombia
Illinois
Compare Cities
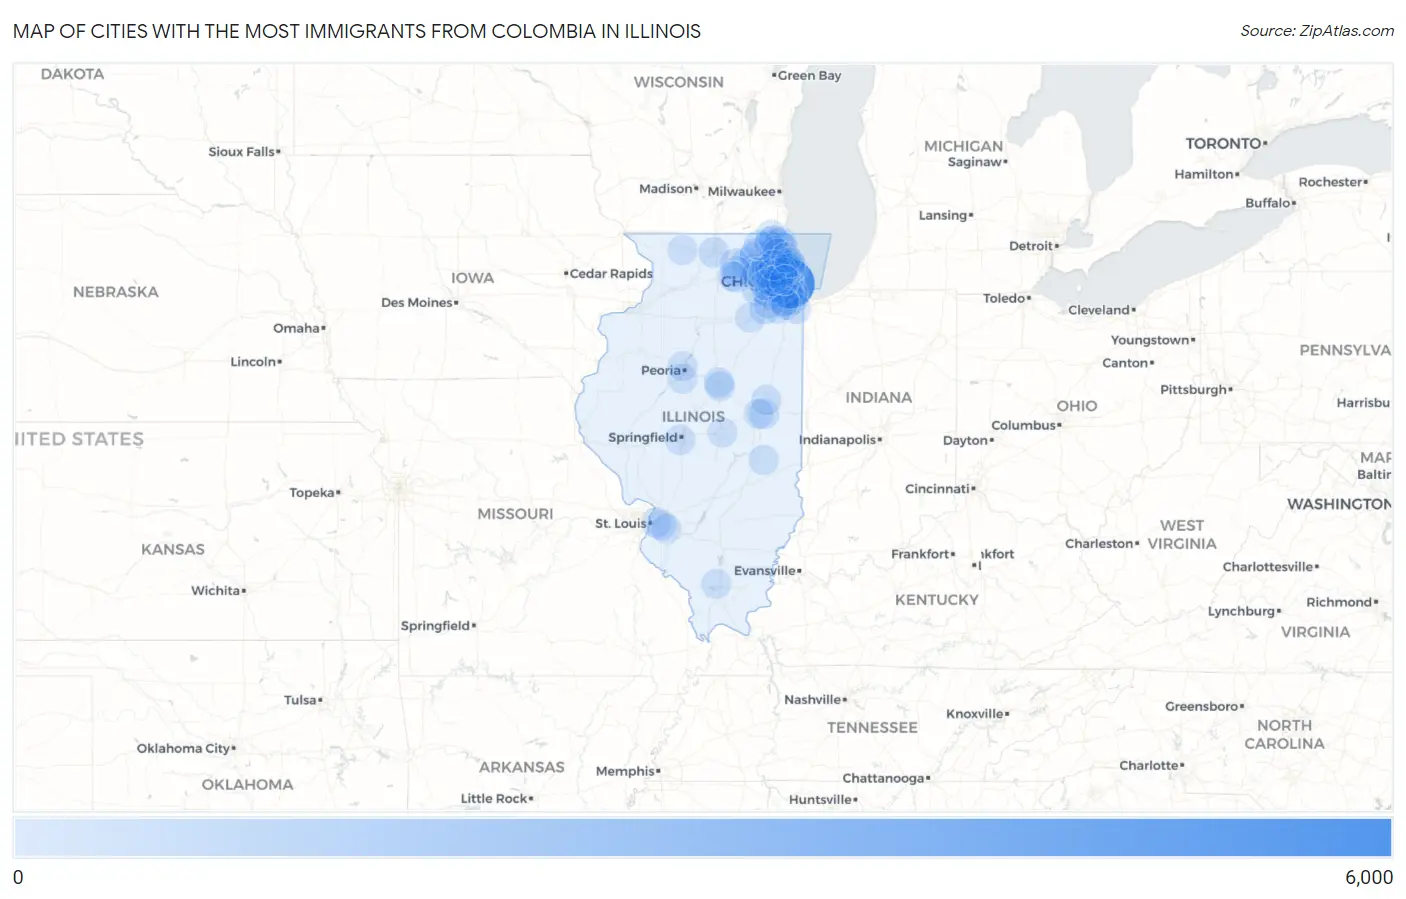
Map of Cities with the Most Immigrants from Colombia in Illinois
0
6,000
Cities with the Most Immigrants from Colombia in Illinois
| City | Colombia | vs State | vs National | |
| 1. | Chicago | 5,945 | 16,553(35.91%)#1 | 860,787(0.69%)#12 |
| 2. | Elgin | 482 | 16,553(2.91%)#2 | 860,787(0.06%)#236 |
| 3. | Carol Stream | 370 | 16,553(2.24%)#3 | 860,787(0.04%)#318 |
| 4. | Cicero | 354 | 16,553(2.14%)#4 | 860,787(0.04%)#335 |
| 5. | Aurora | 321 | 16,553(1.94%)#5 | 860,787(0.04%)#371 |
| 6. | Elmwood Park | 270 | 16,553(1.63%)#6 | 860,787(0.03%)#445 |
| 7. | Joliet | 267 | 16,553(1.61%)#7 | 860,787(0.03%)#450 |
| 8. | Burbank | 263 | 16,553(1.59%)#8 | 860,787(0.03%)#456 |
| 9. | Urbana | 217 | 16,553(1.31%)#9 | 860,787(0.03%)#529 |
| 10. | Waukegan | 203 | 16,553(1.23%)#10 | 860,787(0.02%)#556 |
| 11. | Elk Grove Village | 194 | 16,553(1.17%)#11 | 860,787(0.02%)#580 |
| 12. | River Grove | 188 | 16,553(1.14%)#12 | 860,787(0.02%)#590 |
| 13. | Naperville | 187 | 16,553(1.13%)#13 | 860,787(0.02%)#591 |
| 14. | Berwyn | 167 | 16,553(1.01%)#14 | 860,787(0.02%)#661 |
| 15. | Rockford | 166 | 16,553(1.00%)#15 | 860,787(0.02%)#666 |
| 16. | Des Plaines | 165 | 16,553(1.00%)#16 | 860,787(0.02%)#674 |
| 17. | Crystal Lake | 162 | 16,553(0.98%)#17 | 860,787(0.02%)#682 |
| 18. | Melrose Park | 160 | 16,553(0.97%)#18 | 860,787(0.02%)#688 |
| 19. | Glendale Heights | 157 | 16,553(0.95%)#19 | 860,787(0.02%)#698 |
| 20. | Gurnee | 144 | 16,553(0.87%)#20 | 860,787(0.02%)#750 |
| 21. | Cortland | 142 | 16,553(0.86%)#21 | 860,787(0.02%)#760 |
| 22. | Evanston | 138 | 16,553(0.83%)#22 | 860,787(0.02%)#780 |
| 23. | Buffalo Grove | 138 | 16,553(0.83%)#23 | 860,787(0.02%)#783 |
| 24. | Palatine | 136 | 16,553(0.82%)#24 | 860,787(0.02%)#793 |
| 25. | Hampshire | 136 | 16,553(0.82%)#25 | 860,787(0.02%)#796 |
| 26. | Lake In The Hills | 133 | 16,553(0.80%)#26 | 860,787(0.02%)#811 |
| 27. | Streamwood | 126 | 16,553(0.76%)#27 | 860,787(0.01%)#843 |
| 28. | West Chicago | 126 | 16,553(0.76%)#28 | 860,787(0.01%)#845 |
| 29. | Oak Park | 124 | 16,553(0.75%)#29 | 860,787(0.01%)#852 |
| 30. | Genoa | 121 | 16,553(0.73%)#30 | 860,787(0.01%)#868 |
| 31. | Hoffman Estates | 120 | 16,553(0.72%)#31 | 860,787(0.01%)#871 |
| 32. | Villa Park | 116 | 16,553(0.70%)#32 | 860,787(0.01%)#894 |
| 33. | St Charles | 111 | 16,553(0.67%)#33 | 860,787(0.01%)#933 |
| 34. | Hanover Park | 100 | 16,553(0.60%)#34 | 860,787(0.01%)#1,011 |
| 35. | Springfield | 99 | 16,553(0.60%)#35 | 860,787(0.01%)#1,015 |
| 36. | South Elgin | 95 | 16,553(0.57%)#36 | 860,787(0.01%)#1,049 |
| 37. | Wheaton | 92 | 16,553(0.56%)#37 | 860,787(0.01%)#1,066 |
| 38. | Round Lake Beach | 92 | 16,553(0.56%)#38 | 860,787(0.01%)#1,071 |
| 39. | Schiller Park | 87 | 16,553(0.53%)#39 | 860,787(0.01%)#1,118 |
| 40. | North Chicago | 86 | 16,553(0.52%)#40 | 860,787(0.01%)#1,125 |
| 41. | Rantoul | 83 | 16,553(0.50%)#41 | 860,787(0.01%)#1,159 |
| 42. | Glenview | 82 | 16,553(0.50%)#42 | 860,787(0.01%)#1,163 |
| 43. | Evergreen Park | 81 | 16,553(0.49%)#43 | 860,787(0.01%)#1,171 |
| 44. | Chicago Heights | 74 | 16,553(0.45%)#44 | 860,787(0.01%)#1,249 |
| 45. | Charleston | 69 | 16,553(0.42%)#45 | 860,787(0.01%)#1,308 |
| 46. | Bolingbrook | 68 | 16,553(0.41%)#46 | 860,787(0.01%)#1,318 |
| 47. | Round Lake | 68 | 16,553(0.41%)#47 | 860,787(0.01%)#1,324 |
| 48. | Sycamore | 68 | 16,553(0.41%)#48 | 860,787(0.01%)#1,325 |
| 49. | Hinsdale | 67 | 16,553(0.40%)#49 | 860,787(0.01%)#1,333 |
| 50. | La Grange | 64 | 16,553(0.39%)#50 | 860,787(0.01%)#1,360 |
| 51. | Normal | 63 | 16,553(0.38%)#51 | 860,787(0.01%)#1,366 |
| 52. | Washington Park | 63 | 16,553(0.38%)#52 | 860,787(0.01%)#1,378 |
| 53. | Park Ridge | 61 | 16,553(0.37%)#53 | 860,787(0.01%)#1,399 |
| 54. | Posen | 61 | 16,553(0.37%)#54 | 860,787(0.01%)#1,411 |
| 55. | Wheeling | 60 | 16,553(0.36%)#55 | 860,787(0.01%)#1,424 |
| 56. | Lisle | 59 | 16,553(0.36%)#56 | 860,787(0.01%)#1,442 |
| 57. | Schaumburg | 58 | 16,553(0.35%)#57 | 860,787(0.01%)#1,451 |
| 58. | Maywood | 58 | 16,553(0.35%)#58 | 860,787(0.01%)#1,455 |
| 59. | Addison | 54 | 16,553(0.33%)#59 | 860,787(0.01%)#1,511 |
| 60. | Franklin Park | 54 | 16,553(0.33%)#60 | 860,787(0.01%)#1,516 |
| 61. | Niles | 52 | 16,553(0.31%)#61 | 860,787(0.01%)#1,547 |
| 62. | Champaign | 49 | 16,553(0.30%)#62 | 860,787(0.01%)#1,598 |
| 63. | Wilmette | 48 | 16,553(0.29%)#63 | 860,787(0.01%)#1,628 |
| 64. | Fairview Heights | 48 | 16,553(0.29%)#64 | 860,787(0.01%)#1,631 |
| 65. | Mundelein | 47 | 16,553(0.28%)#65 | 860,787(0.01%)#1,643 |
| 66. | Bartlett | 46 | 16,553(0.28%)#66 | 860,787(0.01%)#1,665 |
| 67. | Skokie | 44 | 16,553(0.27%)#67 | 860,787(0.01%)#1,710 |
| 68. | Pekin | 43 | 16,553(0.26%)#68 | 860,787(0.00%)#1,741 |
| 69. | Bensenville | 42 | 16,553(0.25%)#69 | 860,787(0.00%)#1,762 |
| 70. | Lombard | 41 | 16,553(0.25%)#70 | 860,787(0.00%)#1,775 |
| 71. | Antioch | 39 | 16,553(0.24%)#71 | 860,787(0.00%)#1,821 |
| 72. | Orland Hills | 39 | 16,553(0.24%)#72 | 860,787(0.00%)#1,828 |
| 73. | Dekalb | 38 | 16,553(0.23%)#73 | 860,787(0.00%)#1,840 |
| 74. | Freeport | 37 | 16,553(0.22%)#74 | 860,787(0.00%)#1,871 |
| 75. | Mchenry | 36 | 16,553(0.22%)#75 | 860,787(0.00%)#1,907 |
| 76. | Bloomingdale | 36 | 16,553(0.22%)#76 | 860,787(0.00%)#1,910 |
| 77. | Decatur | 34 | 16,553(0.21%)#77 | 860,787(0.00%)#1,973 |
| 78. | Downers Grove | 34 | 16,553(0.21%)#78 | 860,787(0.00%)#1,975 |
| 79. | New Lenox | 34 | 16,553(0.21%)#79 | 860,787(0.00%)#1,981 |
| 80. | Oakbrook Terrace | 34 | 16,553(0.21%)#80 | 860,787(0.00%)#1,998 |
| 81. | Bloomington | 33 | 16,553(0.20%)#81 | 860,787(0.00%)#2,009 |
| 82. | Peoria | 32 | 16,553(0.19%)#82 | 860,787(0.00%)#2,044 |
| 83. | Vernon Hills | 32 | 16,553(0.19%)#83 | 860,787(0.00%)#2,049 |
| 84. | Morris | 32 | 16,553(0.19%)#84 | 860,787(0.00%)#2,056 |
| 85. | Herrin | 32 | 16,553(0.19%)#85 | 860,787(0.00%)#2,058 |
| 86. | Indian Head Park | 31 | 16,553(0.19%)#86 | 860,787(0.00%)#2,100 |
| 87. | Oak Lawn | 30 | 16,553(0.18%)#87 | 860,787(0.00%)#2,108 |
| 88. | Rosemont | 30 | 16,553(0.18%)#88 | 860,787(0.00%)#2,141 |
| 89. | Orland Park | 29 | 16,553(0.18%)#89 | 860,787(0.00%)#2,155 |
| 90. | Crest Hill | 29 | 16,553(0.18%)#90 | 860,787(0.00%)#2,168 |
| 91. | Lindenhurst | 28 | 16,553(0.17%)#91 | 860,787(0.00%)#2,208 |
| 92. | Warrenville | 26 | 16,553(0.16%)#92 | 860,787(0.00%)#2,279 |
| 93. | Tinley Park | 24 | 16,553(0.14%)#93 | 860,787(0.00%)#2,332 |
| 94. | Elmhurst | 24 | 16,553(0.14%)#94 | 860,787(0.00%)#2,333 |
| 95. | Glen Ellyn | 24 | 16,553(0.14%)#95 | 860,787(0.00%)#2,343 |
| 96. | Rolling Meadows | 24 | 16,553(0.14%)#96 | 860,787(0.00%)#2,345 |
| 97. | Highland Park | 22 | 16,553(0.13%)#97 | 860,787(0.00%)#2,432 |
| 98. | Shiloh | 22 | 16,553(0.13%)#98 | 860,787(0.00%)#2,441 |
| 99. | Winnetka | 21 | 16,553(0.13%)#99 | 860,787(0.00%)#2,494 |
| 100. | River Forest | 21 | 16,553(0.13%)#100 | 860,787(0.00%)#2,495 |
Common Questions
What are the Top 10 Cities with the Most Immigrants from Colombia in Illinois?
Top 10 Cities with the Most Immigrants from Colombia in Illinois are:
#1
5,945
#2
482
#3
370
#4
354
#5
321
#6
270
#7
267
#8
263
#9
217
#10
203
What city has the Most Immigrants from Colombia in Illinois?
Chicago has the Most Immigrants from Colombia in Illinois with 5,945.
What is the Total Immigrants from Colombia in the State of Illinois?
Total Immigrants from Colombia in Illinois is 16,553.
What is the Total Immigrants from Colombia in the United States?
Total Immigrants from Colombia in the United States is 860,787.