Cities with the Most Immigrants from Oceania in Illinois
RELATED REPORTS & OPTIONS
Oceania
Illinois
Compare Cities
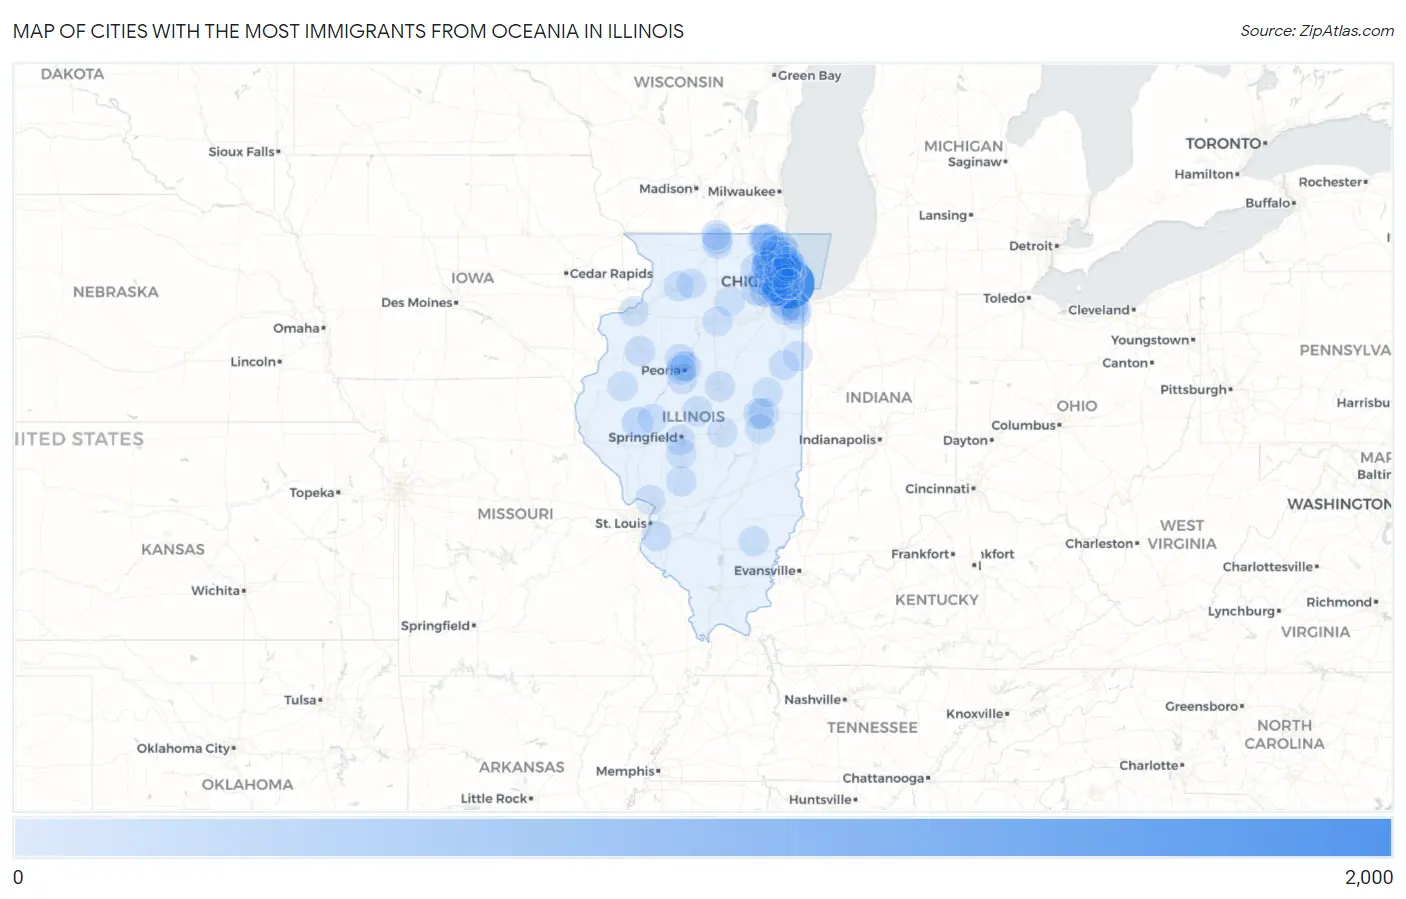
Map of Cities with the Most Immigrants from Oceania in Illinois
0
2,000
Cities with the Most Immigrants from Oceania in Illinois
| City | Oceania | vs State | vs National | |
| 1. | Chicago | 1,517 | 4,079(37.19%)#1 | 293,459(0.52%)#21 |
| 2. | Naperville | 167 | 4,079(4.09%)#2 | 293,459(0.06%)#291 |
| 3. | Fox Lake Hills | 152 | 4,079(3.73%)#3 | 293,459(0.05%)#329 |
| 4. | Aurora | 133 | 4,079(3.26%)#4 | 293,459(0.05%)#372 |
| 5. | Lake Forest | 98 | 4,079(2.40%)#5 | 293,459(0.03%)#489 |
| 6. | Beardstown | 96 | 4,079(2.35%)#6 | 293,459(0.03%)#501 |
| 7. | Evanston | 69 | 4,079(1.69%)#7 | 293,459(0.02%)#638 |
| 8. | Grayslake | 67 | 4,079(1.64%)#8 | 293,459(0.02%)#657 |
| 9. | Tinley Park | 52 | 4,079(1.27%)#9 | 293,459(0.02%)#804 |
| 10. | Urbana | 47 | 4,079(1.15%)#10 | 293,459(0.02%)#858 |
| 11. | Elgin | 46 | 4,079(1.13%)#11 | 293,459(0.02%)#866 |
| 12. | Niles | 46 | 4,079(1.13%)#12 | 293,459(0.02%)#873 |
| 13. | Lincolnwood | 44 | 4,079(1.08%)#13 | 293,459(0.01%)#898 |
| 14. | Champaign | 42 | 4,079(1.03%)#14 | 293,459(0.01%)#930 |
| 15. | Palatine | 41 | 4,079(1.01%)#15 | 293,459(0.01%)#950 |
| 16. | Peoria | 36 | 4,079(0.88%)#16 | 293,459(0.01%)#1,036 |
| 17. | Libertyville | 33 | 4,079(0.81%)#17 | 293,459(0.01%)#1,109 |
| 18. | Schaumburg | 32 | 4,079(0.78%)#18 | 293,459(0.01%)#1,128 |
| 19. | Hinsdale | 32 | 4,079(0.78%)#19 | 293,459(0.01%)#1,140 |
| 20. | Addison | 31 | 4,079(0.76%)#20 | 293,459(0.01%)#1,155 |
| 21. | Pekin | 31 | 4,079(0.76%)#21 | 293,459(0.01%)#1,156 |
| 22. | Roscoe | 31 | 4,079(0.76%)#22 | 293,459(0.01%)#1,163 |
| 23. | Wilmette | 30 | 4,079(0.74%)#23 | 293,459(0.01%)#1,181 |
| 24. | Litchfield | 30 | 4,079(0.74%)#24 | 293,459(0.01%)#1,193 |
| 25. | Inverness | 29 | 4,079(0.71%)#25 | 293,459(0.01%)#1,220 |
| 26. | Arlington Heights | 28 | 4,079(0.69%)#26 | 293,459(0.01%)#1,229 |
| 27. | Wheaton | 28 | 4,079(0.69%)#27 | 293,459(0.01%)#1,232 |
| 28. | Carol Stream | 28 | 4,079(0.69%)#28 | 293,459(0.01%)#1,235 |
| 29. | Machesney Park | 28 | 4,079(0.69%)#29 | 293,459(0.01%)#1,241 |
| 30. | Glenview | 26 | 4,079(0.64%)#30 | 293,459(0.01%)#1,295 |
| 31. | Westmont | 24 | 4,079(0.59%)#31 | 293,459(0.01%)#1,360 |
| 32. | South Barrington | 24 | 4,079(0.59%)#32 | 293,459(0.01%)#1,374 |
| 33. | Galesburg | 22 | 4,079(0.54%)#33 | 293,459(0.01%)#1,433 |
| 34. | Riverside | 22 | 4,079(0.54%)#34 | 293,459(0.01%)#1,450 |
| 35. | Northfield | 22 | 4,079(0.54%)#35 | 293,459(0.01%)#1,455 |
| 36. | Springfield | 21 | 4,079(0.51%)#36 | 293,459(0.01%)#1,463 |
| 37. | Northbrook | 21 | 4,079(0.51%)#37 | 293,459(0.01%)#1,466 |
| 38. | River Forest | 20 | 4,079(0.49%)#38 | 293,459(0.01%)#1,537 |
| 39. | West Chicago | 19 | 4,079(0.47%)#39 | 293,459(0.01%)#1,573 |
| 40. | Palos Hills | 19 | 4,079(0.47%)#40 | 293,459(0.01%)#1,577 |
| 41. | Lombard | 18 | 4,079(0.44%)#41 | 293,459(0.01%)#1,618 |
| 42. | Chicago Heights | 18 | 4,079(0.44%)#42 | 293,459(0.01%)#1,621 |
| 43. | Lincoln | 18 | 4,079(0.44%)#43 | 293,459(0.01%)#1,638 |
| 44. | Barrington | 18 | 4,079(0.44%)#44 | 293,459(0.01%)#1,641 |
| 45. | Peoria Heights | 17 | 4,079(0.42%)#45 | 293,459(0.01%)#1,698 |
| 46. | Millstadt | 17 | 4,079(0.42%)#46 | 293,459(0.01%)#1,703 |
| 47. | Mount Prospect | 16 | 4,079(0.39%)#47 | 293,459(0.01%)#1,725 |
| 48. | North Chicago | 16 | 4,079(0.39%)#48 | 293,459(0.01%)#1,731 |
| 49. | Fox Lake | 16 | 4,079(0.39%)#49 | 293,459(0.01%)#1,752 |
| 50. | Homewood | 15 | 4,079(0.37%)#50 | 293,459(0.01%)#1,800 |
| 51. | Norridge | 15 | 4,079(0.37%)#51 | 293,459(0.01%)#1,807 |
| 52. | Sterling | 14 | 4,079(0.34%)#52 | 293,459(0.00%)#1,880 |
| 53. | Fairfield | 14 | 4,079(0.34%)#53 | 293,459(0.00%)#1,899 |
| 54. | Bloomington | 13 | 4,079(0.32%)#54 | 293,459(0.00%)#1,924 |
| 55. | Clarendon Hills | 13 | 4,079(0.32%)#55 | 293,459(0.00%)#1,961 |
| 56. | Long Grove | 13 | 4,079(0.32%)#56 | 293,459(0.00%)#1,962 |
| 57. | Orland Park | 12 | 4,079(0.29%)#57 | 293,459(0.00%)#2,007 |
| 58. | Downers Grove | 12 | 4,079(0.29%)#58 | 293,459(0.00%)#2,008 |
| 59. | Frankfort | 11 | 4,079(0.27%)#59 | 293,459(0.00%)#2,124 |
| 60. | Bannockburn | 11 | 4,079(0.27%)#60 | 293,459(0.00%)#2,175 |
| 61. | Elmhurst | 10 | 4,079(0.25%)#61 | 293,459(0.00%)#2,188 |
| 62. | Dunlap | 10 | 4,079(0.25%)#62 | 293,459(0.00%)#2,260 |
| 63. | Skokie | 9 | 4,079(0.22%)#63 | 293,459(0.00%)#2,271 |
| 64. | Moline | 9 | 4,079(0.22%)#64 | 293,459(0.00%)#2,277 |
| 65. | Godfrey | 9 | 4,079(0.22%)#65 | 293,459(0.00%)#2,299 |
| 66. | Lake Barrington | 9 | 4,079(0.22%)#66 | 293,459(0.00%)#2,335 |
| 67. | Des Plaines | 8 | 4,079(0.20%)#67 | 293,459(0.00%)#2,382 |
| 68. | Mundelein | 8 | 4,079(0.20%)#68 | 293,459(0.00%)#2,393 |
| 69. | Maywood | 8 | 4,079(0.20%)#69 | 293,459(0.00%)#2,400 |
| 70. | Pistakee Highlands | 8 | 4,079(0.20%)#70 | 293,459(0.00%)#2,446 |
| 71. | Cicero | 7 | 4,079(0.17%)#71 | 293,459(0.00%)#2,480 |
| 72. | Hoffman Estates | 7 | 4,079(0.17%)#72 | 293,459(0.00%)#2,486 |
| 73. | Woodridge | 7 | 4,079(0.17%)#73 | 293,459(0.00%)#2,497 |
| 74. | Darien | 7 | 4,079(0.17%)#74 | 293,459(0.00%)#2,506 |
| 75. | South Beloit | 7 | 4,079(0.17%)#75 | 293,459(0.00%)#2,536 |
| 76. | Decatur | 6 | 4,079(0.15%)#76 | 293,459(0.00%)#2,593 |
| 77. | Macomb | 6 | 4,079(0.15%)#77 | 293,459(0.00%)#2,620 |
| 78. | Edgington | 6 | 4,079(0.15%)#78 | 293,459(0.00%)#2,704 |
| 79. | Morton Grove | 5 | 4,079(0.12%)#79 | 293,459(0.00%)#2,725 |
| 80. | Rosemont | 5 | 4,079(0.12%)#80 | 293,459(0.00%)#2,757 |
| 81. | Chandlerville | 5 | 4,079(0.12%)#81 | 293,459(0.00%)#2,800 |
| 82. | Bensenville | 4 | 4,079(0.10%)#82 | 293,459(0.00%)#2,831 |
| 83. | Dixon | 4 | 4,079(0.10%)#83 | 293,459(0.00%)#2,834 |
| 84. | Crete | 4 | 4,079(0.10%)#84 | 293,459(0.00%)#2,846 |
| 85. | Divernon | 4 | 4,079(0.10%)#85 | 293,459(0.00%)#2,881 |
| 86. | Leland | 4 | 4,079(0.10%)#86 | 293,459(0.00%)#2,883 |
| 87. | North Utica | 4 | 4,079(0.10%)#87 | 293,459(0.00%)#2,884 |
| 88. | Golf | 4 | 4,079(0.10%)#88 | 293,459(0.00%)#2,904 |
| 89. | Glencoe | 3 | 4,079(0.07%)#89 | 293,459(0.00%)#2,934 |
| 90. | Crescent City | 3 | 4,079(0.07%)#90 | 293,459(0.00%)#3,000 |
| 91. | Donovan | 2 | 4,079(0.05%)#91 | 293,459(0.00%)#3,110 |
| 92. | Berwyn | 1 | 4,079(0.02%)#92 | 293,459(0.00%)#3,129 |
| 93. | West Peoria | 1 | 4,079(0.02%)#93 | 293,459(0.00%)#3,146 |
| 94. | Pesotum | 1 | 4,079(0.02%)#94 | 293,459(0.00%)#3,172 |
| 95. | Ludlow | 1 | 4,079(0.02%)#95 | 293,459(0.00%)#3,188 |
Common Questions
What are the Top 10 Cities with the Most Immigrants from Oceania in Illinois?
Top 10 Cities with the Most Immigrants from Oceania in Illinois are:
#1
1,517
#2
167
#3
152
#4
133
#5
98
#6
96
#7
69
#8
67
#9
52
#10
47
What city has the Most Immigrants from Oceania in Illinois?
Chicago has the Most Immigrants from Oceania in Illinois with 1,517.
What is the Total Immigrants from Oceania in the State of Illinois?
Total Immigrants from Oceania in Illinois is 4,079.
What is the Total Immigrants from Oceania in the United States?
Total Immigrants from Oceania in the United States is 293,459.