Cities with the Highest Percentage of Immigrants from Nigeria in Illinois
RELATED REPORTS & OPTIONS
Nigeria
Illinois
Compare Cities
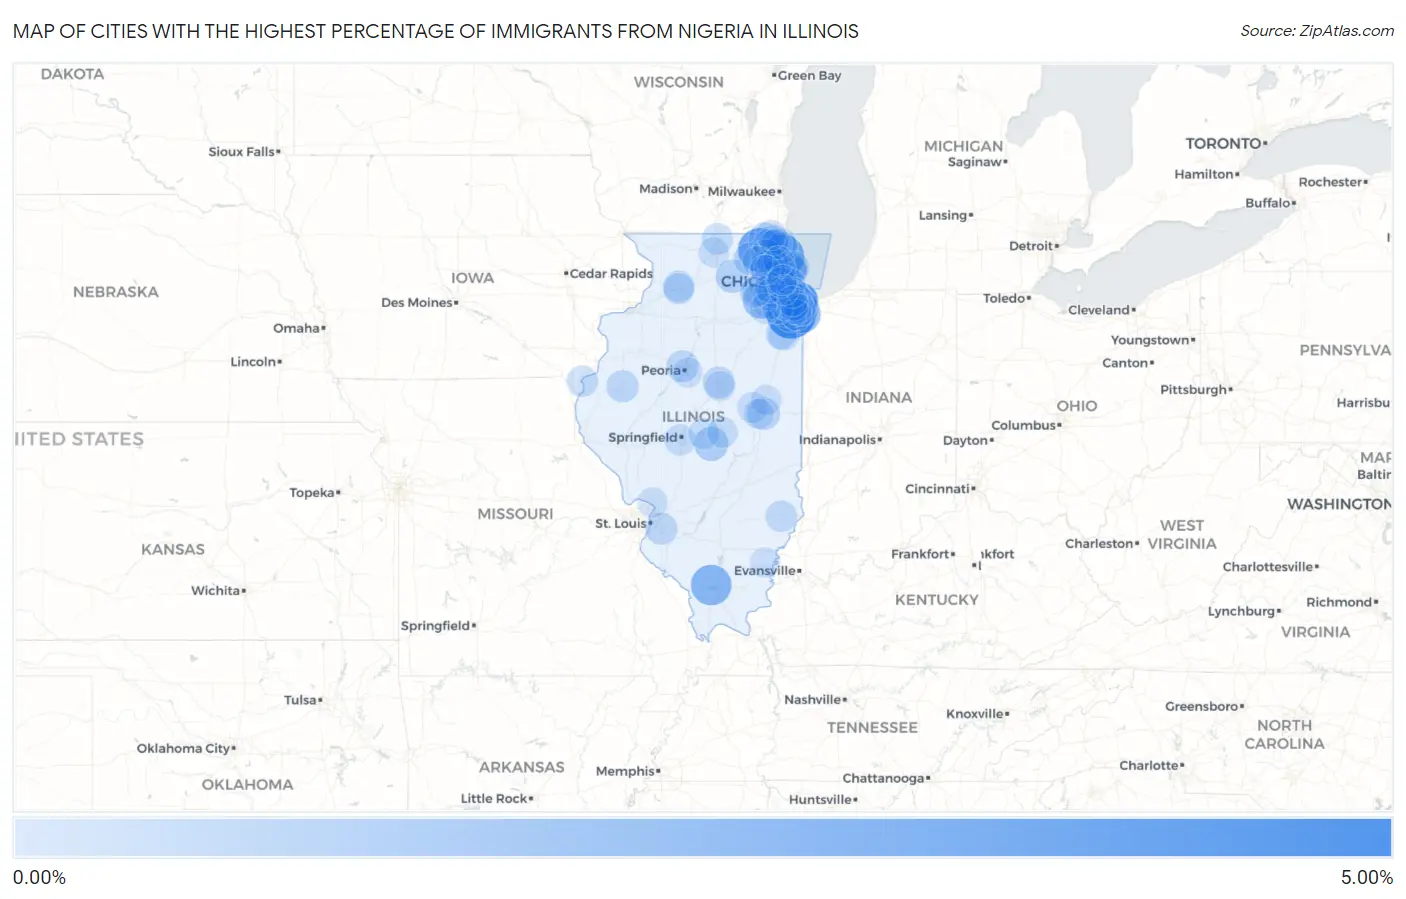
Map of Cities with the Highest Percentage of Immigrants from Nigeria in Illinois
0.00%
5.00%
Cities with the Highest Percentage of Immigrants from Nigeria in Illinois
| City | Nigeria | vs State | vs National | |
| 1. | University Park | 4.35% | 0.17%(+4.19)#-1 | 0.13%(+4.23)#0 |
| 2. | Prairie Grove | 3.10% | 0.17%(+2.94)#11 | 0.13%(+2.98)#515 |
| 3. | Bannockburn | 3.00% | 0.17%(+2.84)#12 | 0.13%(+2.88)#516 |
| 4. | Cambria | 2.36% | 0.17%(+2.19)#13 | 0.13%(+2.23)#517 |
| 5. | Berkeley | 2.25% | 0.17%(+2.09)#14 | 0.13%(+2.13)#518 |
| 6. | South Holland | 2.11% | 0.17%(+1.94)#15 | 0.13%(+1.98)#519 |
| 7. | Willowbrook | 1.97% | 0.17%(+1.80)#16 | 0.13%(+1.84)#520 |
| 8. | Lynwood | 1.67% | 0.17%(+1.51)#17 | 0.13%(+1.55)#521 |
| 9. | Plainfield | 1.63% | 0.17%(+1.47)#18 | 0.13%(+1.51)#522 |
| 10. | Posen | 1.47% | 0.17%(+1.30)#19 | 0.13%(+1.34)#523 |
| 11. | Calumet City | 1.43% | 0.17%(+1.26)#20 | 0.13%(+1.31)#524 |
| 12. | Broadview | 0.99% | 0.17%(+0.827)#21 | 0.13%(+0.867)#525 |
| 13. | Lansing | 0.99% | 0.17%(+0.827)#22 | 0.13%(+0.867)#526 |
| 14. | Blue Mound | 0.96% | 0.17%(+0.798)#23 | 0.13%(+0.838)#527 |
| 15. | Country Club Hills | 0.93% | 0.17%(+0.769)#24 | 0.13%(+0.809)#528 |
| 16. | Richton Park | 0.91% | 0.17%(+0.746)#25 | 0.13%(+0.786)#529 |
| 17. | Lincolnwood | 0.90% | 0.17%(+0.738)#26 | 0.13%(+0.779)#530 |
| 18. | Frankfort | 0.81% | 0.17%(+0.648)#27 | 0.13%(+0.689)#531 |
| 19. | Matteson | 0.79% | 0.17%(+0.622)#28 | 0.13%(+0.663)#532 |
| 20. | Dekalb | 0.77% | 0.17%(+0.603)#29 | 0.13%(+0.643)#1,182 |
| 21. | Skokie | 0.76% | 0.17%(+0.594)#30 | 0.13%(+0.635)#1,183 |
| 22. | Evanston | 0.72% | 0.17%(+0.558)#40 | 0.13%(+0.599)#1,397 |
| 23. | Burnham | 0.67% | 0.17%(+0.504)#41 | 0.13%(+0.545)#1,398 |
| 24. | Worth | 0.64% | 0.17%(+0.479)#42 | 0.13%(+0.519)#1,399 |
| 25. | Hazel Crest | 0.62% | 0.17%(+0.453)#43 | 0.13%(+0.493)#1,400 |
| 26. | Urbana | 0.60% | 0.17%(+0.430)#44 | 0.13%(+0.470)#1,401 |
| 27. | Huntley | 0.59% | 0.17%(+0.427)#45 | 0.13%(+0.467)#1,402 |
| 28. | Fox Lake | 0.56% | 0.17%(+0.399)#46 | 0.13%(+0.439)#1,403 |
| 29. | Alsip | 0.55% | 0.17%(+0.380)#47 | 0.13%(+0.420)#1,404 |
| 30. | Hoffman Estates | 0.54% | 0.17%(+0.379)#48 | 0.13%(+0.419)#1,405 |
| 31. | Riverdale | 0.52% | 0.17%(+0.356)#49 | 0.13%(+0.397)#1,406 |
| 32. | Macomb | 0.47% | 0.17%(+0.307)#50 | 0.13%(+0.348)#1,407 |
| 33. | Thornton | 0.46% | 0.17%(+0.295)#51 | 0.13%(+0.335)#1,408 |
| 34. | Peoria | 0.45% | 0.17%(+0.287)#52 | 0.13%(+0.327)#1,409 |
| 35. | Normal | 0.43% | 0.17%(+0.267)#53 | 0.13%(+0.307)#1,410 |
| 36. | Swansea | 0.43% | 0.17%(+0.264)#54 | 0.13%(+0.304)#1,411 |
| 37. | Calumet Park | 0.40% | 0.17%(+0.237)#55 | 0.13%(+0.277)#1,412 |
| 38. | Dolton | 0.40% | 0.17%(+0.233)#56 | 0.13%(+0.274)#1,413 |
| 39. | Park Forest | 0.39% | 0.17%(+0.228)#57 | 0.13%(+0.269)#1,414 |
| 40. | Sumner | 0.37% | 0.17%(+0.207)#58 | 0.13%(+0.248)#1,415 |
| 41. | Glenwood | 0.35% | 0.17%(+0.185)#59 | 0.13%(+0.225)#1,416 |
| 42. | Nauvoo | 0.35% | 0.17%(+0.182)#60 | 0.13%(+0.223)#1,417 |
| 43. | Round Lake | 0.34% | 0.17%(+0.177)#61 | 0.13%(+0.217)#1,418 |
| 44. | Oak Forest | 0.33% | 0.17%(+0.165)#62 | 0.13%(+0.205)#1,419 |
| 45. | Chicago | 0.33% | 0.17%(+0.165)#63 | 0.13%(+0.205)#1,733 |
| 46. | Sterling | 0.33% | 0.17%(+0.164)#64 | 0.13%(+0.204)#1,734 |
| 47. | Oak Lawn | 0.32% | 0.17%(+0.150)#65 | 0.13%(+0.190)#1,735 |
| 48. | Rolling Meadows | 0.31% | 0.17%(+0.142)#66 | 0.13%(+0.182)#1,736 |
| 49. | Bradley | 0.30% | 0.17%(+0.133)#67 | 0.13%(+0.173)#1,737 |
| 50. | Warrenville | 0.29% | 0.17%(+0.128)#68 | 0.13%(+0.168)#1,738 |
| 51. | Roscoe | 0.29% | 0.17%(+0.121)#69 | 0.13%(+0.162)#1,739 |
| 52. | Springfield | 0.28% | 0.17%(+0.118)#70 | 0.13%(+0.159)#1,740 |
| 53. | Bourbonnais | 0.28% | 0.17%(+0.115)#71 | 0.13%(+0.156)#1,741 |
| 54. | Rock Falls | 0.28% | 0.17%(+0.115)#72 | 0.13%(+0.155)#1,742 |
| 55. | Aurora | 0.27% | 0.17%(+0.102)#73 | 0.13%(+0.142)#1,743 |
| 56. | Crest Hill | 0.27% | 0.17%(+0.100)#74 | 0.13%(+0.141)#1,744 |
| 57. | Monee | 0.25% | 0.17%(+0.088)#75 | 0.13%(+0.128)#1,745 |
| 58. | Park City | 0.25% | 0.17%(+0.081)#76 | 0.13%(+0.121)#1,746 |
| 59. | Illiopolis | 0.24% | 0.17%(+0.077)#77 | 0.13%(+0.118)#1,747 |
| 60. | North Chicago | 0.24% | 0.17%(+0.070)#78 | 0.13%(+0.111)#1,748 |
| 61. | Des Plaines | 0.23% | 0.17%(+0.069)#79 | 0.13%(+0.109)#1,968 |
| 62. | Bolingbrook | 0.23% | 0.17%(+0.060)#80 | 0.13%(+0.101)#1,969 |
| 63. | Grayslake | 0.23% | 0.17%(+0.060)#81 | 0.13%(+0.100)#1,970 |
| 64. | Tinley Park | 0.22% | 0.17%(+0.059)#82 | 0.13%(+0.099)#1,971 |
| 65. | Olympia Fields | 0.22% | 0.17%(+0.057)#83 | 0.13%(+0.098)#1,972 |
| 66. | Lake Barrington | 0.20% | 0.17%(+0.039)#84 | 0.13%(+0.079)#1,973 |
| 67. | Hinsdale | 0.20% | 0.17%(+0.038)#85 | 0.13%(+0.078)#1,974 |
| 68. | Decatur | 0.20% | 0.17%(+0.034)#86 | 0.13%(+0.074)#1,975 |
| 69. | Mahomet | 0.20% | 0.17%(+0.033)#87 | 0.13%(+0.073)#1,976 |
| 70. | Homewood | 0.19% | 0.17%(+0.020)#88 | 0.13%(+0.060)#1,977 |
| 71. | Palatine | 0.18% | 0.17%(+0.018)#89 | 0.13%(+0.059)#1,978 |
| 72. | Flossmoor | 0.18% | 0.17%(+0.015)#90 | 0.13%(+0.055)#1,979 |
| 73. | Sauk Village | 0.17% | 0.17%(+0.006)#91 | 0.13%(+0.047)#1,980 |
| 74. | Chicago Heights | 0.17% | 0.17%(+0.006)#92 | 0.13%(+0.046)#1,981 |
| 75. | Arlington Heights | 0.17% | 0.17%(+0.005)#93 | 0.13%(+0.045)#1,982 |
| 76. | Rantoul | 0.17% | 0.17%(+0.001)#94 | 0.13%(+0.042)#1,983 |
| 77. | Crete | 0.17% | 0.17%(+0.000)#95 | 0.13%(+0.040)#1,984 |
| 78. | Schaumburg | 0.16% | 0.17%(-0.005)#96 | 0.13%(+0.035)#1,985 |
| 79. | Lindenhurst | 0.16% | 0.17%(-0.006)#97 | 0.13%(+0.034)#1,986 |
| 80. | Woodridge | 0.16% | 0.17%(-0.007)#98 | 0.13%(+0.033)#1,987 |
| 81. | Gages Lake | 0.16% | 0.17%(-0.010)#99 | 0.13%(+0.030)#1,988 |
| 82. | Joliet | 0.16% | 0.17%(-0.010)#100 | 0.13%(+0.030)#1,989 |
| 83. | Lisle | 0.15% | 0.17%(-0.017)#101 | 0.13%(+0.023)#1,990 |
| 84. | Evergreen Park | 0.15% | 0.17%(-0.019)#102 | 0.13%(+0.021)#1,991 |
| 85. | Champaign | 0.14% | 0.17%(-0.030)#103 | 0.13%(+0.011)#1,992 |
| 86. | Alton | 0.14% | 0.17%(-0.030)#104 | 0.13%(+0.011)#1,993 |
| 87. | Rockford | 0.13% | 0.17%(-0.031)#105 | 0.13%(+0.009)#1,994 |
| 88. | New Lenox | 0.11% | 0.17%(-0.052)#106 | 0.13%(-0.012)#1,995 |
| 89. | Montgomery | 0.11% | 0.17%(-0.055)#107 | 0.13%(-0.014)#1,996 |
| 90. | Westchester | 0.11% | 0.17%(-0.058)#108 | 0.13%(-0.018)#1,997 |
| 91. | Justice | 0.10% | 0.17%(-0.062)#109 | 0.13%(-0.022)#1,998 |
| 92. | Carmi | 0.099% | 0.17%(-0.067)#110 | 0.13%(-0.027)#1,999 |
| 93. | East Peoria | 0.098% | 0.17%(-0.069)#111 | 0.13%(-0.028)#2,000 |
| 94. | Antioch | 0.095% | 0.17%(-0.071)#112 | 0.13%(-0.031)#2,001 |
| 95. | Bloomington | 0.091% | 0.17%(-0.075)#113 | 0.13%(-0.034)#2,002 |
| 96. | Wheeling | 0.090% | 0.17%(-0.076)#114 | 0.13%(-0.036)#2,003 |
| 97. | Carpentersville | 0.090% | 0.17%(-0.076)#115 | 0.13%(-0.036)#2,004 |
| 98. | Markham | 0.086% | 0.17%(-0.080)#116 | 0.13%(-0.040)#2,005 |
| 99. | Streamwood | 0.081% | 0.17%(-0.085)#117 | 0.13%(-0.045)#2,006 |
| 100. | Bellwood | 0.081% | 0.17%(-0.085)#118 | 0.13%(-0.045)#2,007 |
Common Questions
What are the Top 10 Cities with the Highest Percentage of Immigrants from Nigeria in Illinois?
Top 10 Cities with the Highest Percentage of Immigrants from Nigeria in Illinois are:
#1
4.35%
#2
3.10%
#3
3.00%
#4
2.36%
#5
2.25%
#6
2.11%
#7
1.97%
#8
1.67%
#9
1.63%
#10
1.47%
What city has the Highest Percentage of Immigrants from Nigeria in Illinois?
University Park has the Highest Percentage of Immigrants from Nigeria in Illinois with 4.35%.
What is the Percentage of Immigrants from Nigeria in the State of Illinois?
Percentage of Immigrants from Nigeria in Illinois is 0.17%.
What is the Percentage of Immigrants from Nigeria in the United States?
Percentage of Immigrants from Nigeria in the United States is 0.13%.