Cities with the Highest Male Poverty Level in Illinois
RELATED REPORTS & OPTIONS
Highest Poverty | Male
Illinois
Compare Cities
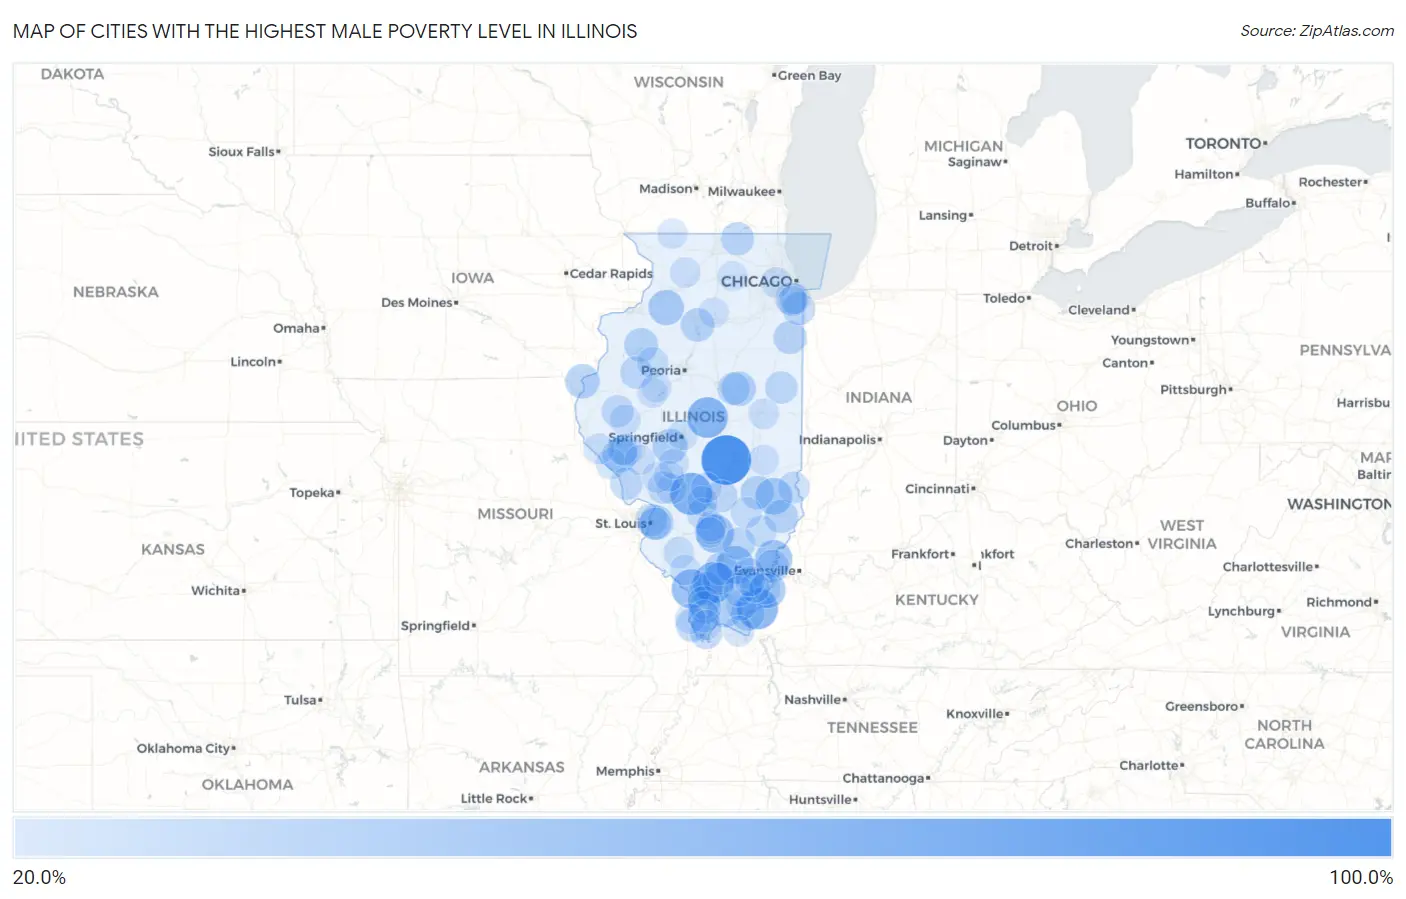
Map of Cities with the Highest Male Poverty Level in Illinois
0.0%
100.0%
Cities with the Highest Male Poverty Level in Illinois
| City | Male Poverty | vs State | vs National | |
| 1. | Alden | 100.0% | 10.6%(+89.4)#1 | 11.3%(+88.7)#20 |
| 2. | Westervelt | 100.0% | 10.6%(+89.4)#2 | 11.3%(+88.7)#84 |
| 3. | Janesville | 78.9% | 10.6%(+68.4)#3 | 11.3%(+67.6)#206 |
| 4. | Ophiem | 76.8% | 10.6%(+66.2)#4 | 11.3%(+65.5)#224 |
| 5. | Dewey | 73.3% | 10.6%(+62.7)#5 | 11.3%(+62.0)#264 |
| 6. | Donnellson | 70.2% | 10.6%(+59.6)#6 | 11.3%(+58.9)#312 |
| 7. | Harding | 70.0% | 10.6%(+59.4)#7 | 11.3%(+58.7)#316 |
| 8. | Elizabethtown | 66.1% | 10.6%(+55.6)#8 | 11.3%(+54.8)#368 |
| 9. | Colp | 65.3% | 10.6%(+54.7)#9 | 11.3%(+54.0)#381 |
| 10. | Chestnut | 64.7% | 10.6%(+54.1)#10 | 11.3%(+53.4)#394 |
| 11. | Gorham | 59.3% | 10.6%(+48.7)#11 | 11.3%(+47.9)#528 |
| 12. | Walnut Hill | 55.1% | 10.6%(+44.5)#12 | 11.3%(+43.8)#658 |
| 13. | Macedonia | 53.3% | 10.6%(+42.7)#13 | 11.3%(+42.0)#722 |
| 14. | Serena | 52.5% | 10.6%(+41.9)#14 | 11.3%(+41.2)#752 |
| 15. | Phillipstown | 51.4% | 10.6%(+40.8)#15 | 11.3%(+40.0)#800 |
| 16. | Willow Hill | 49.5% | 10.6%(+38.9)#16 | 11.3%(+38.2)#906 |
| 17. | Old Shawneetown | 47.7% | 10.6%(+37.1)#17 | 11.3%(+36.4)#989 |
| 18. | Hooppole | 44.8% | 10.6%(+34.2)#18 | 11.3%(+33.4)#1,166 |
| 19. | Loami | 43.1% | 10.6%(+32.5)#19 | 11.3%(+31.8)#1,287 |
| 20. | Time | 42.9% | 10.6%(+32.3)#20 | 11.3%(+31.5)#1,313 |
| 21. | Vienna | 41.7% | 10.6%(+31.1)#21 | 11.3%(+30.4)#1,395 |
| 22. | Washington Park | 41.4% | 10.6%(+30.8)#22 | 11.3%(+30.0)#1,440 |
| 23. | Nauvoo | 41.3% | 10.6%(+30.7)#23 | 11.3%(+29.9)#1,444 |
| 24. | Arrowsmith | 41.2% | 10.6%(+30.6)#24 | 11.3%(+29.9)#1,451 |
| 25. | Lowpoint | 39.3% | 10.6%(+28.7)#25 | 11.3%(+27.9)#1,640 |
| 26. | Henderson | 39.0% | 10.6%(+28.5)#26 | 11.3%(+27.7)#1,668 |
| 27. | Golconda | 38.9% | 10.6%(+28.3)#27 | 11.3%(+27.5)#1,692 |
| 28. | Wheeler | 38.1% | 10.6%(+27.5)#28 | 11.3%(+26.8)#1,779 |
| 29. | Sumner | 37.9% | 10.6%(+27.3)#29 | 11.3%(+26.6)#1,792 |
| 30. | Bureau Junction | 37.8% | 10.6%(+27.2)#30 | 11.3%(+26.4)#1,809 |
| 31. | Carbondale | 37.5% | 10.6%(+26.9)#31 | 11.3%(+26.2)#1,837 |
| 32. | Thebes | 37.3% | 10.6%(+26.7)#32 | 11.3%(+25.9)#1,876 |
| 33. | Sun River Terrace | 36.5% | 10.6%(+25.9)#33 | 11.3%(+25.1)#1,964 |
| 34. | West City | 36.3% | 10.6%(+25.8)#34 | 11.3%(+25.0)#1,987 |
| 35. | Chemung | 36.2% | 10.6%(+25.6)#35 | 11.3%(+24.8)#2,008 |
| 36. | Fowler | 35.9% | 10.6%(+25.4)#36 | 11.3%(+24.6)#2,034 |
| 37. | Cahokia Heights | 35.7% | 10.6%(+25.1)#37 | 11.3%(+24.3)#2,068 |
| 38. | Maunie | 35.6% | 10.6%(+25.0)#38 | 11.3%(+24.3)#2,072 |
| 39. | Mounds | 35.4% | 10.6%(+24.8)#39 | 11.3%(+24.1)#2,096 |
| 40. | Anna | 35.2% | 10.6%(+24.6)#40 | 11.3%(+23.8)#2,127 |
| 41. | Ford Heights | 35.2% | 10.6%(+24.6)#41 | 11.3%(+23.8)#2,132 |
| 42. | Muddy | 35.0% | 10.6%(+24.4)#42 | 11.3%(+23.7)#2,156 |
| 43. | Cobden | 34.7% | 10.6%(+24.1)#43 | 11.3%(+23.3)#2,195 |
| 44. | Keenes | 34.4% | 10.6%(+23.8)#44 | 11.3%(+23.0)#2,246 |
| 45. | Royal Lakes | 33.7% | 10.6%(+23.2)#45 | 11.3%(+22.4)#2,322 |
| 46. | Avon | 33.7% | 10.6%(+23.1)#46 | 11.3%(+22.4)#2,324 |
| 47. | Venice | 33.7% | 10.6%(+23.1)#47 | 11.3%(+22.4)#2,330 |
| 48. | Ellsworth | 33.7% | 10.6%(+23.1)#48 | 11.3%(+22.3)#2,337 |
| 49. | Rankin | 33.6% | 10.6%(+23.0)#49 | 11.3%(+22.2)#2,342 |
| 50. | Robbins | 33.5% | 10.6%(+22.9)#50 | 11.3%(+22.1)#2,357 |
| 51. | Hardin | 33.4% | 10.6%(+22.8)#51 | 11.3%(+22.1)#2,364 |
| 52. | Camden | 33.3% | 10.6%(+22.7)#52 | 11.3%(+22.0)#2,385 |
| 53. | Mill Creek | 33.3% | 10.6%(+22.7)#53 | 11.3%(+22.0)#2,396 |
| 54. | Florence | 33.3% | 10.6%(+22.7)#54 | 11.3%(+22.0)#2,407 |
| 55. | East St Louis | 33.1% | 10.6%(+22.5)#55 | 11.3%(+21.8)#2,425 |
| 56. | Freeman Spur | 33.1% | 10.6%(+22.5)#56 | 11.3%(+21.7)#2,433 |
| 57. | Brownstown | 32.9% | 10.6%(+22.3)#57 | 11.3%(+21.6)#2,465 |
| 58. | Gulfport | 31.5% | 10.6%(+20.9)#58 | 11.3%(+20.1)#2,702 |
| 59. | Hutsonville | 31.5% | 10.6%(+20.9)#59 | 11.3%(+20.1)#2,705 |
| 60. | Broughton | 31.2% | 10.6%(+20.7)#60 | 11.3%(+19.9)#2,731 |
| 61. | Mount Erie | 30.0% | 10.6%(+19.4)#61 | 11.3%(+18.7)#2,981 |
| 62. | Keyesport | 29.9% | 10.6%(+19.3)#62 | 11.3%(+18.6)#3,001 |
| 63. | Tilden | 29.2% | 10.6%(+18.6)#63 | 11.3%(+17.9)#3,162 |
| 64. | Louisville | 29.1% | 10.6%(+18.5)#64 | 11.3%(+17.8)#3,177 |
| 65. | Shawneetown | 29.0% | 10.6%(+18.4)#65 | 11.3%(+17.7)#3,199 |
| 66. | Pleasant Hill | 28.9% | 10.6%(+18.4)#66 | 11.3%(+17.6)#3,221 |
| 67. | Maquon | 28.7% | 10.6%(+18.1)#67 | 11.3%(+17.4)#3,276 |
| 68. | Eddyville | 28.6% | 10.6%(+18.0)#68 | 11.3%(+17.2)#3,314 |
| 69. | Ripley | 28.6% | 10.6%(+18.0)#69 | 11.3%(+17.2)#3,320 |
| 70. | Riverdale | 28.4% | 10.6%(+17.8)#70 | 11.3%(+17.0)#3,355 |
| 71. | Brookport | 28.4% | 10.6%(+17.8)#71 | 11.3%(+17.0)#3,359 |
| 72. | Central City | 28.1% | 10.6%(+17.5)#72 | 11.3%(+16.8)#3,415 |
| 73. | Chesterfield | 28.1% | 10.6%(+17.5)#73 | 11.3%(+16.7)#3,426 |
| 74. | New Canton | 27.8% | 10.6%(+17.2)#74 | 11.3%(+16.5)#3,478 |
| 75. | Detroit | 27.8% | 10.6%(+17.2)#75 | 11.3%(+16.4)#3,499 |
| 76. | Oakbrook Terrace | 27.5% | 10.6%(+16.9)#76 | 11.3%(+16.2)#3,561 |
| 77. | Mount Clare | 27.1% | 10.6%(+16.6)#77 | 11.3%(+15.8)#3,666 |
| 78. | Junction City | 27.0% | 10.6%(+16.5)#78 | 11.3%(+15.7)#3,684 |
| 79. | Willisville | 27.0% | 10.6%(+16.4)#79 | 11.3%(+15.7)#3,701 |
| 80. | Urbana | 27.0% | 10.6%(+16.4)#80 | 11.3%(+15.6)#3,703 |
| 81. | Carlinville | 27.0% | 10.6%(+16.4)#81 | 11.3%(+15.6)#3,714 |
| 82. | Charleston | 26.9% | 10.6%(+16.3)#82 | 11.3%(+15.6)#3,729 |
| 83. | Lewistown | 26.8% | 10.6%(+16.2)#83 | 11.3%(+15.4)#3,765 |
| 84. | Grandview | 26.7% | 10.6%(+16.1)#84 | 11.3%(+15.4)#3,783 |
| 85. | Carrier Mills | 26.5% | 10.6%(+15.9)#85 | 11.3%(+15.2)#3,829 |
| 86. | Mulberry Grove | 26.4% | 10.6%(+15.8)#86 | 11.3%(+15.1)#3,862 |
| 87. | Polo | 26.4% | 10.6%(+15.8)#87 | 11.3%(+15.0)#3,876 |
| 88. | Bingham | 26.3% | 10.6%(+15.7)#88 | 11.3%(+15.0)#3,889 |
| 89. | Markham | 26.3% | 10.6%(+15.7)#89 | 11.3%(+14.9)#3,913 |
| 90. | Roodhouse | 26.3% | 10.6%(+15.7)#90 | 11.3%(+14.9)#3,914 |
| 91. | Wamac | 26.2% | 10.6%(+15.6)#91 | 11.3%(+14.8)#3,940 |
| 92. | East Cape Girardeau | 26.2% | 10.6%(+15.6)#92 | 11.3%(+14.8)#3,943 |
| 93. | Dekalb | 25.9% | 10.6%(+15.3)#93 | 11.3%(+14.6)#4,020 |
| 94. | Troy Grove | 25.9% | 10.6%(+15.3)#94 | 11.3%(+14.6)#4,025 |
| 95. | Girard | 25.9% | 10.6%(+15.3)#95 | 11.3%(+14.6)#4,028 |
| 96. | Winslow | 25.8% | 10.6%(+15.2)#96 | 11.3%(+14.5)#4,048 |
| 97. | Bryant | 25.8% | 10.6%(+15.2)#97 | 11.3%(+14.5)#4,050 |
| 98. | Equality | 25.7% | 10.6%(+15.1)#98 | 11.3%(+14.4)#4,072 |
| 99. | Pulaski | 25.6% | 10.6%(+15.0)#99 | 11.3%(+14.2)#4,129 |
| 100. | Eldorado | 25.5% | 10.6%(+14.9)#100 | 11.3%(+14.2)#4,140 |
Common Questions
What are the Top 10 Cities with the Highest Male Poverty Level in Illinois?
Top 10 Cities with the Highest Male Poverty Level in Illinois are:
#1
100.0%
#2
70.2%
#3
66.1%
#4
65.3%
#5
64.7%
#6
59.3%
#7
55.1%
#8
53.3%
#9
51.4%
#10
49.5%
What city has the Highest Male Poverty Level in Illinois?
Westervelt has the Highest Male Poverty Level in Illinois with 100.0%.
What is the Poverty Level Among Males in the State of Illinois?
Poverty Level Among Males in Illinois is 10.6%.
What is the Poverty Level Among Males in the United States?
Poverty Level Among Males in the United States is 11.3%.