Cities with the Most Immigrants from Japan in Illinois
RELATED REPORTS & OPTIONS
Japan
Illinois
Compare Cities
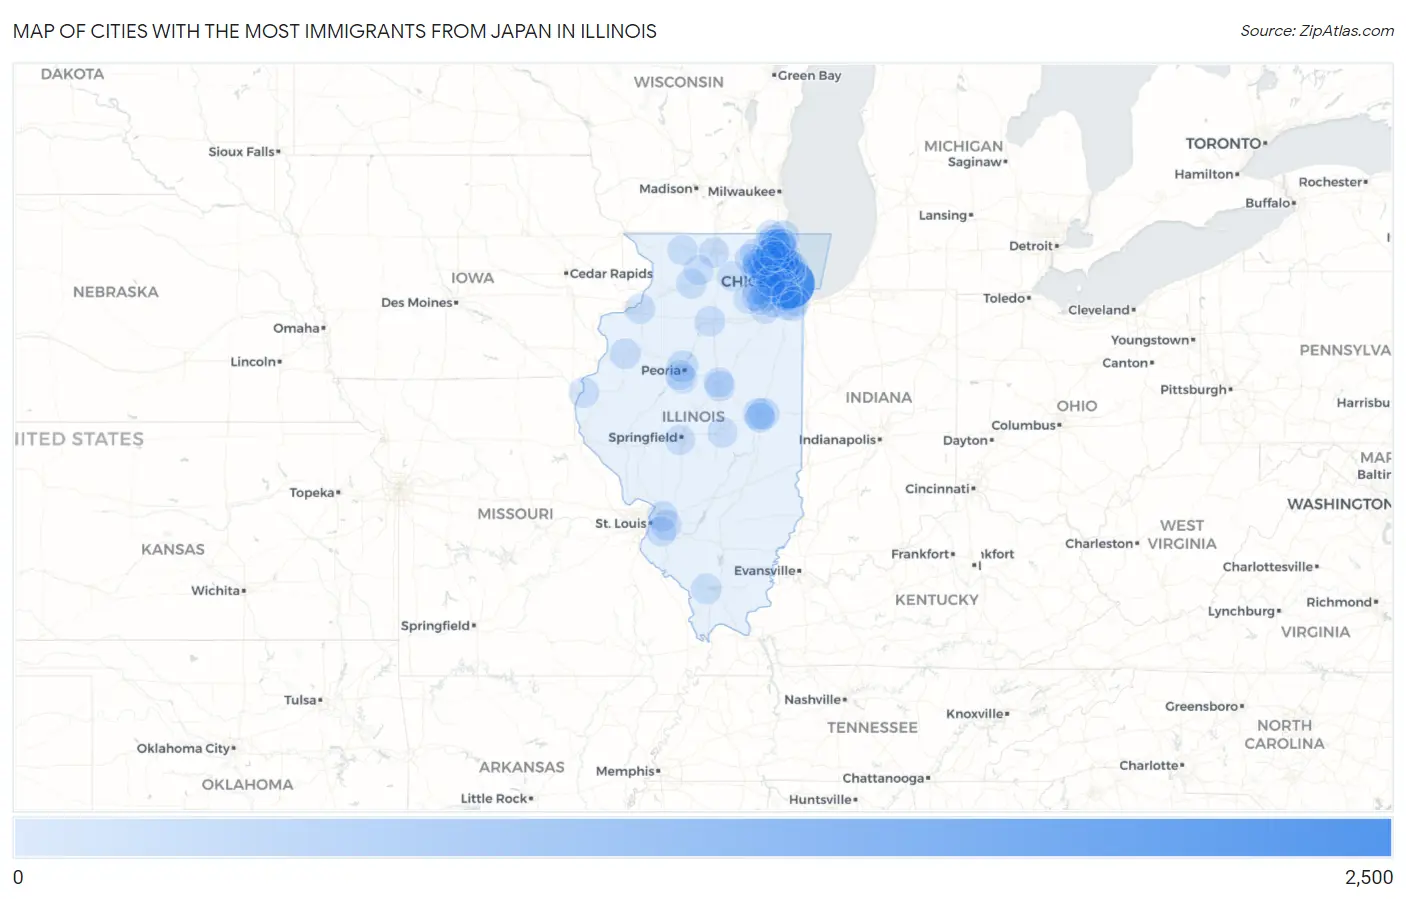
Map of Cities with the Most Immigrants from Japan in Illinois
0
2,500
Cities with the Most Immigrants from Japan in Illinois
| City | Japan | vs State | vs National | |
| 1. | Chicago | 2,283 | 10,943(20.86%)#1 | 342,380(0.67%)#12 |
| 2. | Schaumburg | 968 | 10,943(8.85%)#2 | 342,380(0.28%)#28 |
| 3. | Hoffman Estates | 856 | 10,943(7.82%)#3 | 342,380(0.25%)#37 |
| 4. | Arlington Heights | 642 | 10,943(5.87%)#4 | 342,380(0.19%)#63 |
| 5. | Palatine | 517 | 10,943(4.72%)#5 | 342,380(0.15%)#88 |
| 6. | Rolling Meadows | 277 | 10,943(2.53%)#6 | 342,380(0.08%)#185 |
| 7. | Buffalo Grove | 239 | 10,943(2.18%)#7 | 342,380(0.07%)#227 |
| 8. | Evanston | 192 | 10,943(1.75%)#8 | 342,380(0.06%)#282 |
| 9. | Itasca | 175 | 10,943(1.60%)#9 | 342,380(0.05%)#316 |
| 10. | Peoria | 162 | 10,943(1.48%)#10 | 342,380(0.05%)#344 |
| 11. | Elk Grove Village | 159 | 10,943(1.45%)#11 | 342,380(0.05%)#351 |
| 12. | Bolingbrook | 157 | 10,943(1.43%)#12 | 342,380(0.05%)#354 |
| 13. | Urbana | 153 | 10,943(1.40%)#13 | 342,380(0.04%)#365 |
| 14. | Champaign | 145 | 10,943(1.33%)#14 | 342,380(0.04%)#384 |
| 15. | Naperville | 142 | 10,943(1.30%)#15 | 342,380(0.04%)#391 |
| 16. | Zion | 136 | 10,943(1.24%)#16 | 342,380(0.04%)#410 |
| 17. | Oak Park | 122 | 10,943(1.11%)#17 | 342,380(0.04%)#449 |
| 18. | Skokie | 121 | 10,943(1.11%)#18 | 342,380(0.04%)#452 |
| 19. | Mount Prospect | 96 | 10,943(0.88%)#19 | 342,380(0.03%)#562 |
| 20. | Streamwood | 92 | 10,943(0.84%)#20 | 342,380(0.03%)#582 |
| 21. | Northbrook | 88 | 10,943(0.80%)#21 | 342,380(0.03%)#607 |
| 22. | Park Ridge | 84 | 10,943(0.77%)#22 | 342,380(0.02%)#630 |
| 23. | Wheaton | 80 | 10,943(0.73%)#23 | 342,380(0.02%)#648 |
| 24. | Bloomingdale | 77 | 10,943(0.70%)#24 | 342,380(0.02%)#664 |
| 25. | Monmouth | 67 | 10,943(0.61%)#25 | 342,380(0.02%)#750 |
| 26. | Lake Zurich | 66 | 10,943(0.60%)#26 | 342,380(0.02%)#759 |
| 27. | Gurnee | 64 | 10,943(0.58%)#27 | 342,380(0.02%)#776 |
| 28. | Highland Park | 59 | 10,943(0.54%)#28 | 342,380(0.02%)#819 |
| 29. | O Fallon | 57 | 10,943(0.52%)#29 | 342,380(0.02%)#852 |
| 30. | Vernon Hills | 57 | 10,943(0.52%)#30 | 342,380(0.02%)#856 |
| 31. | Lincolnwood | 56 | 10,943(0.51%)#31 | 342,380(0.02%)#875 |
| 32. | Grayslake | 55 | 10,943(0.50%)#32 | 342,380(0.02%)#886 |
| 33. | Hamilton | 51 | 10,943(0.47%)#33 | 342,380(0.01%)#941 |
| 34. | Peru | 50 | 10,943(0.46%)#34 | 342,380(0.01%)#952 |
| 35. | Carol Stream | 48 | 10,943(0.44%)#35 | 342,380(0.01%)#977 |
| 36. | Glendale Heights | 48 | 10,943(0.44%)#36 | 342,380(0.01%)#979 |
| 37. | Maryville | 48 | 10,943(0.44%)#37 | 342,380(0.01%)#984 |
| 38. | Carpentersville | 45 | 10,943(0.41%)#38 | 342,380(0.01%)#1,028 |
| 39. | Downers Grove | 42 | 10,943(0.38%)#39 | 342,380(0.01%)#1,068 |
| 40. | Inverness | 41 | 10,943(0.37%)#40 | 342,380(0.01%)#1,101 |
| 41. | Round Lake | 40 | 10,943(0.37%)#41 | 342,380(0.01%)#1,114 |
| 42. | Lincolnshire | 40 | 10,943(0.37%)#42 | 342,380(0.01%)#1,121 |
| 43. | Carbondale | 38 | 10,943(0.35%)#43 | 342,380(0.01%)#1,152 |
| 44. | Bloomington | 37 | 10,943(0.34%)#44 | 342,380(0.01%)#1,167 |
| 45. | Glenview | 37 | 10,943(0.34%)#45 | 342,380(0.01%)#1,171 |
| 46. | Crystal Lake | 37 | 10,943(0.34%)#46 | 342,380(0.01%)#1,172 |
| 47. | Morton Grove | 37 | 10,943(0.34%)#47 | 342,380(0.01%)#1,177 |
| 48. | South Elgin | 36 | 10,943(0.33%)#48 | 342,380(0.01%)#1,199 |
| 49. | Waukegan | 34 | 10,943(0.31%)#49 | 342,380(0.01%)#1,224 |
| 50. | Wilmette | 33 | 10,943(0.30%)#50 | 342,380(0.01%)#1,253 |
| 51. | Elgin | 32 | 10,943(0.29%)#51 | 342,380(0.01%)#1,276 |
| 52. | Elmhurst | 31 | 10,943(0.28%)#52 | 342,380(0.01%)#1,313 |
| 53. | Wheeling | 31 | 10,943(0.28%)#53 | 342,380(0.01%)#1,316 |
| 54. | Lindenhurst | 31 | 10,943(0.28%)#54 | 342,380(0.01%)#1,327 |
| 55. | Belleville | 30 | 10,943(0.27%)#55 | 342,380(0.01%)#1,345 |
| 56. | Lake Barrington | 30 | 10,943(0.27%)#56 | 342,380(0.01%)#1,368 |
| 57. | Tinley Park | 29 | 10,943(0.27%)#57 | 342,380(0.01%)#1,384 |
| 58. | Normal | 26 | 10,943(0.24%)#58 | 342,380(0.01%)#1,475 |
| 59. | East Moline | 26 | 10,943(0.24%)#59 | 342,380(0.01%)#1,484 |
| 60. | Dixon | 26 | 10,943(0.24%)#60 | 342,380(0.01%)#1,486 |
| 61. | Savoy | 26 | 10,943(0.24%)#61 | 342,380(0.01%)#1,495 |
| 62. | Northfield | 26 | 10,943(0.24%)#62 | 342,380(0.01%)#1,498 |
| 63. | Des Plaines | 25 | 10,943(0.23%)#63 | 342,380(0.01%)#1,512 |
| 64. | Dekalb | 25 | 10,943(0.23%)#64 | 342,380(0.01%)#1,517 |
| 65. | Hinsdale | 25 | 10,943(0.23%)#65 | 342,380(0.01%)#1,533 |
| 66. | Joliet | 24 | 10,943(0.22%)#66 | 342,380(0.01%)#1,551 |
| 67. | Rockford | 24 | 10,943(0.22%)#67 | 342,380(0.01%)#1,552 |
| 68. | Freeport | 24 | 10,943(0.22%)#68 | 342,380(0.01%)#1,568 |
| 69. | Decatur | 23 | 10,943(0.21%)#69 | 342,380(0.01%)#1,592 |
| 70. | Wood Dale | 23 | 10,943(0.21%)#70 | 342,380(0.01%)#1,613 |
| 71. | Yorkville | 22 | 10,943(0.20%)#71 | 342,380(0.01%)#1,650 |
| 72. | Deerfield | 22 | 10,943(0.20%)#72 | 342,380(0.01%)#1,655 |
| 73. | Huntley | 21 | 10,943(0.19%)#73 | 342,380(0.01%)#1,689 |
| 74. | Lockport | 21 | 10,943(0.19%)#74 | 342,380(0.01%)#1,690 |
| 75. | Worth | 21 | 10,943(0.19%)#75 | 342,380(0.01%)#1,712 |
| 76. | Springfield | 20 | 10,943(0.18%)#76 | 342,380(0.01%)#1,734 |
| 77. | Bartlett | 20 | 10,943(0.18%)#77 | 342,380(0.01%)#1,742 |
| 78. | Brookfield | 20 | 10,943(0.18%)#78 | 342,380(0.01%)#1,762 |
| 79. | Antioch | 20 | 10,943(0.18%)#79 | 342,380(0.01%)#1,765 |
| 80. | Aurora | 19 | 10,943(0.17%)#80 | 342,380(0.01%)#1,784 |
| 81. | Lombard | 19 | 10,943(0.17%)#81 | 342,380(0.01%)#1,792 |
| 82. | Hanover Park | 18 | 10,943(0.16%)#82 | 342,380(0.01%)#1,839 |
| 83. | Lisle | 18 | 10,943(0.16%)#83 | 342,380(0.01%)#1,851 |
| 84. | Plainfield | 17 | 10,943(0.16%)#84 | 342,380(0.00%)#1,894 |
| 85. | Pekin | 17 | 10,943(0.16%)#85 | 342,380(0.00%)#1,900 |
| 86. | Bartonville | 17 | 10,943(0.16%)#86 | 342,380(0.00%)#1,937 |
| 87. | Western Springs | 16 | 10,943(0.15%)#87 | 342,380(0.00%)#1,977 |
| 88. | Palos Heights | 15 | 10,943(0.14%)#88 | 342,380(0.00%)#2,051 |
| 89. | West Dundee | 15 | 10,943(0.14%)#89 | 342,380(0.00%)#2,061 |
| 90. | Oregon | 15 | 10,943(0.14%)#90 | 342,380(0.00%)#2,075 |
| 91. | Oswego | 14 | 10,943(0.13%)#91 | 342,380(0.00%)#2,101 |
| 92. | Park City | 14 | 10,943(0.13%)#92 | 342,380(0.00%)#2,130 |
| 93. | North Chicago | 13 | 10,943(0.12%)#93 | 342,380(0.00%)#2,179 |
| 94. | Barrington | 13 | 10,943(0.12%)#94 | 342,380(0.00%)#2,209 |
| 95. | Glen Ellyn | 12 | 10,943(0.11%)#95 | 342,380(0.00%)#2,276 |
| 96. | Harvey | 12 | 10,943(0.11%)#96 | 342,380(0.00%)#2,288 |
| 97. | Gages Lake | 12 | 10,943(0.11%)#97 | 342,380(0.00%)#2,308 |
| 98. | Flossmoor | 12 | 10,943(0.11%)#98 | 342,380(0.00%)#2,317 |
| 99. | Hawthorn Woods | 12 | 10,943(0.11%)#99 | 342,380(0.00%)#2,318 |
| 100. | Long Grove | 12 | 10,943(0.11%)#100 | 342,380(0.00%)#2,323 |
Common Questions
What are the Top 10 Cities with the Most Immigrants from Japan in Illinois?
Top 10 Cities with the Most Immigrants from Japan in Illinois are:
#1
2,283
#2
968
#3
856
#4
642
#5
517
#6
277
#7
239
#8
192
#9
175
#10
162
What city has the Most Immigrants from Japan in Illinois?
Chicago has the Most Immigrants from Japan in Illinois with 2,283.
What is the Total Immigrants from Japan in the State of Illinois?
Total Immigrants from Japan in Illinois is 10,943.
What is the Total Immigrants from Japan in the United States?
Total Immigrants from Japan in the United States is 342,380.