Cities with the Lowest Poverty Level Among Single Mothers in Illinois
RELATED REPORTS & OPTIONS
Lowest Poverty | Single Mother
Illinois
Compare Cities
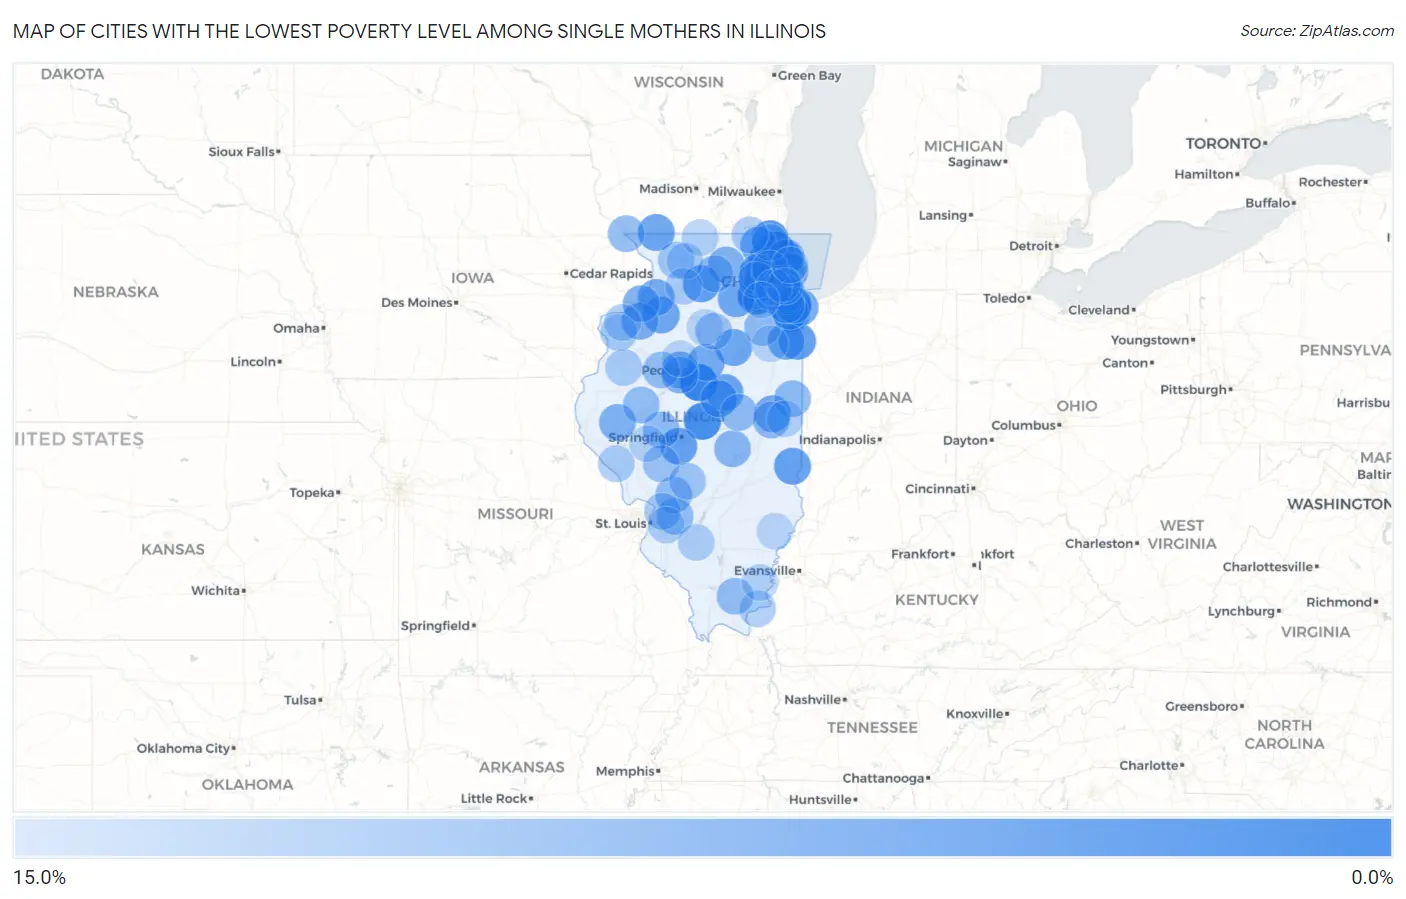
Map of Cities with the Lowest Poverty Level Among Single Mothers in Illinois
15.0%
0.0%
Cities with the Lowest Poverty Level Among Single Mothers in Illinois
| City | Single Mother Poverty | vs State | vs National | |
| 1. | Mackinaw | 1.0% | 32.4%(-31.3)#1 | 33.1%(-32.1)#6 |
| 2. | Deerfield | 1.8% | 32.4%(-30.6)#2 | 33.1%(-31.3)#27 |
| 3. | Burr Ridge | 2.0% | 32.4%(-30.4)#3 | 33.1%(-31.1)#33 |
| 4. | Mount Pulaski | 2.2% | 32.4%(-30.2)#4 | 33.1%(-30.9)#41 |
| 5. | Flossmoor | 2.2% | 32.4%(-30.2)#5 | 33.1%(-30.9)#42 |
| 6. | Lemont | 2.3% | 32.4%(-30.0)#6 | 33.1%(-30.8)#49 |
| 7. | Libertyville | 2.5% | 32.4%(-29.8)#7 | 33.1%(-30.6)#61 |
| 8. | Barrington | 2.6% | 32.4%(-29.7)#8 | 33.1%(-30.5)#65 |
| 9. | Boulder Hill | 3.3% | 32.4%(-29.1)#9 | 33.1%(-29.9)#110 |
| 10. | Lake Villa | 3.3% | 32.4%(-29.0)#10 | 33.1%(-29.8)#117 |
| 11. | Westchester | 3.8% | 32.4%(-28.6)#11 | 33.1%(-29.4)#156 |
| 12. | Oswego | 3.8% | 32.4%(-28.5)#12 | 33.1%(-29.3)#163 |
| 13. | University Park | 4.1% | 32.4%(-28.3)#13 | 33.1%(-29.1)#182 |
| 14. | Hopkins Park | 4.1% | 32.4%(-28.3)#14 | 33.1%(-29.1)#184 |
| 15. | Franklin Grove | 4.2% | 32.4%(-28.2)#15 | 33.1%(-29.0)#193 |
| 16. | Chatham | 4.5% | 32.4%(-27.9)#16 | 33.1%(-28.6)#221 |
| 17. | Darien | 4.6% | 32.4%(-27.7)#17 | 33.1%(-28.5)#239 |
| 18. | Bartlett | 4.7% | 32.4%(-27.7)#18 | 33.1%(-28.4)#250 |
| 19. | Marshall | 4.8% | 32.4%(-27.6)#19 | 33.1%(-28.4)#255 |
| 20. | Hillside | 4.9% | 32.4%(-27.4)#20 | 33.1%(-28.2)#283 |
| 21. | Downs | 5.0% | 32.4%(-27.4)#21 | 33.1%(-28.1)#289 |
| 22. | Apple River | 5.0% | 32.4%(-27.4)#22 | 33.1%(-28.1)#299 |
| 23. | Heyworth | 5.1% | 32.4%(-27.2)#23 | 33.1%(-28.0)#310 |
| 24. | Niles | 5.2% | 32.4%(-27.1)#24 | 33.1%(-27.9)#324 |
| 25. | Somonauk | 5.3% | 32.4%(-27.1)#25 | 33.1%(-27.9)#327 |
| 26. | Aroma Park | 5.3% | 32.4%(-27.1)#26 | 33.1%(-27.9)#332 |
| 27. | Cornell | 5.3% | 32.4%(-27.1)#27 | 33.1%(-27.9)#337 |
| 28. | St Charles | 5.3% | 32.4%(-27.1)#28 | 33.1%(-27.8)#338 |
| 29. | Atkinson | 5.4% | 32.4%(-27.0)#29 | 33.1%(-27.8)#348 |
| 30. | St Joseph | 5.6% | 32.4%(-26.8)#30 | 33.1%(-27.6)#369 |
| 31. | Roanoke | 5.7% | 32.4%(-26.7)#31 | 33.1%(-27.5)#389 |
| 32. | Mchenry | 5.7% | 32.4%(-26.6)#32 | 33.1%(-27.4)#404 |
| 33. | Lynwood | 5.7% | 32.4%(-26.6)#33 | 33.1%(-27.4)#405 |
| 34. | Wheaton | 6.0% | 32.4%(-26.3)#34 | 33.1%(-27.1)#436 |
| 35. | Bellevue | 6.1% | 32.4%(-26.3)#35 | 33.1%(-27.1)#440 |
| 36. | Erie | 6.1% | 32.4%(-26.3)#36 | 33.1%(-27.1)#442 |
| 37. | Roselle | 6.1% | 32.4%(-26.3)#37 | 33.1%(-27.1)#446 |
| 38. | Orion | 6.2% | 32.4%(-26.1)#38 | 33.1%(-26.9)#467 |
| 39. | Rapids City | 6.2% | 32.4%(-26.1)#39 | 33.1%(-26.9)#470 |
| 40. | Mccook | 6.2% | 32.4%(-26.1)#40 | 33.1%(-26.9)#478 |
| 41. | Mount Sterling | 6.5% | 32.4%(-25.8)#41 | 33.1%(-26.6)#519 |
| 42. | Lincolnwood | 6.7% | 32.4%(-25.7)#42 | 33.1%(-26.5)#534 |
| 43. | La Grange | 6.9% | 32.4%(-25.5)#43 | 33.1%(-26.3)#576 |
| 44. | Kirkland | 6.9% | 32.4%(-25.5)#44 | 33.1%(-26.2)#581 |
| 45. | Highland Park | 7.0% | 32.4%(-25.4)#45 | 33.1%(-26.2)#588 |
| 46. | Bartonville | 7.0% | 32.4%(-25.4)#46 | 33.1%(-26.2)#590 |
| 47. | Orland Park | 7.0% | 32.4%(-25.3)#47 | 33.1%(-26.1)#594 |
| 48. | Palos Hills | 7.0% | 32.4%(-25.3)#48 | 33.1%(-26.1)#595 |
| 49. | Hinsdale | 7.0% | 32.4%(-25.3)#49 | 33.1%(-26.1)#597 |
| 50. | Bethany | 7.4% | 32.4%(-25.0)#50 | 33.1%(-25.7)#672 |
| 51. | South Elgin | 7.4% | 32.4%(-24.9)#51 | 33.1%(-25.7)#679 |
| 52. | Palos Heights | 7.6% | 32.4%(-24.7)#52 | 33.1%(-25.5)#706 |
| 53. | Hillcrest | 7.7% | 32.4%(-24.7)#53 | 33.1%(-25.4)#719 |
| 54. | Henning | 7.7% | 32.4%(-24.7)#54 | 33.1%(-25.4)#738 |
| 55. | East Dubuque | 7.8% | 32.4%(-24.6)#55 | 33.1%(-25.4)#747 |
| 56. | Ashland | 7.8% | 32.4%(-24.5)#56 | 33.1%(-25.3)#758 |
| 57. | De Land | 7.9% | 32.4%(-24.5)#57 | 33.1%(-25.2)#766 |
| 58. | Braidwood | 8.0% | 32.4%(-24.4)#58 | 33.1%(-25.1)#777 |
| 59. | Sidney | 8.0% | 32.4%(-24.4)#59 | 33.1%(-25.1)#783 |
| 60. | Woodridge | 8.1% | 32.4%(-24.3)#60 | 33.1%(-25.1)#791 |
| 61. | St Jacob | 8.1% | 32.4%(-24.2)#61 | 33.1%(-25.0)#801 |
| 62. | Staunton | 8.2% | 32.4%(-24.2)#62 | 33.1%(-25.0)#809 |
| 63. | Astoria | 8.2% | 32.4%(-24.2)#63 | 33.1%(-24.9)#817 |
| 64. | Chicago Ridge | 8.2% | 32.4%(-24.1)#64 | 33.1%(-24.9)#820 |
| 65. | Richton Park | 8.3% | 32.4%(-24.0)#65 | 33.1%(-24.8)#835 |
| 66. | Farmington | 8.3% | 32.4%(-24.0)#66 | 33.1%(-24.8)#841 |
| 67. | Stonefort | 8.3% | 32.4%(-24.0)#67 | 33.1%(-24.8)#855 |
| 68. | Homewood | 8.4% | 32.4%(-24.0)#68 | 33.1%(-24.7)#870 |
| 69. | Tonica | 8.7% | 32.4%(-23.7)#69 | 33.1%(-24.4)#921 |
| 70. | Palmyra | 8.7% | 32.4%(-23.7)#70 | 33.1%(-24.4)#923 |
| 71. | Shannon | 9.1% | 32.4%(-23.3)#71 | 33.1%(-24.0)#1,006 |
| 72. | Butler | 9.1% | 32.4%(-23.3)#72 | 33.1%(-24.0)#1,015 |
| 73. | Round Lake Beach | 9.3% | 32.4%(-23.0)#73 | 33.1%(-23.8)#1,041 |
| 74. | Geneva | 9.4% | 32.4%(-23.0)#74 | 33.1%(-23.7)#1,052 |
| 75. | Tinley Park | 9.5% | 32.4%(-22.9)#75 | 33.1%(-23.7)#1,065 |
| 76. | Aledo | 9.6% | 32.4%(-22.8)#76 | 33.1%(-23.6)#1,089 |
| 77. | Edwardsville | 9.7% | 32.4%(-22.7)#77 | 33.1%(-23.5)#1,102 |
| 78. | Hebron | 9.8% | 32.4%(-22.6)#78 | 33.1%(-23.4)#1,120 |
| 79. | La Grange Park | 9.9% | 32.4%(-22.4)#79 | 33.1%(-23.2)#1,147 |
| 80. | Forreston | 10.0% | 32.4%(-22.4)#80 | 33.1%(-23.1)#1,175 |
| 81. | Roseville | 10.0% | 32.4%(-22.4)#81 | 33.1%(-23.1)#1,178 |
| 82. | Reynolds | 10.0% | 32.4%(-22.4)#82 | 33.1%(-23.1)#1,182 |
| 83. | Nebo | 10.0% | 32.4%(-22.4)#83 | 33.1%(-23.1)#1,189 |
| 84. | Elizabethtown | 10.0% | 32.4%(-22.4)#84 | 33.1%(-23.1)#1,195 |
| 85. | Nelson | 10.0% | 32.4%(-22.4)#85 | 33.1%(-23.1)#1,199 |
| 86. | Schaumburg | 10.1% | 32.4%(-22.3)#86 | 33.1%(-23.1)#1,203 |
| 87. | O Fallon | 10.3% | 32.4%(-22.1)#87 | 33.1%(-22.9)#1,229 |
| 88. | Nashville | 10.3% | 32.4%(-22.0)#88 | 33.1%(-22.8)#1,242 |
| 89. | Fairmount | 10.5% | 32.4%(-21.8)#89 | 33.1%(-22.6)#1,285 |
| 90. | Downers Grove | 10.6% | 32.4%(-21.7)#90 | 33.1%(-22.5)#1,311 |
| 91. | Durand | 10.6% | 32.4%(-21.7)#91 | 33.1%(-22.5)#1,316 |
| 92. | Lyons | 10.7% | 32.4%(-21.7)#92 | 33.1%(-22.4)#1,324 |
| 93. | South Jacksonville | 10.7% | 32.4%(-21.6)#93 | 33.1%(-22.4)#1,330 |
| 94. | Wilmette | 10.7% | 32.4%(-21.6)#94 | 33.1%(-22.4)#1,339 |
| 95. | Ridgway | 10.8% | 32.4%(-21.5)#95 | 33.1%(-22.3)#1,351 |
| 96. | Plainfield | 10.8% | 32.4%(-21.5)#96 | 33.1%(-22.3)#1,353 |
| 97. | Granville | 11.1% | 32.4%(-21.2)#97 | 33.1%(-22.0)#1,408 |
| 98. | Dunlap | 11.1% | 32.4%(-21.2)#98 | 33.1%(-22.0)#1,409 |
| 99. | Herscher | 11.1% | 32.4%(-21.2)#99 | 33.1%(-22.0)#1,410 |
| 100. | West Salem | 11.1% | 32.4%(-21.2)#100 | 33.1%(-22.0)#1,424 |
Common Questions
What are the Top 10 Cities with the Lowest Poverty Level Among Single Mothers in Illinois?
Top 10 Cities with the Lowest Poverty Level Among Single Mothers in Illinois are:
#1
1.0%
#2
1.8%
#3
2.0%
#4
2.2%
#5
2.2%
#6
2.3%
#7
2.5%
#8
2.6%
#9
3.3%
#10
3.3%
What city has the Lowest Poverty Level Among Single Mothers in Illinois?
Mackinaw has the Lowest Poverty Level Among Single Mothers in Illinois with 1.0%.
What is the Poverty Level Among Single Mothers in the State of Illinois?
Poverty Level Among Single Mothers in Illinois is 32.4%.
What is the Poverty Level Among Single Mothers in the United States?
Poverty Level Among Single Mothers in the United States is 33.1%.