Cities with the Highest Percentage of Immigrants from Sri Lanka in Illinois
RELATED REPORTS & OPTIONS
Sri Lanka
Illinois
Compare Cities
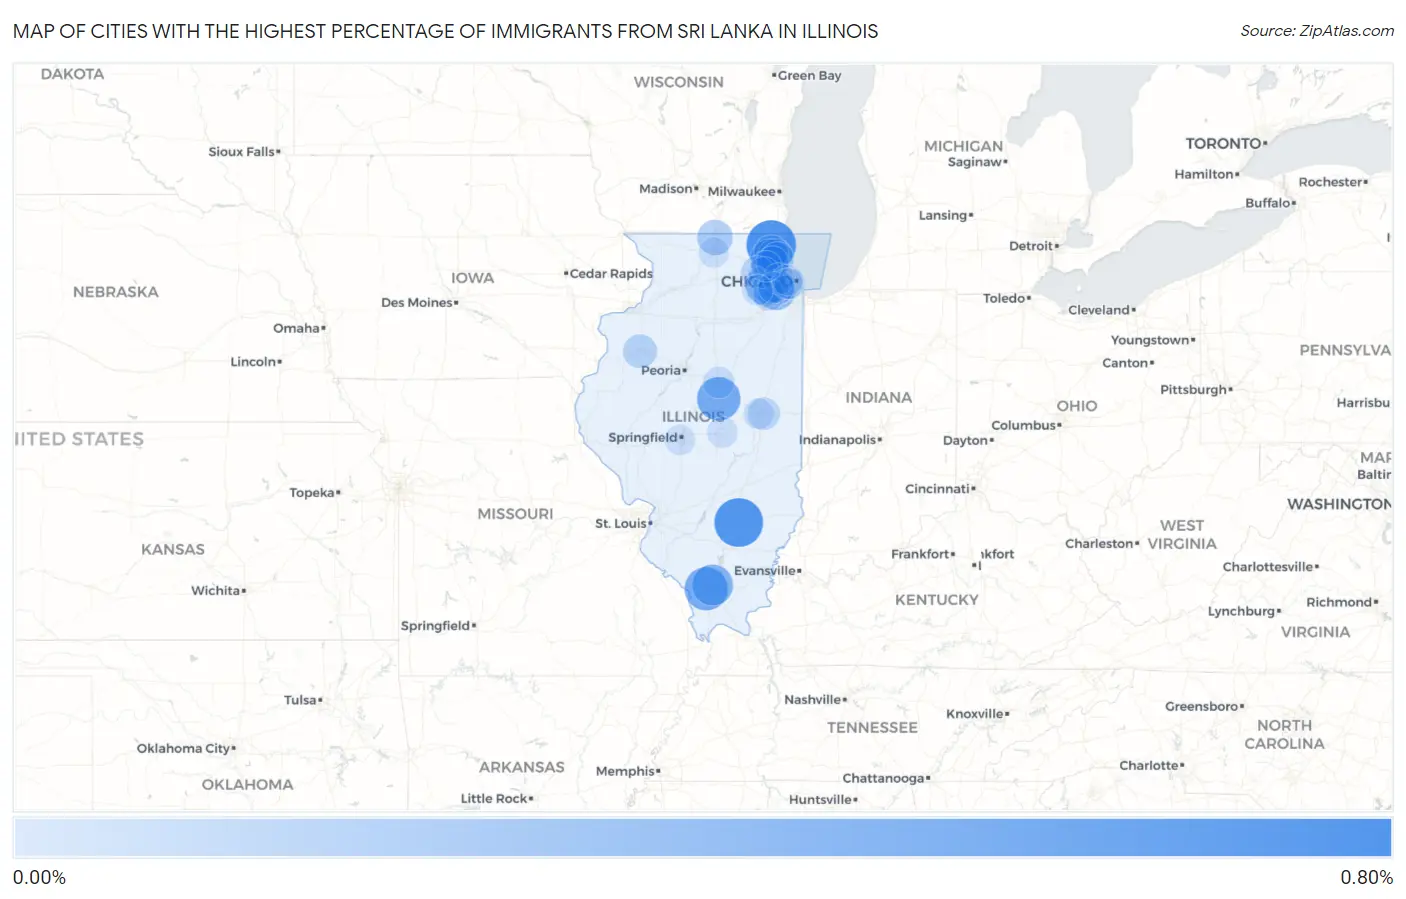
Map of Cities with the Highest Percentage of Immigrants from Sri Lanka in Illinois
0.00%
0.80%
Cities with the Highest Percentage of Immigrants from Sri Lanka in Illinois
| City | Sri Lanka | vs State | vs National | |
| 1. | Hainesville | 0.65% | 0.011%(+0.637)#-1 | 0.017%(+0.631)#0 |
| 2. | Xenia | 0.62% | 0.011%(+0.608)#0 | 0.017%(+0.602)#1 |
| 3. | Heyworth | 0.44% | 0.011%(+0.429)#1 | 0.017%(+0.423)#2 |
| 4. | Carbondale | 0.44% | 0.011%(+0.425)#124 | 0.017%(+0.418)#1,707 |
| 5. | Carterville | 0.36% | 0.011%(+0.349)#125 | 0.017%(+0.343)#1,708 |
| 6. | Deer Park | 0.30% | 0.011%(+0.287)#126 | 0.017%(+0.281)#1,709 |
| 7. | Warrenville | 0.29% | 0.011%(+0.283)#132 | 0.017%(+0.277)#1,936 |
| 8. | Darien | 0.26% | 0.011%(+0.244)#133 | 0.017%(+0.238)#1,937 |
| 9. | Westmont | 0.17% | 0.011%(+0.162)#134 | 0.017%(+0.156)#1,960 |
| 10. | Rockton | 0.17% | 0.011%(+0.159)#135 | 0.017%(+0.153)#1,961 |
| 11. | Long Grove | 0.14% | 0.011%(+0.134)#136 | 0.017%(+0.128)#1,962 |
| 12. | Hawthorn Woods | 0.14% | 0.011%(+0.132)#137 | 0.017%(+0.126)#1,963 |
| 13. | Lisle | 0.12% | 0.011%(+0.112)#138 | 0.017%(+0.106)#1,964 |
| 14. | Galesburg | 0.11% | 0.011%(+0.103)#139 | 0.017%(+0.097)#1,965 |
| 15. | Buffalo Grove | 0.10% | 0.011%(+0.089)#140 | 0.017%(+0.083)#1,966 |
| 16. | South Elgin | 0.092% | 0.011%(+0.081)#141 | 0.017%(+0.075)#1,967 |
| 17. | Urbana | 0.075% | 0.011%(+0.064)#142 | 0.017%(+0.058)#1,968 |
| 18. | Palatine | 0.073% | 0.011%(+0.062)#143 | 0.017%(+0.056)#1,969 |
| 19. | Hinsdale | 0.052% | 0.011%(+0.041)#144 | 0.017%(+0.035)#1,970 |
| 20. | Naperville | 0.044% | 0.011%(+0.033)#145 | 0.017%(+0.027)#1,971 |
| 21. | Normal | 0.043% | 0.011%(+0.032)#146 | 0.017%(+0.026)#1,972 |
| 22. | Bartlett | 0.032% | 0.011%(+0.021)#147 | 0.017%(+0.015)#1,973 |
| 23. | Bolingbrook | 0.030% | 0.011%(+0.019)#148 | 0.017%(+0.013)#1,974 |
| 24. | Elmhurst | 0.028% | 0.011%(+0.017)#149 | 0.017%(+0.011)#1,975 |
| 25. | Downers Grove | 0.022% | 0.011%(+0.011)#150 | 0.017%(+0.005)#1,976 |
| 26. | Chicago | 0.021% | 0.011%(+0.010)#151 | 0.017%(+0.004)#1,977 |
| 27. | Oak Park | 0.019% | 0.011%(+0.008)#152 | 0.017%(+0.001)#1,978 |
| 28. | Berwyn | 0.018% | 0.011%(+0.007)#153 | 0.017%(+0.001)#1,979 |
| 29. | Aurora | 0.018% | 0.011%(+0.007)#154 | 0.017%(+0.001)#1,980 |
| 30. | Hoffman Estates | 0.015% | 0.011%(+0.004)#155 | 0.017%(-0.002)#1,981 |
| 31. | Decatur | 0.014% | 0.011%(+0.003)#156 | 0.017%(-0.003)#1,982 |
| 32. | Champaign | 0.011% | 0.011%(+0.000)#157 | 0.017%(-0.006)#1,983 |
| 33. | Rockford | 0.0074% | 0.011%(-0.004)#158 | 0.017%(-0.010)#1,984 |
| 34. | Springfield | 0.0061% | 0.011%(-0.005)#159 | 0.017%(-0.011)#1,985 |
Common Questions
What are the Top 10 Cities with the Highest Percentage of Immigrants from Sri Lanka in Illinois?
Top 10 Cities with the Highest Percentage of Immigrants from Sri Lanka in Illinois are:
#1
0.65%
#2
0.62%
#3
0.44%
#4
0.44%
#5
0.36%
#6
0.30%
#7
0.29%
#8
0.26%
#9
0.17%
#10
0.17%
What city has the Highest Percentage of Immigrants from Sri Lanka in Illinois?
Hainesville has the Highest Percentage of Immigrants from Sri Lanka in Illinois with 0.65%.
What is the Percentage of Immigrants from Sri Lanka in the State of Illinois?
Percentage of Immigrants from Sri Lanka in Illinois is 0.011%.
What is the Percentage of Immigrants from Sri Lanka in the United States?
Percentage of Immigrants from Sri Lanka in the United States is 0.017%.