Cities with the Most Immigrants from Lithuania in Illinois
RELATED REPORTS & OPTIONS
Lithuania
Illinois
Compare Cities
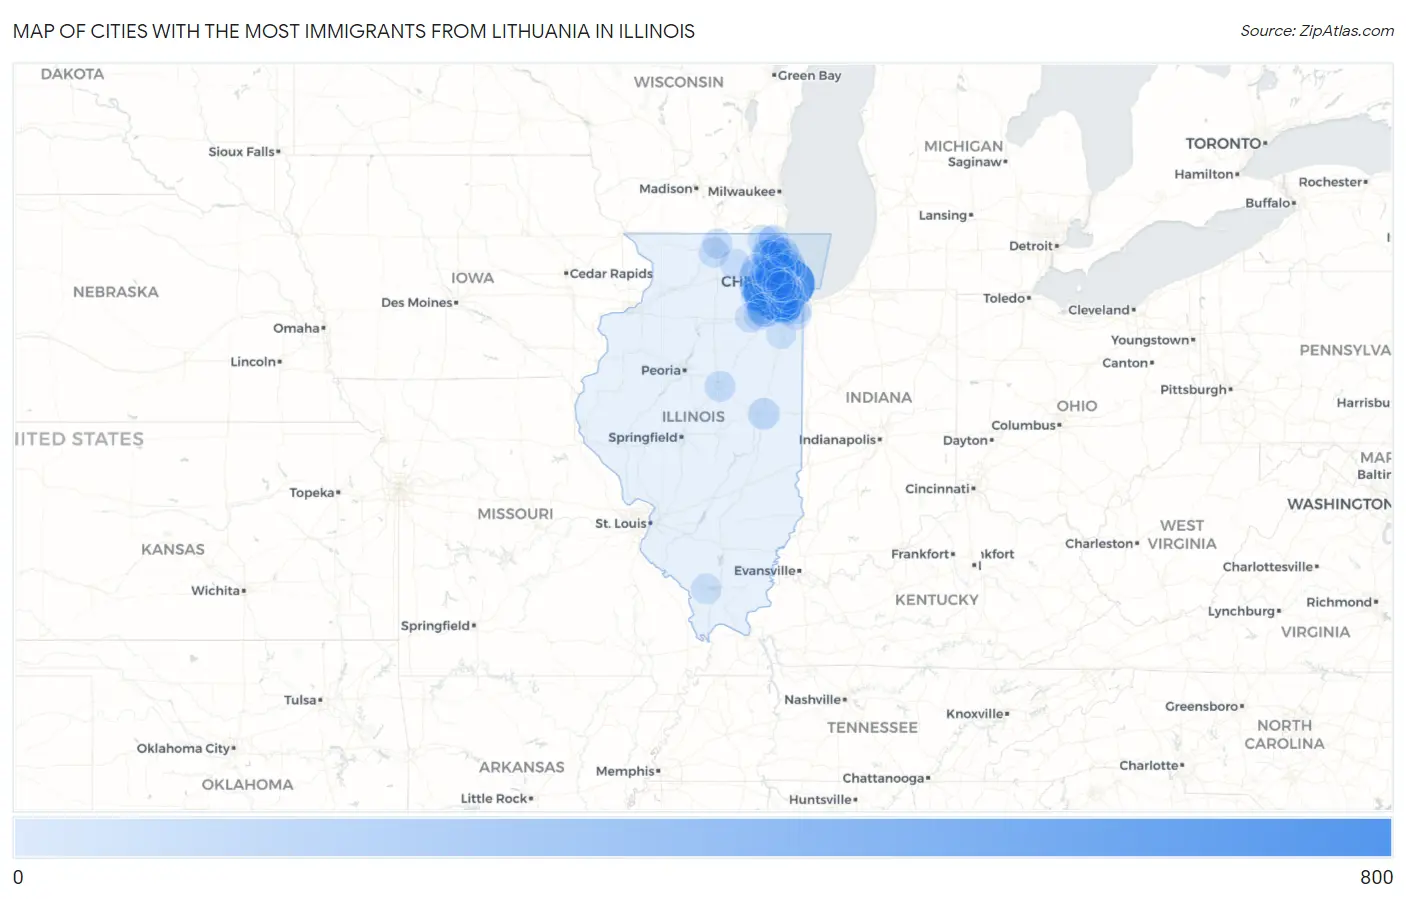
Map of Cities with the Most Immigrants from Lithuania in Illinois
0
800
Cities with the Most Immigrants from Lithuania in Illinois
| City | Lithuania | vs State | vs National | |
| 1. | Chicago | 745 | 10,249(7.27%)#1 | 33,942(2.19%)#2 |
| 2. | Lemont | 661 | 10,249(6.45%)#2 | 33,942(1.95%)#3 |
| 3. | Naperville | 573 | 10,249(5.59%)#3 | 33,942(1.69%)#4 |
| 4. | Orland Park | 421 | 10,249(4.11%)#4 | 33,942(1.24%)#6 |
| 5. | Westmont | 379 | 10,249(3.70%)#5 | 33,942(1.12%)#7 |
| 6. | Palos Hills | 338 | 10,249(3.30%)#6 | 33,942(1.00%)#8 |
| 7. | Darien | 323 | 10,249(3.15%)#7 | 33,942(0.95%)#9 |
| 8. | Downers Grove | 304 | 10,249(2.97%)#8 | 33,942(0.90%)#10 |
| 9. | Homer Glen | 290 | 10,249(2.83%)#9 | 33,942(0.85%)#11 |
| 10. | Hickory Hills | 271 | 10,249(2.64%)#10 | 33,942(0.80%)#14 |
| 11. | Joliet | 235 | 10,249(2.29%)#11 | 33,942(0.69%)#16 |
| 12. | Lockport | 229 | 10,249(2.23%)#12 | 33,942(0.67%)#19 |
| 13. | Lisle | 197 | 10,249(1.92%)#13 | 33,942(0.58%)#24 |
| 14. | Oak Lawn | 168 | 10,249(1.64%)#14 | 33,942(0.49%)#31 |
| 15. | St Charles | 150 | 10,249(1.46%)#15 | 33,942(0.44%)#35 |
| 16. | Romeoville | 132 | 10,249(1.29%)#16 | 33,942(0.39%)#38 |
| 17. | Wheeling | 131 | 10,249(1.28%)#17 | 33,942(0.39%)#39 |
| 18. | Willow Springs | 124 | 10,249(1.21%)#18 | 33,942(0.37%)#41 |
| 19. | Villa Park | 118 | 10,249(1.15%)#19 | 33,942(0.35%)#44 |
| 20. | Brookfield | 117 | 10,249(1.14%)#20 | 33,942(0.34%)#46 |
| 21. | Palos Heights | 113 | 10,249(1.10%)#21 | 33,942(0.33%)#50 |
| 22. | Plainfield | 101 | 10,249(0.99%)#22 | 33,942(0.30%)#54 |
| 23. | Aurora | 98 | 10,249(0.96%)#23 | 33,942(0.29%)#56 |
| 24. | Justice | 96 | 10,249(0.94%)#24 | 33,942(0.28%)#60 |
| 25. | Palatine | 83 | 10,249(0.81%)#25 | 33,942(0.24%)#68 |
| 26. | Lake Zurich | 82 | 10,249(0.80%)#26 | 33,942(0.24%)#70 |
| 27. | Hinsdale | 82 | 10,249(0.80%)#27 | 33,942(0.24%)#71 |
| 28. | Schaumburg | 81 | 10,249(0.79%)#28 | 33,942(0.24%)#72 |
| 29. | Tinley Park | 76 | 10,249(0.74%)#29 | 33,942(0.22%)#74 |
| 30. | Chicago Ridge | 75 | 10,249(0.73%)#30 | 33,942(0.22%)#75 |
| 31. | Woodridge | 73 | 10,249(0.71%)#31 | 33,942(0.22%)#80 |
| 32. | Bolingbrook | 71 | 10,249(0.69%)#32 | 33,942(0.21%)#82 |
| 33. | Lombard | 71 | 10,249(0.69%)#33 | 33,942(0.21%)#83 |
| 34. | Skokie | 68 | 10,249(0.66%)#34 | 33,942(0.20%)#88 |
| 35. | Indian Head Park | 68 | 10,249(0.66%)#35 | 33,942(0.20%)#90 |
| 36. | Vernon Hills | 64 | 10,249(0.62%)#36 | 33,942(0.19%)#96 |
| 37. | Bensenville | 64 | 10,249(0.62%)#37 | 33,942(0.19%)#98 |
| 38. | Buffalo Grove | 62 | 10,249(0.60%)#38 | 33,942(0.18%)#101 |
| 39. | Urbana | 60 | 10,249(0.59%)#39 | 33,942(0.18%)#111 |
| 40. | Niles | 53 | 10,249(0.52%)#40 | 33,942(0.16%)#121 |
| 41. | Streamwood | 52 | 10,249(0.51%)#41 | 33,942(0.15%)#125 |
| 42. | Evergreen Park | 50 | 10,249(0.49%)#42 | 33,942(0.15%)#132 |
| 43. | North Aurora | 49 | 10,249(0.48%)#43 | 33,942(0.14%)#135 |
| 44. | Arlington Heights | 46 | 10,249(0.45%)#44 | 33,942(0.14%)#139 |
| 45. | Mundelein | 40 | 10,249(0.39%)#45 | 33,942(0.12%)#161 |
| 46. | Warrenville | 40 | 10,249(0.39%)#46 | 33,942(0.12%)#162 |
| 47. | Morton Grove | 38 | 10,249(0.37%)#47 | 33,942(0.11%)#170 |
| 48. | Highland Park | 37 | 10,249(0.36%)#48 | 33,942(0.11%)#172 |
| 49. | Chicago Heights | 37 | 10,249(0.36%)#49 | 33,942(0.11%)#173 |
| 50. | Lake Barrington | 37 | 10,249(0.36%)#50 | 33,942(0.11%)#178 |
| 51. | Frankfort Square | 36 | 10,249(0.35%)#51 | 33,942(0.11%)#184 |
| 52. | La Grange Park | 35 | 10,249(0.34%)#52 | 33,942(0.10%)#187 |
| 53. | Bloomington | 33 | 10,249(0.32%)#53 | 33,942(0.10%)#195 |
| 54. | Mokena | 32 | 10,249(0.31%)#54 | 33,942(0.09%)#202 |
| 55. | Mount Prospect | 31 | 10,249(0.30%)#55 | 33,942(0.09%)#206 |
| 56. | Oswego | 31 | 10,249(0.30%)#56 | 33,942(0.09%)#207 |
| 57. | Glen Ellyn | 30 | 10,249(0.29%)#57 | 33,942(0.09%)#216 |
| 58. | Itasca | 30 | 10,249(0.29%)#58 | 33,942(0.09%)#219 |
| 59. | Burbank | 29 | 10,249(0.28%)#59 | 33,942(0.09%)#225 |
| 60. | Libertyville | 28 | 10,249(0.27%)#60 | 33,942(0.08%)#235 |
| 61. | Oakbrook Terrace | 28 | 10,249(0.27%)#61 | 33,942(0.08%)#237 |
| 62. | Wheaton | 27 | 10,249(0.26%)#62 | 33,942(0.08%)#239 |
| 63. | Park Ridge | 26 | 10,249(0.25%)#63 | 33,942(0.08%)#251 |
| 64. | La Grange | 25 | 10,249(0.24%)#64 | 33,942(0.07%)#260 |
| 65. | Palos Park | 25 | 10,249(0.24%)#65 | 33,942(0.07%)#263 |
| 66. | Carol Stream | 24 | 10,249(0.23%)#66 | 33,942(0.07%)#265 |
| 67. | Glendale Heights | 24 | 10,249(0.23%)#67 | 33,942(0.07%)#266 |
| 68. | Frankfort | 23 | 10,249(0.22%)#68 | 33,942(0.07%)#275 |
| 69. | Shorewood | 22 | 10,249(0.21%)#69 | 33,942(0.06%)#283 |
| 70. | Prospect Heights | 21 | 10,249(0.20%)#70 | 33,942(0.06%)#292 |
| 71. | Worth | 20 | 10,249(0.20%)#71 | 33,942(0.06%)#303 |
| 72. | Clarendon Hills | 20 | 10,249(0.20%)#72 | 33,942(0.06%)#304 |
| 73. | Rockford | 19 | 10,249(0.19%)#73 | 33,942(0.06%)#311 |
| 74. | Wilmette | 19 | 10,249(0.19%)#74 | 33,942(0.06%)#317 |
| 75. | Summit | 19 | 10,249(0.19%)#75 | 33,942(0.06%)#322 |
| 76. | North Barrington | 19 | 10,249(0.19%)#76 | 33,942(0.06%)#325 |
| 77. | Hanover Park | 18 | 10,249(0.18%)#77 | 33,942(0.05%)#330 |
| 78. | Round Lake Beach | 18 | 10,249(0.18%)#78 | 33,942(0.05%)#332 |
| 79. | Carbondale | 18 | 10,249(0.18%)#79 | 33,942(0.05%)#334 |
| 80. | Orland Hills | 18 | 10,249(0.18%)#80 | 33,942(0.05%)#339 |
| 81. | Channahon | 17 | 10,249(0.17%)#81 | 33,942(0.05%)#345 |
| 82. | Elmhurst | 16 | 10,249(0.16%)#82 | 33,942(0.05%)#361 |
| 83. | Roselle | 16 | 10,249(0.16%)#83 | 33,942(0.05%)#364 |
| 84. | Lyons | 16 | 10,249(0.16%)#84 | 33,942(0.05%)#367 |
| 85. | Pistakee Highlands | 16 | 10,249(0.16%)#85 | 33,942(0.05%)#371 |
| 86. | Lindenhurst | 15 | 10,249(0.15%)#86 | 33,942(0.04%)#383 |
| 87. | Westchester | 14 | 10,249(0.14%)#87 | 33,942(0.04%)#400 |
| 88. | Long Grove | 14 | 10,249(0.14%)#88 | 33,942(0.04%)#403 |
| 89. | Elgin | 13 | 10,249(0.13%)#89 | 33,942(0.04%)#413 |
| 90. | Crestwood | 13 | 10,249(0.13%)#90 | 33,942(0.04%)#429 |
| 91. | Genoa | 13 | 10,249(0.13%)#91 | 33,942(0.04%)#430 |
| 92. | Machesney Park | 12 | 10,249(0.12%)#92 | 33,942(0.04%)#452 |
| 93. | Crete | 12 | 10,249(0.12%)#93 | 33,942(0.04%)#457 |
| 94. | Des Plaines | 11 | 10,249(0.11%)#94 | 33,942(0.03%)#472 |
| 95. | Oak Brook | 10 | 10,249(0.10%)#95 | 33,942(0.03%)#506 |
| 96. | Bloomingdale | 9 | 10,249(0.09%)#96 | 33,942(0.03%)#527 |
| 97. | Lake Forest | 9 | 10,249(0.09%)#97 | 33,942(0.03%)#530 |
| 98. | Bourbonnais | 9 | 10,249(0.09%)#98 | 33,942(0.03%)#532 |
| 99. | Morris | 9 | 10,249(0.09%)#99 | 33,942(0.03%)#536 |
| 100. | Western Springs | 9 | 10,249(0.09%)#100 | 33,942(0.03%)#537 |
Common Questions
What are the Top 10 Cities with the Most Immigrants from Lithuania in Illinois?
Top 10 Cities with the Most Immigrants from Lithuania in Illinois are:
#1
745
#2
661
#3
573
#4
421
#5
379
#6
338
#7
323
#8
304
#9
290
#10
271
What city has the Most Immigrants from Lithuania in Illinois?
Chicago has the Most Immigrants from Lithuania in Illinois with 745.
What is the Total Immigrants from Lithuania in the State of Illinois?
Total Immigrants from Lithuania in Illinois is 10,249.
What is the Total Immigrants from Lithuania in the United States?
Total Immigrants from Lithuania in the United States is 33,942.