Cities with the Most Immigrants from Nicaragua in Illinois
RELATED REPORTS & OPTIONS
Nicaragua
Illinois
Compare Cities
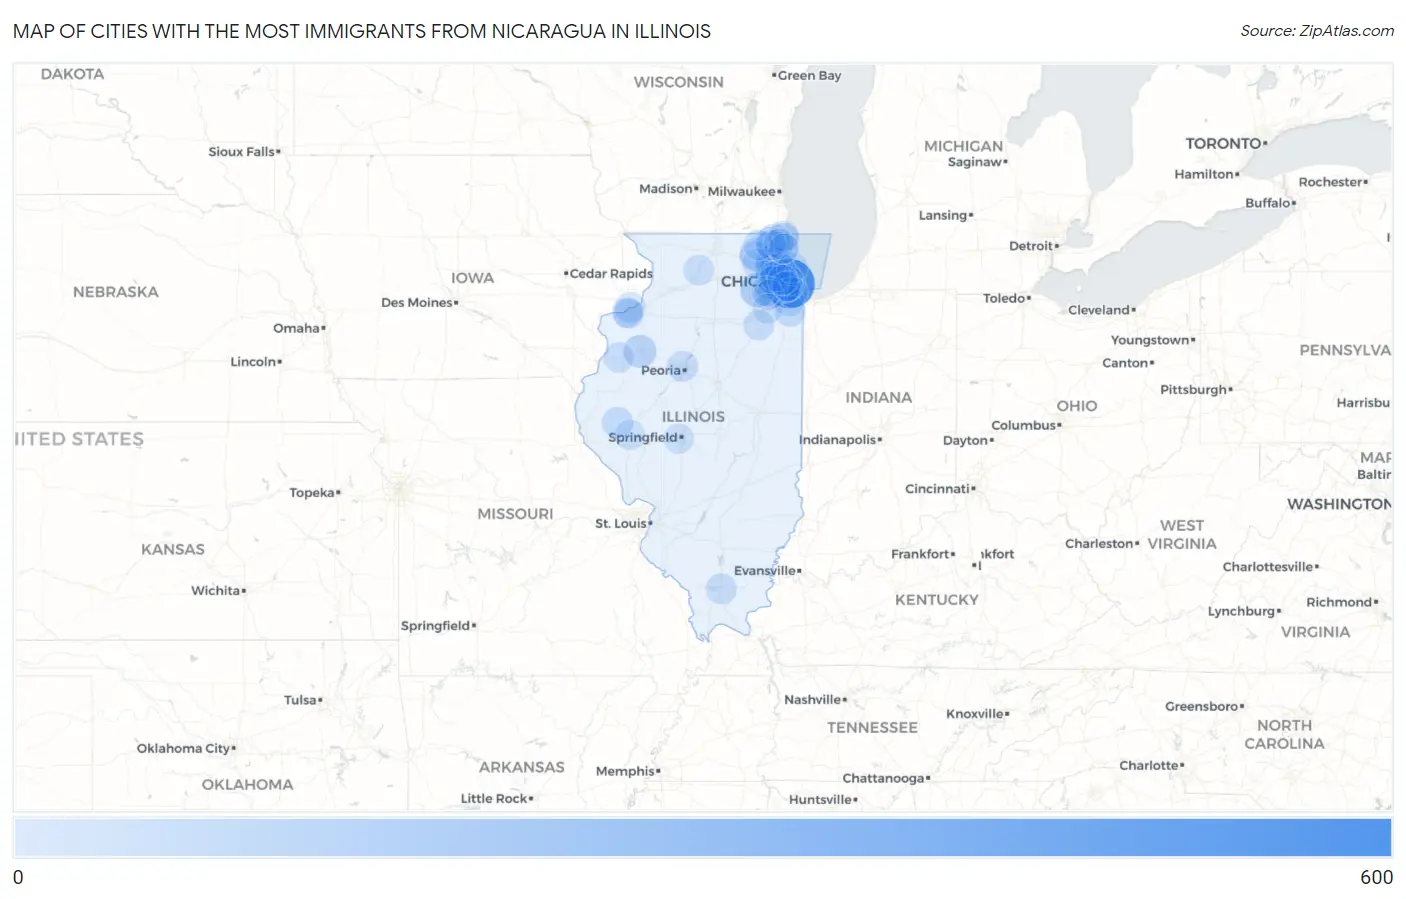
Map of Cities with the Most Immigrants from Nicaragua in Illinois
0
600
Cities with the Most Immigrants from Nicaragua in Illinois
| City | Nicaragua | vs State | vs National | |
| 1. | Chicago | 578 | 1,954(29.58%)#1 | 255,152(0.23%)#66 |
| 2. | Aurora | 121 | 1,954(6.19%)#2 | 255,152(0.05%)#324 |
| 3. | River Grove | 98 | 1,954(5.02%)#3 | 255,152(0.04%)#388 |
| 4. | Cicero | 96 | 1,954(4.91%)#4 | 255,152(0.04%)#398 |
| 5. | Palatine | 91 | 1,954(4.66%)#5 | 255,152(0.04%)#418 |
| 6. | Galesburg | 78 | 1,954(3.99%)#6 | 255,152(0.03%)#471 |
| 7. | Wheaton | 60 | 1,954(3.07%)#7 | 255,152(0.02%)#572 |
| 8. | Arlington Heights | 53 | 1,954(2.71%)#8 | 255,152(0.02%)#627 |
| 9. | Lindenhurst | 45 | 1,954(2.30%)#9 | 255,152(0.02%)#717 |
| 10. | Glendale Heights | 40 | 1,954(2.05%)#10 | 255,152(0.02%)#770 |
| 11. | Elk Grove Village | 40 | 1,954(2.05%)#11 | 255,152(0.02%)#771 |
| 12. | North Chicago | 38 | 1,954(1.94%)#12 | 255,152(0.01%)#793 |
| 13. | Stickney | 33 | 1,954(1.69%)#13 | 255,152(0.01%)#854 |
| 14. | Mount Sterling | 29 | 1,954(1.48%)#14 | 255,152(0.01%)#925 |
| 15. | Crystal Lake | 27 | 1,954(1.38%)#15 | 255,152(0.01%)#956 |
| 16. | Lyons | 27 | 1,954(1.38%)#16 | 255,152(0.01%)#962 |
| 17. | Richton Park | 25 | 1,954(1.28%)#17 | 255,152(0.01%)#998 |
| 18. | Oak Park | 24 | 1,954(1.23%)#18 | 255,152(0.01%)#1,007 |
| 19. | Schaumburg | 23 | 1,954(1.18%)#19 | 255,152(0.01%)#1,023 |
| 20. | Beach Park | 23 | 1,954(1.18%)#20 | 255,152(0.01%)#1,031 |
| 21. | Round Lake Beach | 22 | 1,954(1.13%)#21 | 255,152(0.01%)#1,046 |
| 22. | Peoria | 20 | 1,954(1.02%)#22 | 255,152(0.01%)#1,077 |
| 23. | Rock Island Arsenal | 20 | 1,954(1.02%)#23 | 255,152(0.01%)#1,097 |
| 24. | Oak Forest | 18 | 1,954(0.92%)#24 | 255,152(0.01%)#1,137 |
| 25. | Des Plaines | 17 | 1,954(0.87%)#25 | 255,152(0.01%)#1,155 |
| 26. | Coal City | 17 | 1,954(0.87%)#26 | 255,152(0.01%)#1,177 |
| 27. | Marion | 15 | 1,954(0.77%)#27 | 255,152(0.01%)#1,226 |
| 28. | Summit | 15 | 1,954(0.77%)#28 | 255,152(0.01%)#1,230 |
| 29. | Lombard | 14 | 1,954(0.72%)#29 | 255,152(0.01%)#1,256 |
| 30. | Lake In The Hills | 14 | 1,954(0.72%)#30 | 255,152(0.01%)#1,261 |
| 31. | Zion | 13 | 1,954(0.67%)#31 | 255,152(0.01%)#1,294 |
| 32. | West Dundee | 13 | 1,954(0.67%)#32 | 255,152(0.01%)#1,308 |
| 33. | Oregon | 13 | 1,954(0.67%)#33 | 255,152(0.01%)#1,311 |
| 34. | Woodridge | 12 | 1,954(0.61%)#34 | 255,152(0.00%)#1,326 |
| 35. | Mchenry | 10 | 1,954(0.51%)#35 | 255,152(0.00%)#1,410 |
| 36. | Kirkwood | 10 | 1,954(0.51%)#36 | 255,152(0.00%)#1,443 |
| 37. | Hainesville | 9 | 1,954(0.46%)#37 | 255,152(0.00%)#1,482 |
| 38. | Evanston | 8 | 1,954(0.41%)#38 | 255,152(0.00%)#1,496 |
| 39. | Evergreen Park | 8 | 1,954(0.41%)#39 | 255,152(0.00%)#1,510 |
| 40. | Milan | 8 | 1,954(0.41%)#40 | 255,152(0.00%)#1,520 |
| 41. | Bolingbrook | 7 | 1,954(0.36%)#41 | 255,152(0.00%)#1,533 |
| 42. | Addison | 7 | 1,954(0.36%)#42 | 255,152(0.00%)#1,540 |
| 43. | Gurnee | 7 | 1,954(0.36%)#43 | 255,152(0.00%)#1,543 |
| 44. | Rock Island | 6 | 1,954(0.31%)#44 | 255,152(0.00%)#1,582 |
| 45. | Lake Bluff | 4 | 1,954(0.20%)#45 | 255,152(0.00%)#1,658 |
| 46. | Rockdale | 4 | 1,954(0.20%)#46 | 255,152(0.00%)#1,663 |
| 47. | Leland Grove | 3 | 1,954(0.15%)#47 | 255,152(0.00%)#1,698 |
| 48. | Meredosia | 3 | 1,954(0.15%)#48 | 255,152(0.00%)#1,700 |
| 49. | Naperville | 2 | 1,954(0.10%)#49 | 255,152(0.00%)#1,706 |
| 50. | Forest View | 2 | 1,954(0.10%)#50 | 255,152(0.00%)#1,725 |
| 51. | Bellwood | 1 | 1,954(0.05%)#51 | 255,152(0.00%)#1,740 |
Common Questions
What are the Top 10 Cities with the Most Immigrants from Nicaragua in Illinois?
Top 10 Cities with the Most Immigrants from Nicaragua in Illinois are:
#1
578
#2
121
#3
98
#4
96
#5
91
#6
78
#7
60
#8
53
#9
45
#10
40
What city has the Most Immigrants from Nicaragua in Illinois?
Chicago has the Most Immigrants from Nicaragua in Illinois with 578.
What is the Total Immigrants from Nicaragua in the State of Illinois?
Total Immigrants from Nicaragua in Illinois is 1,954.
What is the Total Immigrants from Nicaragua in the United States?
Total Immigrants from Nicaragua in the United States is 255,152.