Cities with the Highest Percentage of Immigrants from Canada in Illinois
RELATED REPORTS & OPTIONS
Canada
Illinois
Compare Cities
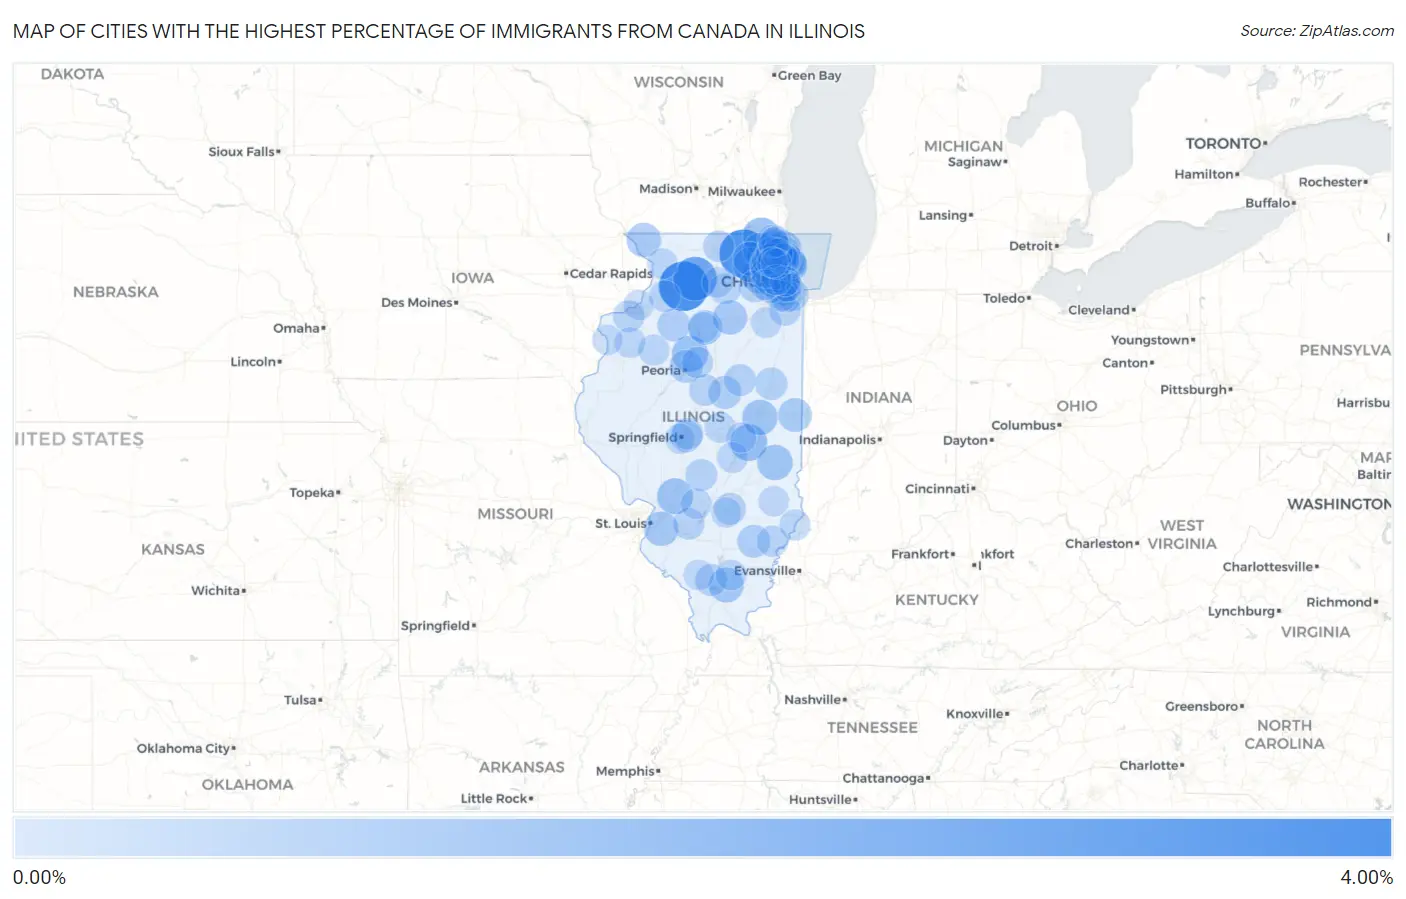
Map of Cities with the Highest Percentage of Immigrants from Canada in Illinois
0.00%
4.00%
Cities with the Highest Percentage of Immigrants from Canada in Illinois
| City | Canada | vs State | vs National | |
| 1. | Nelson | 3.68% | 0.15%(+3.53)#-1 | 0.25%(+3.43)#0 |
| 2. | Union | 3.52% | 0.15%(+3.37)#0 | 0.25%(+3.27)#1 |
| 3. | Grand Detour | 2.65% | 0.15%(+2.50)#1 | 0.25%(+2.40)#2 |
| 4. | Lake Barrington | 1.80% | 0.15%(+1.65)#2 | 0.25%(+1.56)#3 |
| 5. | Spring Grove | 1.51% | 0.15%(+1.36)#3 | 0.25%(+1.26)#4 |
| 6. | Wayne | 1.48% | 0.15%(+1.33)#4 | 0.25%(+1.23)#5 |
| 7. | Arthur | 1.46% | 0.15%(+1.30)#5 | 0.25%(+1.21)#6 |
| 8. | Chillicothe | 1.32% | 0.15%(+1.17)#6 | 0.25%(+1.07)#7 |
| 9. | Williamson | 1.30% | 0.15%(+1.15)#7 | 0.25%(+1.05)#8 |
| 10. | Westfield | 1.19% | 0.15%(+1.04)#8 | 0.25%(+0.945)#9 |
| 11. | Savoy | 1.19% | 0.15%(+1.04)#68 | 0.25%(+0.938)#2,287 |
| 12. | Lake Bluff | 1.17% | 0.15%(+1.01)#102 | 0.25%(+0.918)#2,987 |
| 13. | Pittsburg | 1.10% | 0.15%(+0.953)#103 | 0.25%(+0.856)#2,988 |
| 14. | Pingree Grove | 1.04% | 0.15%(+0.887)#104 | 0.25%(+0.790)#2,989 |
| 15. | Swansea | 1.03% | 0.15%(+0.876)#105 | 0.25%(+0.779)#2,990 |
| 16. | Granville | 1.02% | 0.15%(+0.866)#106 | 0.25%(+0.769)#2,991 |
| 17. | Prairie Grove | 1.02% | 0.15%(+0.865)#107 | 0.25%(+0.769)#2,992 |
| 18. | Dayton | 1.00% | 0.15%(+0.853)#108 | 0.25%(+0.756)#2,993 |
| 19. | The Galena Territory | 1.00% | 0.15%(+0.845)#109 | 0.25%(+0.748)#2,994 |
| 20. | Huntley | 0.91% | 0.15%(+0.760)#110 | 0.25%(+0.663)#2,995 |
| 21. | Tilton | 0.89% | 0.15%(+0.740)#111 | 0.25%(+0.643)#2,996 |
| 22. | Lincolnshire | 0.86% | 0.15%(+0.709)#112 | 0.25%(+0.612)#2,997 |
| 23. | Peoria Heights | 0.81% | 0.15%(+0.664)#113 | 0.25%(+0.567)#2,998 |
| 24. | Indian Head Park | 0.80% | 0.15%(+0.644)#114 | 0.25%(+0.547)#2,999 |
| 25. | Downs | 0.78% | 0.15%(+0.633)#115 | 0.25%(+0.536)#3,000 |
| 26. | Wilmette | 0.78% | 0.15%(+0.633)#116 | 0.25%(+0.536)#3,001 |
| 27. | Fairfield | 0.78% | 0.15%(+0.624)#117 | 0.25%(+0.527)#3,089 |
| 28. | Libertyville | 0.75% | 0.15%(+0.603)#118 | 0.25%(+0.506)#3,090 |
| 29. | Indian Creek | 0.75% | 0.15%(+0.602)#119 | 0.25%(+0.505)#3,091 |
| 30. | South Barrington | 0.74% | 0.15%(+0.589)#120 | 0.25%(+0.492)#3,092 |
| 31. | Neponset | 0.72% | 0.15%(+0.572)#121 | 0.25%(+0.475)#3,093 |
| 32. | Northfield | 0.72% | 0.15%(+0.567)#122 | 0.25%(+0.470)#3,094 |
| 33. | Kenilworth | 0.71% | 0.15%(+0.558)#123 | 0.25%(+0.461)#3,095 |
| 34. | Winnetka | 0.71% | 0.15%(+0.555)#124 | 0.25%(+0.458)#3,096 |
| 35. | Lake Forest | 0.70% | 0.15%(+0.548)#125 | 0.25%(+0.452)#3,097 |
| 36. | Loda | 0.70% | 0.15%(+0.546)#126 | 0.25%(+0.449)#3,098 |
| 37. | Merrionette Park | 0.65% | 0.15%(+0.494)#127 | 0.25%(+0.397)#3,099 |
| 38. | North Aurora | 0.64% | 0.15%(+0.491)#128 | 0.25%(+0.394)#3,100 |
| 39. | Clear Lake | 0.63% | 0.15%(+0.482)#129 | 0.25%(+0.385)#3,101 |
| 40. | Bush | 0.62% | 0.15%(+0.466)#130 | 0.25%(+0.369)#3,102 |
| 41. | River Forest | 0.60% | 0.15%(+0.445)#131 | 0.25%(+0.348)#3,103 |
| 42. | Northbrook | 0.59% | 0.15%(+0.441)#132 | 0.25%(+0.344)#3,104 |
| 43. | Colfax | 0.59% | 0.15%(+0.439)#133 | 0.25%(+0.342)#3,105 |
| 44. | Coalton | 0.58% | 0.15%(+0.432)#134 | 0.25%(+0.335)#3,106 |
| 45. | Western Springs | 0.58% | 0.15%(+0.431)#135 | 0.25%(+0.335)#3,107 |
| 46. | Farina | 0.58% | 0.15%(+0.431)#136 | 0.25%(+0.334)#3,108 |
| 47. | Riverwoods | 0.57% | 0.15%(+0.423)#137 | 0.25%(+0.326)#3,109 |
| 48. | Breese | 0.57% | 0.15%(+0.420)#138 | 0.25%(+0.323)#3,110 |
| 49. | Palos Heights | 0.57% | 0.15%(+0.417)#139 | 0.25%(+0.320)#3,111 |
| 50. | Oak Grove | 0.57% | 0.15%(+0.415)#140 | 0.25%(+0.318)#3,112 |
| 51. | Stanford | 0.56% | 0.15%(+0.414)#141 | 0.25%(+0.317)#3,113 |
| 52. | Lyons | 0.54% | 0.15%(+0.391)#142 | 0.25%(+0.295)#3,114 |
| 53. | Prophetstown | 0.53% | 0.15%(+0.379)#143 | 0.25%(+0.282)#3,115 |
| 54. | Albion | 0.51% | 0.15%(+0.364)#144 | 0.25%(+0.267)#3,116 |
| 55. | Riverton | 0.51% | 0.15%(+0.359)#145 | 0.25%(+0.262)#3,117 |
| 56. | Shabbona | 0.51% | 0.15%(+0.356)#146 | 0.25%(+0.259)#3,118 |
| 57. | Hoffman Estates | 0.50% | 0.15%(+0.353)#147 | 0.25%(+0.256)#3,119 |
| 58. | Frankfort | 0.50% | 0.15%(+0.352)#148 | 0.25%(+0.255)#3,120 |
| 59. | Metamora | 0.49% | 0.15%(+0.341)#149 | 0.25%(+0.244)#3,121 |
| 60. | Carol Stream | 0.49% | 0.15%(+0.338)#150 | 0.25%(+0.241)#3,122 |
| 61. | Lisle | 0.47% | 0.15%(+0.317)#151 | 0.25%(+0.220)#3,123 |
| 62. | Loves Park | 0.47% | 0.15%(+0.315)#152 | 0.25%(+0.218)#3,124 |
| 63. | St Francisville | 0.45% | 0.15%(+0.297)#153 | 0.25%(+0.200)#3,125 |
| 64. | Oak Run | 0.45% | 0.15%(+0.294)#154 | 0.25%(+0.198)#3,126 |
| 65. | Glen Ellyn | 0.44% | 0.15%(+0.290)#155 | 0.25%(+0.193)#3,127 |
| 66. | Forsyth | 0.44% | 0.15%(+0.290)#156 | 0.25%(+0.193)#3,128 |
| 67. | Greenville | 0.44% | 0.15%(+0.284)#157 | 0.25%(+0.187)#3,129 |
| 68. | Wilmington | 0.43% | 0.15%(+0.283)#158 | 0.25%(+0.186)#3,130 |
| 69. | Deer Park | 0.43% | 0.15%(+0.282)#159 | 0.25%(+0.185)#3,131 |
| 70. | Findlay | 0.43% | 0.15%(+0.279)#160 | 0.25%(+0.182)#3,132 |
| 71. | Alexis | 0.42% | 0.15%(+0.268)#161 | 0.25%(+0.171)#3,133 |
| 72. | Palos Park | 0.41% | 0.15%(+0.262)#162 | 0.25%(+0.165)#3,134 |
| 73. | Hanover Park | 0.41% | 0.15%(+0.260)#163 | 0.25%(+0.163)#3,135 |
| 74. | Wood Dale | 0.41% | 0.15%(+0.259)#164 | 0.25%(+0.162)#3,136 |
| 75. | Barrington | 0.41% | 0.15%(+0.258)#165 | 0.25%(+0.161)#3,137 |
| 76. | Highland Park | 0.39% | 0.15%(+0.239)#166 | 0.25%(+0.142)#3,138 |
| 77. | Grayslake | 0.39% | 0.15%(+0.238)#167 | 0.25%(+0.141)#3,139 |
| 78. | Mount Carroll | 0.38% | 0.15%(+0.233)#168 | 0.25%(+0.136)#3,140 |
| 79. | Steward | 0.38% | 0.15%(+0.230)#169 | 0.25%(+0.133)#3,141 |
| 80. | Mark | 0.38% | 0.15%(+0.225)#170 | 0.25%(+0.128)#3,142 |
| 81. | Forest View | 0.37% | 0.15%(+0.220)#171 | 0.25%(+0.123)#3,143 |
| 82. | Thompsonville | 0.37% | 0.15%(+0.216)#172 | 0.25%(+0.119)#3,144 |
| 83. | Venetian Village | 0.37% | 0.15%(+0.216)#173 | 0.25%(+0.119)#3,145 |
| 84. | Hammond | 0.37% | 0.15%(+0.215)#174 | 0.25%(+0.118)#3,146 |
| 85. | Hawthorn Woods | 0.36% | 0.15%(+0.211)#175 | 0.25%(+0.114)#3,147 |
| 86. | Warrenville | 0.36% | 0.15%(+0.207)#176 | 0.25%(+0.110)#3,148 |
| 87. | Deerfield | 0.35% | 0.15%(+0.203)#177 | 0.25%(+0.106)#3,149 |
| 88. | Grandwood Park | 0.35% | 0.15%(+0.201)#178 | 0.25%(+0.104)#3,150 |
| 89. | Keithsburg | 0.35% | 0.15%(+0.200)#179 | 0.25%(+0.103)#3,151 |
| 90. | Ste Marie | 0.35% | 0.15%(+0.195)#180 | 0.25%(+0.098)#3,152 |
| 91. | Kinmundy | 0.34% | 0.15%(+0.192)#181 | 0.25%(+0.095)#3,153 |
| 92. | Vernon Hills | 0.34% | 0.15%(+0.189)#182 | 0.25%(+0.092)#3,154 |
| 93. | Hampton | 0.34% | 0.15%(+0.188)#183 | 0.25%(+0.091)#3,155 |
| 94. | Vergennes | 0.34% | 0.15%(+0.188)#184 | 0.25%(+0.091)#3,156 |
| 95. | Forest Park | 0.33% | 0.15%(+0.180)#185 | 0.25%(+0.084)#3,157 |
| 96. | Villa Park | 0.33% | 0.15%(+0.178)#186 | 0.25%(+0.081)#3,158 |
| 97. | Third Lake | 0.33% | 0.15%(+0.178)#187 | 0.25%(+0.081)#3,159 |
| 98. | Arlington Heights | 0.33% | 0.15%(+0.177)#188 | 0.25%(+0.080)#3,160 |
| 99. | Palatine | 0.33% | 0.15%(+0.176)#189 | 0.25%(+0.079)#3,161 |
| 100. | Jerome | 0.32% | 0.15%(+0.168)#190 | 0.25%(+0.071)#3,162 |
Common Questions
What are the Top 10 Cities with the Highest Percentage of Immigrants from Canada in Illinois?
Top 10 Cities with the Highest Percentage of Immigrants from Canada in Illinois are:
#1
3.68%
#2
3.52%
#3
2.65%
#4
1.80%
#5
1.51%
#6
1.48%
#7
1.46%
#8
1.32%
#9
1.30%
#10
1.19%
What city has the Highest Percentage of Immigrants from Canada in Illinois?
Nelson has the Highest Percentage of Immigrants from Canada in Illinois with 3.68%.
What is the Percentage of Immigrants from Canada in the State of Illinois?
Percentage of Immigrants from Canada in Illinois is 0.15%.
What is the Percentage of Immigrants from Canada in the United States?
Percentage of Immigrants from Canada in the United States is 0.25%.