Cities with the Highest Percentage of Immigrants from South Eastern Asia in Kansas
RELATED REPORTS & OPTIONS
South Eastern Asia
Kansas
Compare Cities
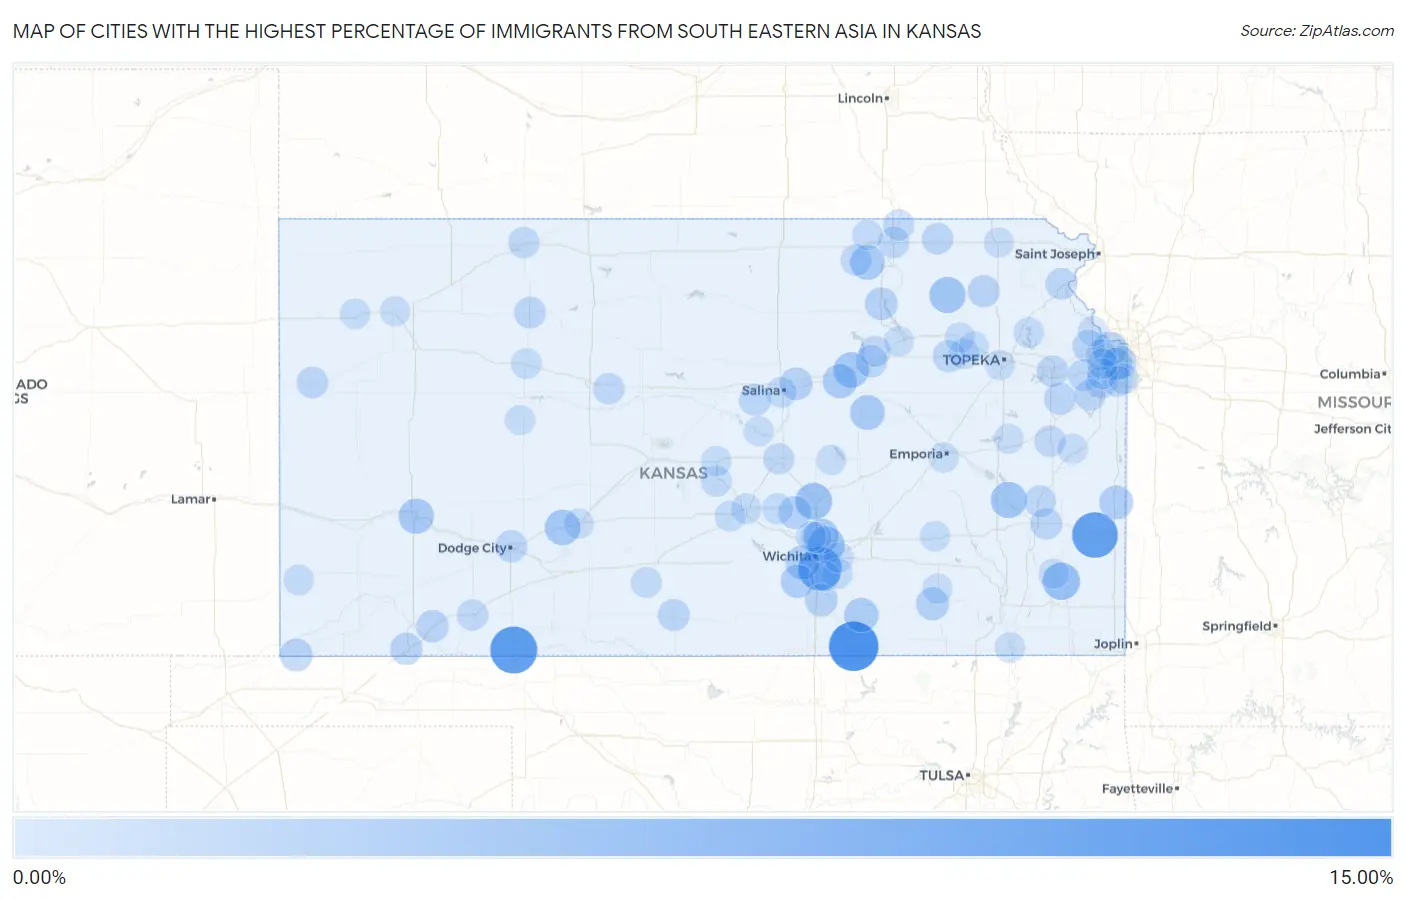
Map of Cities with the Highest Percentage of Immigrants from South Eastern Asia in Kansas
0.00%
15.00%
Cities with the Highest Percentage of Immigrants from South Eastern Asia in Kansas
| City | South Eastern Asia | vs State | vs National | |
| 1. | Parkerfield | 10.82% | 0.90%(+9.92)#-1 | 1.30%(+9.52)#0 |
| 2. | Englewood | 9.41% | 0.90%(+8.51)#0 | 1.30%(+8.12)#1 |
| 3. | Monument | 8.97% | 0.90%(+8.08)#1 | 1.30%(+7.68)#2 |
| 4. | Redfield | 8.70% | 0.90%(+7.80)#2 | 1.30%(+7.40)#3 |
| 5. | Oaklawn Sunview | 7.44% | 0.90%(+6.54)#3 | 1.30%(+6.14)#4 |
| 6. | St Paul | 4.14% | 0.90%(+3.24)#4 | 1.30%(+2.84)#5 |
| 7. | North Newton | 3.75% | 0.90%(+2.85)#5 | 1.30%(+2.46)#6 |
| 8. | Bel Aire | 3.69% | 0.90%(+2.79)#6 | 1.30%(+2.40)#7 |
| 9. | Onaga | 3.40% | 0.90%(+2.50)#7 | 1.30%(+2.10)#8 |
| 10. | Leroy | 3.38% | 0.90%(+2.48)#8 | 1.30%(+2.09)#9 |
| 11. | Offerle | 3.14% | 0.90%(+2.24)#9 | 1.30%(+1.84)#10 |
| 12. | Chapman | 3.07% | 0.90%(+2.17)#10 | 1.30%(+1.77)#11 |
| 13. | Kechi | 2.92% | 0.90%(+2.02)#11 | 1.30%(+1.62)#12 |
| 14. | Garden City | 2.91% | 0.90%(+2.02)#12 | 1.30%(+1.62)#13 |
| 15. | Herington | 2.70% | 0.90%(+1.80)#13 | 1.30%(+1.40)#14 |
| 16. | Barnes | 2.67% | 0.90%(+1.77)#14 | 1.30%(+1.37)#15 |
| 17. | Winfield | 2.47% | 0.90%(+1.57)#15 | 1.30%(+1.17)#16 |
| 18. | Enterprise | 2.44% | 0.90%(+1.54)#16 | 1.30%(+1.14)#17 |
| 19. | Wichita | 2.39% | 0.90%(+1.49)#17 | 1.30%(+1.09)#416 |
| 20. | Kansas City | 2.31% | 0.90%(+1.41)#18 | 1.30%(+1.01)#417 |
| 21. | Prescott | 2.24% | 0.90%(+1.34)#19 | 1.30%(+0.946)#418 |
| 22. | Clearwater | 2.08% | 0.90%(+1.18)#20 | 1.30%(+0.787)#419 |
| 23. | Mission | 1.87% | 0.90%(+0.971)#21 | 1.30%(+0.574)#420 |
| 24. | Halstead | 1.83% | 0.90%(+0.929)#22 | 1.30%(+0.532)#421 |
| 25. | Moline | 1.80% | 0.90%(+0.897)#23 | 1.30%(+0.500)#422 |
| 26. | Elkhart | 1.69% | 0.90%(+0.787)#24 | 1.30%(+0.390)#423 |
| 27. | Belle Plaine | 1.66% | 0.90%(+0.762)#25 | 1.30%(+0.365)#424 |
| 28. | Randolph | 1.65% | 0.90%(+0.749)#26 | 1.30%(+0.352)#425 |
| 29. | New Cambria | 1.64% | 0.90%(+0.740)#27 | 1.30%(+0.343)#426 |
| 30. | Basehor | 1.53% | 0.90%(+0.629)#28 | 1.30%(+0.231)#427 |
| 31. | Kismet | 1.47% | 0.90%(+0.575)#29 | 1.30%(+0.177)#428 |
| 32. | Liberal | 1.37% | 0.90%(+0.473)#30 | 1.30%(+0.075)#429 |
| 33. | Circleville | 1.37% | 0.90%(+0.471)#31 | 1.30%(+0.074)#430 |
| 34. | Dodge City | 1.34% | 0.90%(+0.443)#32 | 1.30%(+0.046)#431 |
| 35. | Paxico | 1.25% | 0.90%(+0.351)#33 | 1.30%(-0.046)#432 |
| 36. | Merriam | 1.25% | 0.90%(+0.348)#34 | 1.30%(-0.050)#433 |
| 37. | Baldwin City | 1.24% | 0.90%(+0.339)#35 | 1.30%(-0.058)#434 |
| 38. | Medicine Lodge | 1.23% | 0.90%(+0.336)#36 | 1.30%(-0.062)#435 |
| 39. | De Soto | 1.23% | 0.90%(+0.333)#37 | 1.30%(-0.064)#436 |
| 40. | Brookville | 1.22% | 0.90%(+0.326)#38 | 1.30%(-0.072)#437 |
| 41. | Junction City | 1.22% | 0.90%(+0.319)#39 | 1.30%(-0.078)#438 |
| 42. | Hill City | 1.13% | 0.90%(+0.231)#40 | 1.30%(-0.166)#439 |
| 43. | Colony | 1.12% | 0.90%(+0.218)#41 | 1.30%(-0.179)#440 |
| 44. | Lawrence | 1.11% | 0.90%(+0.208)#42 | 1.30%(-0.189)#441 |
| 45. | La Harpe | 1.08% | 0.90%(+0.182)#43 | 1.30%(-0.215)#442 |
| 46. | Olathe | 1.04% | 0.90%(+0.138)#44 | 1.30%(-0.259)#443 |
| 47. | Sharon Springs | 1.04% | 0.90%(+0.137)#45 | 1.30%(-0.261)#444 |
| 48. | Axtell | 1.02% | 0.90%(+0.117)#46 | 1.30%(-0.280)#445 |
| 49. | Atchison | 1.02% | 0.90%(+0.116)#47 | 1.30%(-0.281)#446 |
| 50. | Gardner | 1.01% | 0.90%(+0.110)#48 | 1.30%(-0.287)#447 |
| 51. | Victoria | 0.97% | 0.90%(+0.075)#49 | 1.30%(-0.323)#448 |
| 52. | Princeton | 0.96% | 0.90%(+0.063)#50 | 1.30%(-0.335)#449 |
| 53. | Greenleaf | 0.96% | 0.90%(+0.059)#51 | 1.30%(-0.338)#450 |
| 54. | Marysville | 0.94% | 0.90%(+0.038)#52 | 1.30%(-0.359)#451 |
| 55. | Norton | 0.92% | 0.90%(+0.017)#53 | 1.30%(-0.380)#452 |
| 56. | Meade | 0.89% | 0.90%(-0.009)#54 | 1.30%(-0.406)#453 |
| 57. | Mcpherson | 0.86% | 0.90%(-0.039)#55 | 1.30%(-0.436)#454 |
| 58. | Fort Riley | 0.86% | 0.90%(-0.041)#56 | 1.30%(-0.438)#455 |
| 59. | Oketo | 0.84% | 0.90%(-0.059)#57 | 1.30%(-0.456)#456 |
| 60. | Overland Park | 0.84% | 0.90%(-0.063)#58 | 1.30%(-0.460)#457 |
| 61. | Edwardsville | 0.80% | 0.90%(-0.098)#59 | 1.30%(-0.495)#458 |
| 62. | Sterling | 0.80% | 0.90%(-0.101)#60 | 1.30%(-0.499)#459 |
| 63. | Lenexa | 0.77% | 0.90%(-0.132)#61 | 1.30%(-0.529)#460 |
| 64. | Burrton | 0.71% | 0.90%(-0.190)#62 | 1.30%(-0.587)#461 |
| 65. | Salina | 0.69% | 0.90%(-0.212)#63 | 1.30%(-0.609)#462 |
| 66. | Leawood | 0.68% | 0.90%(-0.221)#64 | 1.30%(-0.618)#463 |
| 67. | Coats | 0.66% | 0.90%(-0.241)#65 | 1.30%(-0.638)#464 |
| 68. | Shawnee | 0.66% | 0.90%(-0.243)#66 | 1.30%(-0.640)#465 |
| 69. | Park City | 0.64% | 0.90%(-0.263)#67 | 1.30%(-0.660)#466 |
| 70. | Rose Hill | 0.62% | 0.90%(-0.279)#68 | 1.30%(-0.677)#467 |
| 71. | Wakeeney | 0.61% | 0.90%(-0.288)#69 | 1.30%(-0.686)#468 |
| 72. | Ozawkie | 0.60% | 0.90%(-0.298)#70 | 1.30%(-0.696)#469 |
| 73. | Hanover | 0.58% | 0.90%(-0.321)#71 | 1.30%(-0.718)#470 |
| 74. | Partridge | 0.57% | 0.90%(-0.331)#72 | 1.30%(-0.728)#471 |
| 75. | South Hutchinson | 0.57% | 0.90%(-0.332)#73 | 1.30%(-0.729)#472 |
| 76. | Manter | 0.53% | 0.90%(-0.373)#74 | 1.30%(-0.770)#473 |
| 77. | Maple Hill | 0.52% | 0.90%(-0.374)#75 | 1.30%(-0.772)#474 |
| 78. | Lyons | 0.50% | 0.90%(-0.398)#76 | 1.30%(-0.796)#475 |
| 79. | Eureka | 0.49% | 0.90%(-0.408)#77 | 1.30%(-0.805)#476 |
| 80. | Brewster | 0.48% | 0.90%(-0.415)#78 | 1.30%(-0.812)#477 |
| 81. | St Marys | 0.45% | 0.90%(-0.448)#79 | 1.30%(-0.845)#478 |
| 82. | Derby | 0.45% | 0.90%(-0.453)#80 | 1.30%(-0.850)#479 |
| 83. | Coffeyville | 0.44% | 0.90%(-0.458)#81 | 1.30%(-0.855)#480 |
| 84. | Lane | 0.44% | 0.90%(-0.458)#82 | 1.30%(-0.856)#481 |
| 85. | Erie | 0.43% | 0.90%(-0.469)#83 | 1.30%(-0.867)#482 |
| 86. | Marquette | 0.43% | 0.90%(-0.472)#84 | 1.30%(-0.870)#483 |
| 87. | Topeka | 0.40% | 0.90%(-0.496)#85 | 1.30%(-0.893)#484 |
| 88. | Andover | 0.39% | 0.90%(-0.504)#86 | 1.30%(-0.902)#485 |
| 89. | Colby | 0.39% | 0.90%(-0.510)#87 | 1.30%(-0.908)#486 |
| 90. | Ransom | 0.38% | 0.90%(-0.522)#88 | 1.30%(-0.919)#487 |
| 91. | Rossville | 0.37% | 0.90%(-0.530)#89 | 1.30%(-0.927)#488 |
| 92. | Howard | 0.37% | 0.90%(-0.533)#90 | 1.30%(-0.930)#489 |
| 93. | Kinsley | 0.36% | 0.90%(-0.534)#91 | 1.30%(-0.932)#490 |
| 94. | Manhattan | 0.36% | 0.90%(-0.543)#92 | 1.30%(-0.941)#491 |
| 95. | Emporia | 0.35% | 0.90%(-0.551)#93 | 1.30%(-0.948)#492 |
| 96. | Valley Center | 0.34% | 0.90%(-0.556)#94 | 1.30%(-0.953)#493 |
| 97. | Lansing | 0.34% | 0.90%(-0.561)#95 | 1.30%(-0.959)#494 |
| 98. | Hillsboro | 0.33% | 0.90%(-0.571)#96 | 1.30%(-0.968)#495 |
| 99. | Melvern | 0.31% | 0.90%(-0.588)#97 | 1.30%(-0.986)#496 |
| 100. | Fairview | 0.30% | 0.90%(-0.600)#98 | 1.30%(-0.997)#497 |
Common Questions
What are the Top 10 Cities with the Highest Percentage of Immigrants from South Eastern Asia in Kansas?
Top 10 Cities with the Highest Percentage of Immigrants from South Eastern Asia in Kansas are:
#1
10.82%
#2
9.41%
#3
8.70%
#4
7.44%
#5
4.14%
#6
3.75%
#7
3.69%
#8
3.40%
#9
3.38%
#10
3.14%
What city has the Highest Percentage of Immigrants from South Eastern Asia in Kansas?
Parkerfield has the Highest Percentage of Immigrants from South Eastern Asia in Kansas with 10.82%.
What is the Percentage of Immigrants from South Eastern Asia in the State of Kansas?
Percentage of Immigrants from South Eastern Asia in Kansas is 0.90%.
What is the Percentage of Immigrants from South Eastern Asia in the United States?
Percentage of Immigrants from South Eastern Asia in the United States is 1.30%.