Cities with the Most Immigrants from Asia in Illinois
RELATED REPORTS & OPTIONS
Asia
Illinois
Compare Cities
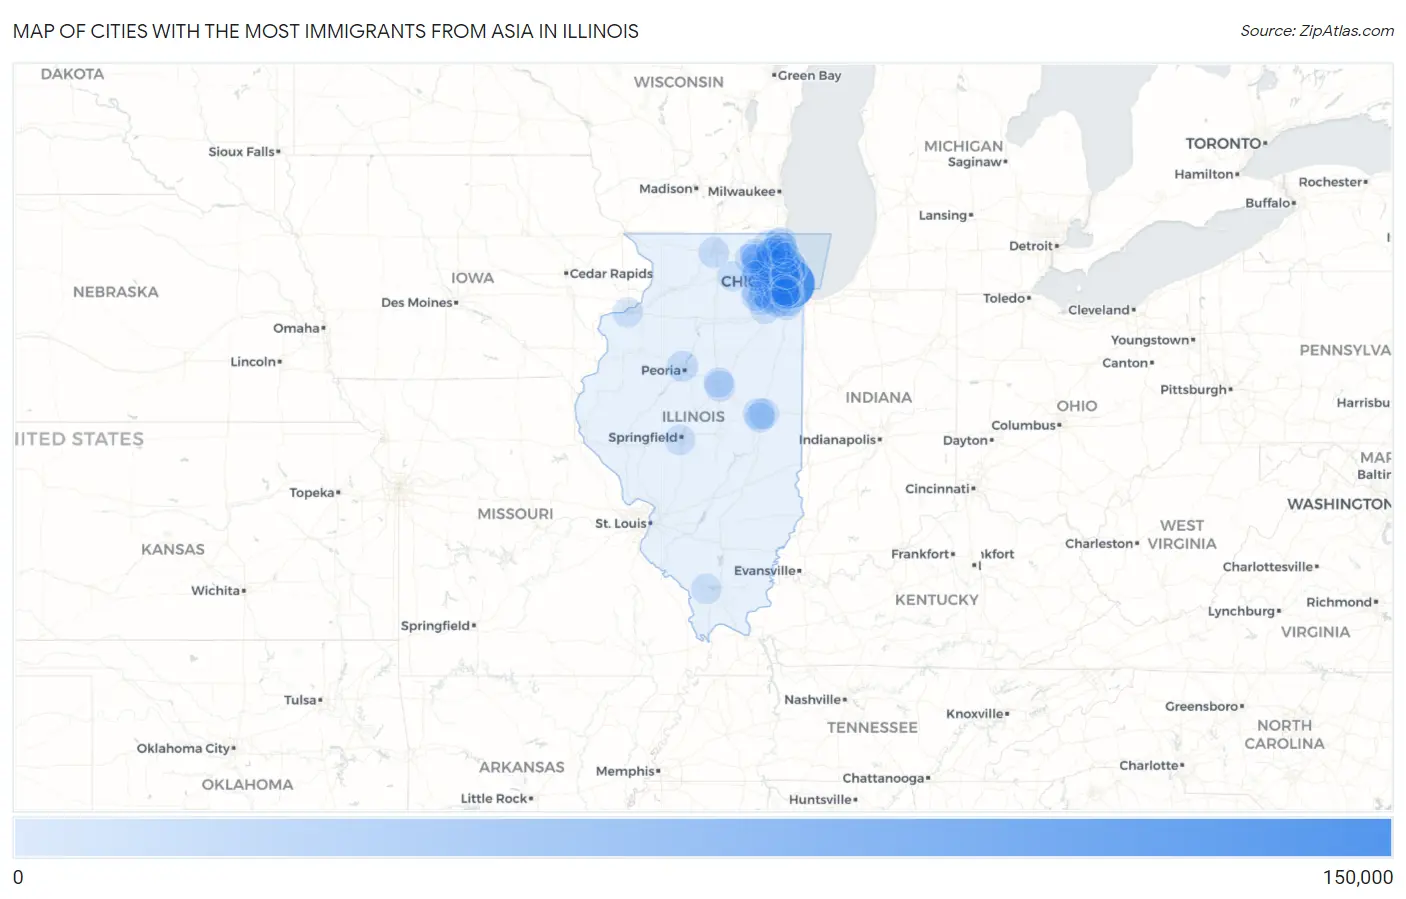
Map of Cities with the Most Immigrants from Asia in Illinois
0
150,000
Cities with the Most Immigrants from Asia in Illinois
| City | Asia | vs State | vs National | |
| 1. | Chicago | 140,551 | 560,341(25.08%)#1 | 14,105,933(1.00%)#6 |
| 2. | Naperville | 21,764 | 560,341(3.88%)#2 | 14,105,933(0.15%)#76 |
| 3. | Skokie | 16,110 | 560,341(2.88%)#3 | 14,105,933(0.11%)#112 |
| 4. | Schaumburg | 14,521 | 560,341(2.59%)#4 | 14,105,933(0.10%)#129 |
| 5. | Aurora | 13,800 | 560,341(2.46%)#5 | 14,105,933(0.10%)#140 |
| 6. | Champaign | 9,859 | 560,341(1.76%)#6 | 14,105,933(0.07%)#204 |
| 7. | Hoffman Estates | 9,527 | 560,341(1.70%)#7 | 14,105,933(0.07%)#208 |
| 8. | Buffalo Grove | 7,929 | 560,341(1.42%)#8 | 14,105,933(0.06%)#258 |
| 9. | Des Plaines | 6,555 | 560,341(1.17%)#9 | 14,105,933(0.05%)#322 |
| 10. | Peoria | 6,211 | 560,341(1.11%)#10 | 14,105,933(0.04%)#339 |
| 11. | Niles | 6,205 | 560,341(1.11%)#11 | 14,105,933(0.04%)#340 |
| 12. | Palatine | 6,096 | 560,341(1.09%)#12 | 14,105,933(0.04%)#348 |
| 13. | Morton Grove | 6,096 | 560,341(1.09%)#13 | 14,105,933(0.04%)#349 |
| 14. | Arlington Heights | 6,007 | 560,341(1.07%)#14 | 14,105,933(0.04%)#353 |
| 15. | Bolingbrook | 6,000 | 560,341(1.07%)#15 | 14,105,933(0.04%)#355 |
| 16. | Mount Prospect | 5,852 | 560,341(1.04%)#16 | 14,105,933(0.04%)#367 |
| 17. | Carol Stream | 5,623 | 560,341(1.00%)#17 | 14,105,933(0.04%)#380 |
| 18. | Bloomington | 5,431 | 560,341(0.97%)#18 | 14,105,933(0.04%)#389 |
| 19. | Wheeling | 5,280 | 560,341(0.94%)#19 | 14,105,933(0.04%)#401 |
| 20. | Hanover Park | 5,192 | 560,341(0.93%)#20 | 14,105,933(0.04%)#406 |
| 21. | Glendale Heights | 5,161 | 560,341(0.92%)#21 | 14,105,933(0.04%)#410 |
| 22. | Glenview | 5,147 | 560,341(0.92%)#22 | 14,105,933(0.04%)#415 |
| 23. | Elgin | 4,992 | 560,341(0.89%)#23 | 14,105,933(0.04%)#426 |
| 24. | Vernon Hills | 4,968 | 560,341(0.89%)#24 | 14,105,933(0.04%)#431 |
| 25. | Waukegan | 4,884 | 560,341(0.87%)#25 | 14,105,933(0.03%)#443 |
| 26. | Evanston | 4,818 | 560,341(0.86%)#26 | 14,105,933(0.03%)#449 |
| 27. | Rockford | 4,708 | 560,341(0.84%)#27 | 14,105,933(0.03%)#460 |
| 28. | Bartlett | 4,640 | 560,341(0.83%)#28 | 14,105,933(0.03%)#466 |
| 29. | Urbana | 4,511 | 560,341(0.81%)#29 | 14,105,933(0.03%)#479 |
| 30. | Streamwood | 4,169 | 560,341(0.74%)#30 | 14,105,933(0.03%)#510 |
| 31. | Northbrook | 3,789 | 560,341(0.68%)#31 | 14,105,933(0.03%)#556 |
| 32. | Orland Park | 3,722 | 560,341(0.66%)#32 | 14,105,933(0.03%)#569 |
| 33. | Lombard | 3,620 | 560,341(0.65%)#33 | 14,105,933(0.03%)#587 |
| 34. | Westmont | 3,196 | 560,341(0.57%)#34 | 14,105,933(0.02%)#650 |
| 35. | Oak Lawn | 3,032 | 560,341(0.54%)#35 | 14,105,933(0.02%)#681 |
| 36. | Woodridge | 2,955 | 560,341(0.53%)#36 | 14,105,933(0.02%)#694 |
| 37. | Wheaton | 2,898 | 560,341(0.52%)#37 | 14,105,933(0.02%)#706 |
| 38. | Mundelein | 2,758 | 560,341(0.49%)#38 | 14,105,933(0.02%)#742 |
| 39. | Gurnee | 2,726 | 560,341(0.49%)#39 | 14,105,933(0.02%)#748 |
| 40. | Lincolnwood | 2,662 | 560,341(0.48%)#40 | 14,105,933(0.02%)#770 |
| 41. | Elk Grove Village | 2,660 | 560,341(0.47%)#41 | 14,105,933(0.02%)#771 |
| 42. | Rolling Meadows | 2,594 | 560,341(0.46%)#42 | 14,105,933(0.02%)#779 |
| 43. | Plainfield | 2,586 | 560,341(0.46%)#43 | 14,105,933(0.02%)#784 |
| 44. | Lisle | 2,509 | 560,341(0.45%)#44 | 14,105,933(0.02%)#803 |
| 45. | Springfield | 2,413 | 560,341(0.43%)#45 | 14,105,933(0.02%)#826 |
| 46. | Addison | 2,351 | 560,341(0.42%)#46 | 14,105,933(0.02%)#843 |
| 47. | Downers Grove | 2,328 | 560,341(0.42%)#47 | 14,105,933(0.02%)#851 |
| 48. | Round Lake | 2,305 | 560,341(0.41%)#48 | 14,105,933(0.02%)#861 |
| 49. | Wilmette | 2,219 | 560,341(0.40%)#49 | 14,105,933(0.02%)#887 |
| 50. | Tinley Park | 2,192 | 560,341(0.39%)#50 | 14,105,933(0.02%)#893 |
| 51. | Chicago Ridge | 2,121 | 560,341(0.38%)#51 | 14,105,933(0.02%)#919 |
| 52. | Bloomingdale | 2,089 | 560,341(0.37%)#52 | 14,105,933(0.01%)#933 |
| 53. | Oak Park | 2,048 | 560,341(0.37%)#53 | 14,105,933(0.01%)#950 |
| 54. | Elmhurst | 2,016 | 560,341(0.36%)#54 | 14,105,933(0.01%)#957 |
| 55. | Darien | 1,979 | 560,341(0.35%)#55 | 14,105,933(0.01%)#983 |
| 56. | Roselle | 1,976 | 560,341(0.35%)#56 | 14,105,933(0.01%)#985 |
| 57. | West Chicago | 1,906 | 560,341(0.34%)#57 | 14,105,933(0.01%)#1,016 |
| 58. | Romeoville | 1,889 | 560,341(0.34%)#58 | 14,105,933(0.01%)#1,027 |
| 59. | Glen Ellyn | 1,798 | 560,341(0.32%)#59 | 14,105,933(0.01%)#1,057 |
| 60. | Joliet | 1,718 | 560,341(0.31%)#60 | 14,105,933(0.01%)#1,094 |
| 61. | Carpentersville | 1,693 | 560,341(0.30%)#61 | 14,105,933(0.01%)#1,111 |
| 62. | Carbondale | 1,686 | 560,341(0.30%)#62 | 14,105,933(0.01%)#1,115 |
| 63. | Dekalb | 1,669 | 560,341(0.30%)#63 | 14,105,933(0.01%)#1,127 |
| 64. | Park Ridge | 1,668 | 560,341(0.30%)#64 | 14,105,933(0.01%)#1,130 |
| 65. | Oak Brook | 1,640 | 560,341(0.29%)#65 | 14,105,933(0.01%)#1,143 |
| 66. | Berwyn | 1,526 | 560,341(0.27%)#66 | 14,105,933(0.01%)#1,202 |
| 67. | South Elgin | 1,446 | 560,341(0.26%)#67 | 14,105,933(0.01%)#1,254 |
| 68. | Burr Ridge | 1,401 | 560,341(0.25%)#68 | 14,105,933(0.01%)#1,286 |
| 69. | Oak Forest | 1,386 | 560,341(0.25%)#69 | 14,105,933(0.01%)#1,294 |
| 70. | Hinsdale | 1,293 | 560,341(0.23%)#70 | 14,105,933(0.01%)#1,351 |
| 71. | Worth | 1,281 | 560,341(0.23%)#71 | 14,105,933(0.01%)#1,357 |
| 72. | Lincolnshire | 1,252 | 560,341(0.22%)#72 | 14,105,933(0.01%)#1,373 |
| 73. | Normal | 1,248 | 560,341(0.22%)#73 | 14,105,933(0.01%)#1,375 |
| 74. | South Barrington | 1,225 | 560,341(0.22%)#74 | 14,105,933(0.01%)#1,398 |
| 75. | Burbank | 1,219 | 560,341(0.22%)#75 | 14,105,933(0.01%)#1,404 |
| 76. | Hickory Hills | 1,194 | 560,341(0.21%)#76 | 14,105,933(0.01%)#1,419 |
| 77. | Prospect Heights | 1,124 | 560,341(0.20%)#77 | 14,105,933(0.01%)#1,476 |
| 78. | Itasca | 1,092 | 560,341(0.19%)#78 | 14,105,933(0.01%)#1,507 |
| 79. | Lake Zurich | 1,086 | 560,341(0.19%)#79 | 14,105,933(0.01%)#1,515 |
| 80. | Inverness | 1,086 | 560,341(0.19%)#80 | 14,105,933(0.01%)#1,516 |
| 81. | Lake In The Hills | 1,084 | 560,341(0.19%)#81 | 14,105,933(0.01%)#1,519 |
| 82. | Norridge | 1,066 | 560,341(0.19%)#82 | 14,105,933(0.01%)#1,534 |
| 83. | Crystal Lake | 1,044 | 560,341(0.19%)#83 | 14,105,933(0.01%)#1,549 |
| 84. | Elmwood Park | 1,042 | 560,341(0.19%)#84 | 14,105,933(0.01%)#1,551 |
| 85. | Rock Island | 1,040 | 560,341(0.19%)#85 | 14,105,933(0.01%)#1,554 |
| 86. | Huntley | 1,024 | 560,341(0.18%)#86 | 14,105,933(0.01%)#1,566 |
| 87. | Algonquin | 1,018 | 560,341(0.18%)#87 | 14,105,933(0.01%)#1,567 |
| 88. | St Charles | 1,011 | 560,341(0.18%)#88 | 14,105,933(0.01%)#1,578 |
| 89. | Savoy | 992 | 560,341(0.18%)#89 | 14,105,933(0.01%)#1,598 |
| 90. | Palos Hills | 988 | 560,341(0.18%)#90 | 14,105,933(0.01%)#1,604 |
| 91. | Justice | 962 | 560,341(0.17%)#91 | 14,105,933(0.01%)#1,648 |
| 92. | Harwood Heights | 926 | 560,341(0.17%)#92 | 14,105,933(0.01%)#1,688 |
| 93. | Libertyville | 923 | 560,341(0.16%)#93 | 14,105,933(0.01%)#1,692 |
| 94. | Oswego | 920 | 560,341(0.16%)#94 | 14,105,933(0.01%)#1,695 |
| 95. | Lake Forest | 913 | 560,341(0.16%)#95 | 14,105,933(0.01%)#1,706 |
| 96. | Bridgeview | 900 | 560,341(0.16%)#96 | 14,105,933(0.01%)#1,726 |
| 97. | Hawthorn Woods | 880 | 560,341(0.16%)#97 | 14,105,933(0.01%)#1,748 |
| 98. | North Chicago | 873 | 560,341(0.16%)#98 | 14,105,933(0.01%)#1,759 |
| 99. | Highland Park | 867 | 560,341(0.15%)#99 | 14,105,933(0.01%)#1,771 |
| 100. | Homer Glen | 856 | 560,341(0.15%)#100 | 14,105,933(0.01%)#1,783 |
Common Questions
What are the Top 10 Cities with the Most Immigrants from Asia in Illinois?
Top 10 Cities with the Most Immigrants from Asia in Illinois are:
#1
140,551
#2
21,764
#3
16,110
#4
14,521
#5
13,800
#6
9,859
#7
9,527
#8
7,929
#9
6,555
#10
6,211
What city has the Most Immigrants from Asia in Illinois?
Chicago has the Most Immigrants from Asia in Illinois with 140,551.
What is the Total Immigrants from Asia in the State of Illinois?
Total Immigrants from Asia in Illinois is 560,341.
What is the Total Immigrants from Asia in the United States?
Total Immigrants from Asia in the United States is 14,105,933.