Cities with the Most Immigrants from Thailand in Illinois
RELATED REPORTS & OPTIONS
Thailand
Illinois
Compare Cities
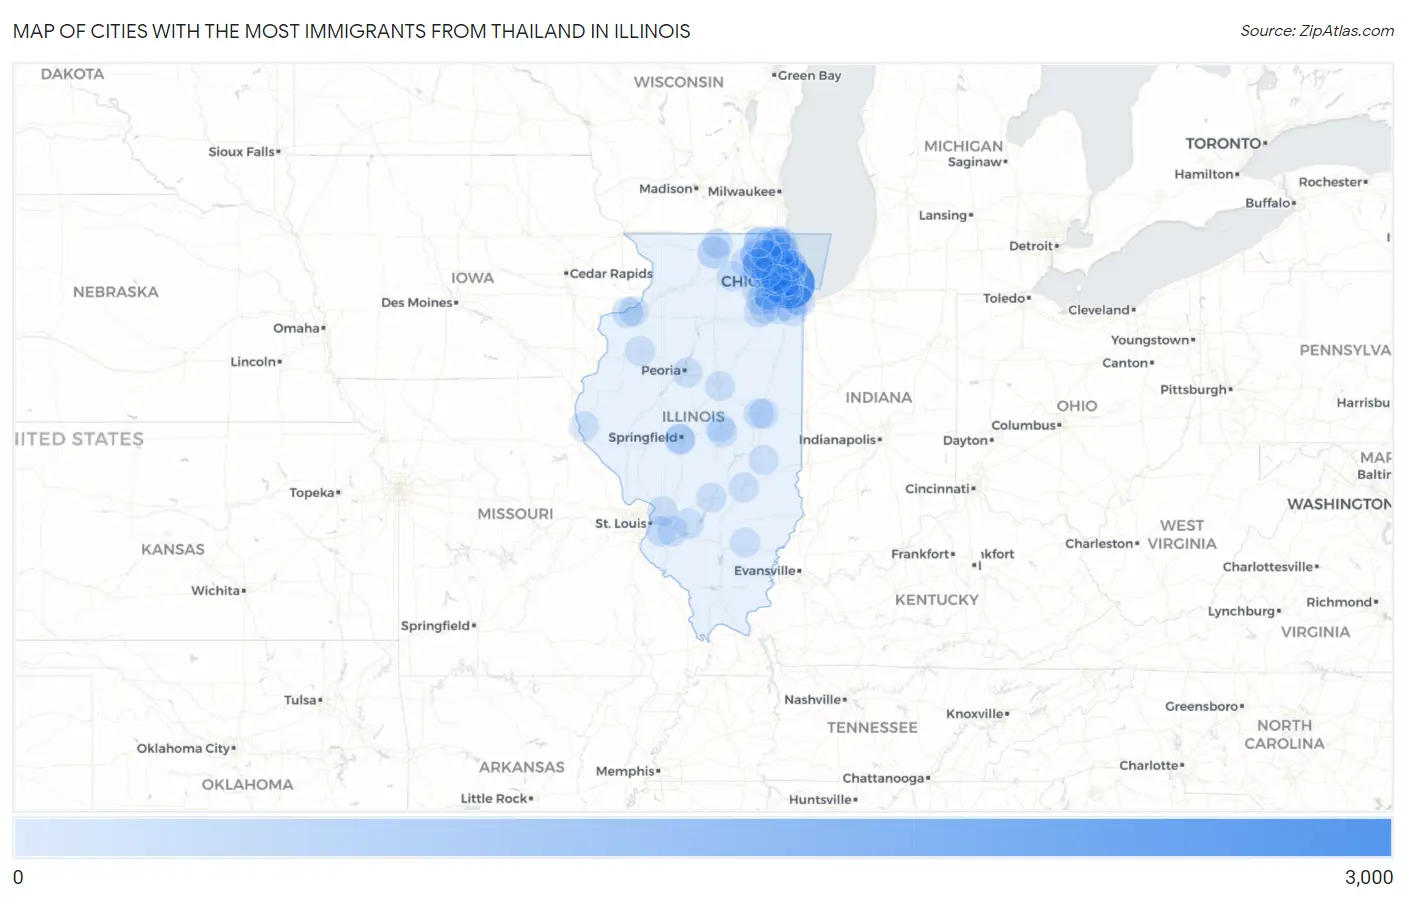
Map of Cities with the Most Immigrants from Thailand in Illinois
0
3,000
Cities with the Most Immigrants from Thailand in Illinois
| City | Thailand | vs State | vs National | |
| 1. | Chicago | 2,925 | 7,323(39.94%)#1 | 256,546(1.14%)#6 |
| 2. | Rockford | 297 | 7,323(4.06%)#2 | 256,546(0.12%)#117 |
| 3. | Morton Grove | 280 | 7,323(3.82%)#3 | 256,546(0.11%)#121 |
| 4. | Naperville | 197 | 7,323(2.69%)#4 | 256,546(0.08%)#192 |
| 5. | Lake Bluff | 163 | 7,323(2.23%)#5 | 256,546(0.06%)#238 |
| 6. | Aurora | 132 | 7,323(1.80%)#6 | 256,546(0.05%)#302 |
| 7. | Rock Island | 122 | 7,323(1.67%)#7 | 256,546(0.05%)#337 |
| 8. | Glenview | 108 | 7,323(1.47%)#8 | 256,546(0.04%)#391 |
| 9. | Des Plaines | 106 | 7,323(1.45%)#9 | 256,546(0.04%)#401 |
| 10. | Waukegan | 100 | 7,323(1.37%)#10 | 256,546(0.04%)#430 |
| 11. | Park Ridge | 81 | 7,323(1.11%)#11 | 256,546(0.03%)#540 |
| 12. | Skokie | 79 | 7,323(1.08%)#12 | 256,546(0.03%)#548 |
| 13. | Oak Park | 76 | 7,323(1.04%)#13 | 256,546(0.03%)#563 |
| 14. | Lincolnwood | 73 | 7,323(1.00%)#14 | 256,546(0.03%)#591 |
| 15. | Springfield | 67 | 7,323(0.91%)#15 | 256,546(0.03%)#627 |
| 16. | Elgin | 66 | 7,323(0.90%)#16 | 256,546(0.03%)#637 |
| 17. | La Grange Park | 66 | 7,323(0.90%)#17 | 256,546(0.03%)#644 |
| 18. | Glen Ellyn | 63 | 7,323(0.86%)#18 | 256,546(0.02%)#668 |
| 19. | Mundelein | 58 | 7,323(0.79%)#19 | 256,546(0.02%)#743 |
| 20. | Mascoutah | 57 | 7,323(0.78%)#20 | 256,546(0.02%)#751 |
| 21. | Itasca | 55 | 7,323(0.75%)#21 | 256,546(0.02%)#769 |
| 22. | Tinley Park | 54 | 7,323(0.74%)#22 | 256,546(0.02%)#778 |
| 23. | Champaign | 52 | 7,323(0.71%)#23 | 256,546(0.02%)#807 |
| 24. | Wheaton | 50 | 7,323(0.68%)#24 | 256,546(0.02%)#834 |
| 25. | Chicago Ridge | 46 | 7,323(0.63%)#25 | 256,546(0.02%)#891 |
| 26. | Hoffman Estates | 45 | 7,323(0.61%)#26 | 256,546(0.02%)#898 |
| 27. | Evanston | 43 | 7,323(0.59%)#27 | 256,546(0.02%)#928 |
| 28. | Roselle | 42 | 7,323(0.57%)#28 | 256,546(0.02%)#951 |
| 29. | Machesney Park | 42 | 7,323(0.57%)#29 | 256,546(0.02%)#952 |
| 30. | Calumet City | 41 | 7,323(0.56%)#30 | 256,546(0.02%)#967 |
| 31. | Plainfield | 40 | 7,323(0.55%)#31 | 256,546(0.02%)#979 |
| 32. | Darien | 40 | 7,323(0.55%)#32 | 256,546(0.02%)#987 |
| 33. | Northbrook | 38 | 7,323(0.52%)#33 | 256,546(0.01%)#1,026 |
| 34. | Joliet | 37 | 7,323(0.51%)#34 | 256,546(0.01%)#1,035 |
| 35. | Carpentersville | 37 | 7,323(0.51%)#35 | 256,546(0.01%)#1,044 |
| 36. | Vernon Hills | 37 | 7,323(0.51%)#36 | 256,546(0.01%)#1,047 |
| 37. | Hampshire | 36 | 7,323(0.49%)#37 | 256,546(0.01%)#1,073 |
| 38. | Berwyn | 35 | 7,323(0.48%)#38 | 256,546(0.01%)#1,083 |
| 39. | Carol Stream | 35 | 7,323(0.48%)#39 | 256,546(0.01%)#1,085 |
| 40. | South Elgin | 34 | 7,323(0.46%)#40 | 256,546(0.01%)#1,110 |
| 41. | Palos Hills | 34 | 7,323(0.46%)#41 | 256,546(0.01%)#1,113 |
| 42. | Northlake | 33 | 7,323(0.45%)#42 | 256,546(0.01%)#1,143 |
| 43. | Arlington Heights | 31 | 7,323(0.42%)#43 | 256,546(0.01%)#1,167 |
| 44. | Dekalb | 31 | 7,323(0.42%)#44 | 256,546(0.01%)#1,173 |
| 45. | Streamwood | 31 | 7,323(0.42%)#45 | 256,546(0.01%)#1,174 |
| 46. | Gurnee | 31 | 7,323(0.42%)#46 | 256,546(0.01%)#1,175 |
| 47. | Minooka | 31 | 7,323(0.42%)#47 | 256,546(0.01%)#1,184 |
| 48. | Westmont | 30 | 7,323(0.41%)#48 | 256,546(0.01%)#1,196 |
| 49. | Glendale Heights | 29 | 7,323(0.40%)#49 | 256,546(0.01%)#1,226 |
| 50. | Buffalo Grove | 28 | 7,323(0.38%)#50 | 256,546(0.01%)#1,251 |
| 51. | Riverside | 28 | 7,323(0.38%)#51 | 256,546(0.01%)#1,263 |
| 52. | South Barrington | 27 | 7,323(0.37%)#52 | 256,546(0.01%)#1,299 |
| 53. | Belleville | 26 | 7,323(0.36%)#53 | 256,546(0.01%)#1,316 |
| 54. | Wheeling | 26 | 7,323(0.36%)#54 | 256,546(0.01%)#1,317 |
| 55. | Hinsdale | 25 | 7,323(0.34%)#55 | 256,546(0.01%)#1,363 |
| 56. | Johnsburg | 25 | 7,323(0.34%)#56 | 256,546(0.01%)#1,374 |
| 57. | Crystal Lake | 24 | 7,323(0.33%)#57 | 256,546(0.01%)#1,388 |
| 58. | Urbana | 24 | 7,323(0.33%)#58 | 256,546(0.01%)#1,389 |
| 59. | Breese | 24 | 7,323(0.33%)#59 | 256,546(0.01%)#1,410 |
| 60. | Highland Park | 23 | 7,323(0.31%)#60 | 256,546(0.01%)#1,428 |
| 61. | Cicero | 22 | 7,323(0.30%)#61 | 256,546(0.01%)#1,454 |
| 62. | Lake In The Hills | 22 | 7,323(0.30%)#62 | 256,546(0.01%)#1,473 |
| 63. | Prospect Heights | 22 | 7,323(0.30%)#63 | 256,546(0.01%)#1,482 |
| 64. | West Dundee | 20 | 7,323(0.27%)#64 | 256,546(0.01%)#1,572 |
| 65. | Schaumburg | 18 | 7,323(0.25%)#65 | 256,546(0.01%)#1,628 |
| 66. | Moline | 17 | 7,323(0.23%)#66 | 256,546(0.01%)#1,675 |
| 67. | Edwardsville | 17 | 7,323(0.23%)#67 | 256,546(0.01%)#1,682 |
| 68. | Decatur | 15 | 7,323(0.20%)#68 | 256,546(0.01%)#1,778 |
| 69. | Burbank | 15 | 7,323(0.20%)#69 | 256,546(0.01%)#1,787 |
| 70. | Round Lake Beach | 15 | 7,323(0.20%)#70 | 256,546(0.01%)#1,789 |
| 71. | Lake Zurich | 14 | 7,323(0.19%)#71 | 256,546(0.01%)#1,855 |
| 72. | Justice | 14 | 7,323(0.19%)#72 | 256,546(0.01%)#1,865 |
| 73. | Quincy | 13 | 7,323(0.18%)#73 | 256,546(0.01%)#1,905 |
| 74. | Effingham | 13 | 7,323(0.18%)#74 | 256,546(0.01%)#1,926 |
| 75. | Romeoville | 12 | 7,323(0.16%)#75 | 256,546(0.00%)#1,978 |
| 76. | Knollwood | 12 | 7,323(0.16%)#76 | 256,546(0.00%)#2,024 |
| 77. | Bolingbrook | 11 | 7,323(0.15%)#77 | 256,546(0.00%)#2,036 |
| 78. | Grandwood Park | 10 | 7,323(0.14%)#78 | 256,546(0.00%)#2,170 |
| 79. | Sims | 10 | 7,323(0.14%)#79 | 256,546(0.00%)#2,190 |
| 80. | Addison | 9 | 7,323(0.12%)#80 | 256,546(0.00%)#2,202 |
| 81. | New Lenox | 9 | 7,323(0.12%)#81 | 256,546(0.00%)#2,211 |
| 82. | Deerfield | 9 | 7,323(0.12%)#82 | 256,546(0.00%)#2,223 |
| 83. | Forest Park | 9 | 7,323(0.12%)#83 | 256,546(0.00%)#2,234 |
| 84. | Forsyth | 9 | 7,323(0.12%)#84 | 256,546(0.00%)#2,256 |
| 85. | Bloomington | 8 | 7,323(0.11%)#85 | 256,546(0.00%)#2,286 |
| 86. | Jerome | 8 | 7,323(0.11%)#86 | 256,546(0.00%)#2,347 |
| 87. | Gages Lake | 7 | 7,323(0.10%)#87 | 256,546(0.00%)#2,399 |
| 88. | Kenilworth | 7 | 7,323(0.10%)#88 | 256,546(0.00%)#2,429 |
| 89. | Tower Lakes | 7 | 7,323(0.10%)#89 | 256,546(0.00%)#2,438 |
| 90. | Hanover Park | 6 | 7,323(0.08%)#90 | 256,546(0.00%)#2,467 |
| 91. | East Peoria | 6 | 7,323(0.08%)#91 | 256,546(0.00%)#2,475 |
| 92. | Charleston | 6 | 7,323(0.08%)#92 | 256,546(0.00%)#2,485 |
| 93. | Lake Barrington | 6 | 7,323(0.08%)#93 | 256,546(0.00%)#2,508 |
| 94. | Sleepy Hollow | 6 | 7,323(0.08%)#94 | 256,546(0.00%)#2,519 |
| 95. | Park Forest | 5 | 7,323(0.07%)#95 | 256,546(0.00%)#2,572 |
| 96. | Galesburg | 4 | 7,323(0.05%)#96 | 256,546(0.00%)#2,644 |
| 97. | Villa Park | 4 | 7,323(0.05%)#97 | 256,546(0.00%)#2,649 |
| 98. | Dolton | 4 | 7,323(0.05%)#98 | 256,546(0.00%)#2,651 |
| 99. | Vandalia | 3 | 7,323(0.04%)#99 | 256,546(0.00%)#2,737 |
| 100. | Mccullom Lake | 3 | 7,323(0.04%)#100 | 256,546(0.00%)#2,775 |
Common Questions
What are the Top 10 Cities with the Most Immigrants from Thailand in Illinois?
Top 10 Cities with the Most Immigrants from Thailand in Illinois are:
#1
2,925
#2
297
#3
280
#4
197
#5
163
#6
132
#7
122
#8
108
#9
106
#10
100
What city has the Most Immigrants from Thailand in Illinois?
Chicago has the Most Immigrants from Thailand in Illinois with 2,925.
What is the Total Immigrants from Thailand in the State of Illinois?
Total Immigrants from Thailand in Illinois is 7,323.
What is the Total Immigrants from Thailand in the United States?
Total Immigrants from Thailand in the United States is 256,546.