Cities with the Highest Percentage of Population with a Degree in Visual and Performing Arts in Illinois
RELATED REPORTS & OPTIONS
Visual and Performing Arts
Illinois
Compare Cities
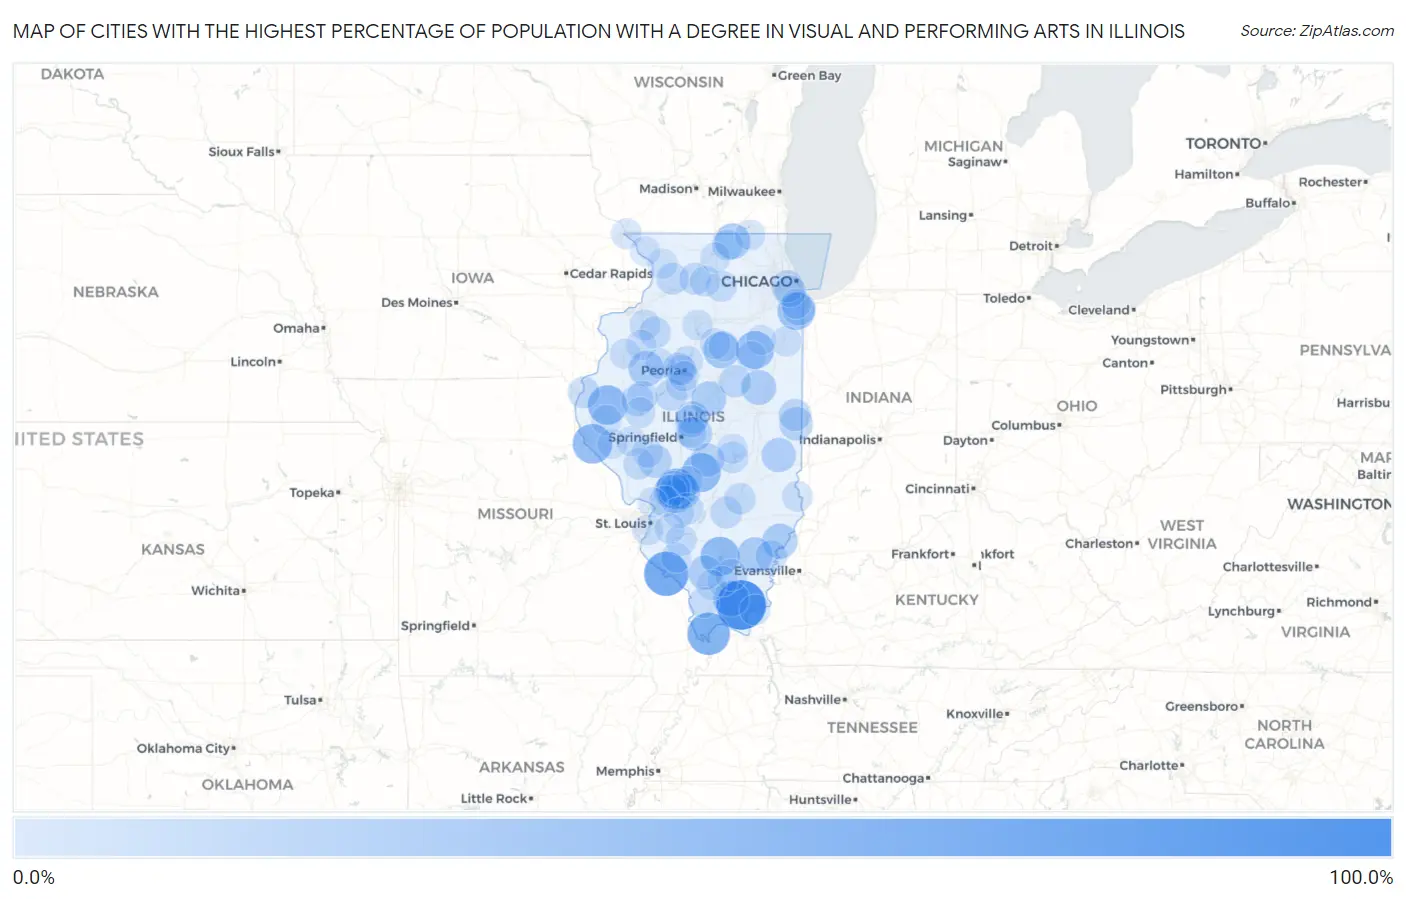
Map of Cities with the Highest Percentage of Population with a Degree in Visual and Performing Arts in Illinois
0.0%
100.0%
Cities with the Highest Percentage of Population with a Degree in Visual and Performing Arts in Illinois
| City | % Graduates | vs State | vs National | |
| 1. | Eddyville | 100.0% | 4.4%(+95.6)#1 | 4.3%(+95.7)#33 |
| 2. | Shirley | 100.0% | 4.4%(+95.6)#2 | 4.3%(+95.7)#34 |
| 3. | Kaskaskia | 75.0% | 4.4%(+70.6)#3 | 4.3%(+70.7)#59 |
| 4. | Mound City | 65.8% | 4.4%(+61.3)#4 | 4.3%(+61.5)#66 |
| 5. | Lake Ka Ho | 57.1% | 4.4%(+52.7)#5 | 4.3%(+52.9)#88 |
| 6. | Hull | 52.9% | 4.4%(+48.4)#6 | 4.3%(+48.6)#100 |
| 7. | Augusta | 51.8% | 4.4%(+47.4)#7 | 4.3%(+47.6)#102 |
| 8. | Nason | 50.0% | 4.4%(+45.6)#8 | 4.3%(+45.7)#112 |
| 9. | Wenonah | 50.0% | 4.4%(+45.6)#9 | 4.3%(+45.7)#130 |
| 10. | Emington | 45.5% | 4.4%(+41.0)#10 | 4.3%(+41.2)#148 |
| 11. | South Chicago Heights | 42.5% | 4.4%(+38.0)#11 | 4.3%(+38.2)#161 |
| 12. | Solon Mills | 38.1% | 4.4%(+33.7)#12 | 4.3%(+33.9)#190 |
| 13. | Dana | 37.5% | 4.4%(+33.1)#13 | 4.3%(+33.2)#198 |
| 14. | New Burnside | 35.3% | 4.4%(+30.8)#14 | 4.3%(+31.0)#223 |
| 15. | Capron | 35.0% | 4.4%(+30.6)#15 | 4.3%(+30.7)#227 |
| 16. | London Mills | 33.3% | 4.4%(+28.9)#16 | 4.3%(+29.1)#250 |
| 17. | Bellmont | 33.3% | 4.4%(+28.9)#17 | 4.3%(+29.1)#254 |
| 18. | Walshville | 33.3% | 4.4%(+28.9)#18 | 4.3%(+29.1)#255 |
| 19. | Springerton | 33.3% | 4.4%(+28.9)#19 | 4.3%(+29.1)#264 |
| 20. | Elliott | 31.6% | 4.4%(+27.1)#20 | 4.3%(+27.3)#287 |
| 21. | Mclean | 31.0% | 4.4%(+26.5)#21 | 4.3%(+26.7)#298 |
| 22. | Kansas | 28.9% | 4.4%(+24.4)#22 | 4.3%(+24.6)#333 |
| 23. | Dowell | 28.6% | 4.4%(+24.1)#23 | 4.3%(+24.3)#338 |
| 24. | Wilton Center | 28.6% | 4.4%(+24.1)#24 | 4.3%(+24.3)#343 |
| 25. | Buffalo | 28.1% | 4.4%(+23.7)#25 | 4.3%(+23.9)#354 |
| 26. | Georgetown | 25.2% | 4.4%(+20.7)#26 | 4.3%(+20.9)#414 |
| 27. | Alexander | 25.0% | 4.4%(+20.6)#27 | 4.3%(+20.7)#429 |
| 28. | Williamson | 25.0% | 4.4%(+20.6)#28 | 4.3%(+20.7)#434 |
| 29. | Scottville | 25.0% | 4.4%(+20.6)#29 | 4.3%(+20.7)#441 |
| 30. | Owaneco | 24.3% | 4.4%(+19.9)#30 | 4.3%(+20.1)#454 |
| 31. | Ford Heights | 24.3% | 4.4%(+19.8)#31 | 4.3%(+20.0)#455 |
| 32. | Eagarville | 23.5% | 4.4%(+19.1)#32 | 4.3%(+19.3)#473 |
| 33. | Wilsonville | 22.2% | 4.4%(+17.8)#33 | 4.3%(+18.0)#514 |
| 34. | Broadwell | 22.2% | 4.4%(+17.8)#34 | 4.3%(+18.0)#521 |
| 35. | Elkhart | 20.6% | 4.4%(+16.1)#35 | 4.3%(+16.3)#594 |
| 36. | Vermont | 20.0% | 4.4%(+15.6)#36 | 4.3%(+15.7)#625 |
| 37. | Tilton | 19.8% | 4.4%(+15.3)#37 | 4.3%(+15.5)#654 |
| 38. | Cooksville | 18.8% | 4.4%(+14.3)#38 | 4.3%(+14.5)#733 |
| 39. | Forest View | 18.6% | 4.4%(+14.2)#39 | 4.3%(+14.4)#737 |
| 40. | Norwood | 18.5% | 4.4%(+14.1)#40 | 4.3%(+14.3)#743 |
| 41. | Kinmundy | 18.2% | 4.4%(+13.7)#41 | 4.3%(+13.9)#759 |
| 42. | Crossville | 18.2% | 4.4%(+13.7)#42 | 4.3%(+13.9)#760 |
| 43. | Coleta | 18.2% | 4.4%(+13.7)#43 | 4.3%(+13.9)#767 |
| 44. | Thompsonville | 17.5% | 4.4%(+13.1)#44 | 4.3%(+13.3)#809 |
| 45. | Hamilton | 17.5% | 4.4%(+13.0)#45 | 4.3%(+13.2)#817 |
| 46. | Grand Detour | 17.4% | 4.4%(+13.0)#46 | 4.3%(+13.2)#819 |
| 47. | Forest City | 17.4% | 4.4%(+12.9)#47 | 4.3%(+13.1)#821 |
| 48. | Bishop Hill | 17.4% | 4.4%(+12.9)#48 | 4.3%(+13.1)#823 |
| 49. | Hometown | 17.4% | 4.4%(+12.9)#49 | 4.3%(+13.1)#825 |
| 50. | Mason | 16.7% | 4.4%(+12.2)#50 | 4.3%(+12.4)#883 |
| 51. | White City | 16.7% | 4.4%(+12.2)#51 | 4.3%(+12.4)#888 |
| 52. | Lake Carroll | 16.3% | 4.4%(+11.9)#52 | 4.3%(+12.1)#929 |
| 53. | Pocahontas | 16.3% | 4.4%(+11.8)#53 | 4.3%(+12.0)#934 |
| 54. | Findlay | 15.7% | 4.4%(+11.2)#54 | 4.3%(+11.4)#985 |
| 55. | White Hall | 15.4% | 4.4%(+11.0)#55 | 4.3%(+11.2)#1,020 |
| 56. | Ridgefield | 14.9% | 4.4%(+10.4)#56 | 4.3%(+10.6)#1,077 |
| 57. | Lee | 14.8% | 4.4%(+10.4)#57 | 4.3%(+10.6)#1,083 |
| 58. | Venedy | 14.3% | 4.4%(+9.84)#58 | 4.3%(+10.0)#1,165 |
| 59. | Poplar Grove | 13.9% | 4.4%(+9.50)#59 | 4.3%(+9.70)#1,206 |
| 60. | Spring Bay | 13.6% | 4.4%(+9.19)#60 | 4.3%(+9.38)#1,244 |
| 61. | South Pekin | 13.5% | 4.4%(+9.06)#61 | 4.3%(+9.26)#1,261 |
| 62. | Dawson | 13.5% | 4.4%(+9.06)#62 | 4.3%(+9.26)#1,262 |
| 63. | Holiday Shores | 13.5% | 4.4%(+9.05)#63 | 4.3%(+9.24)#1,268 |
| 64. | Palestine | 13.3% | 4.4%(+8.88)#64 | 4.3%(+9.08)#1,288 |
| 65. | Andover | 13.3% | 4.4%(+8.88)#65 | 4.3%(+9.08)#1,291 |
| 66. | Ipava | 13.2% | 4.4%(+8.71)#66 | 4.3%(+8.91)#1,328 |
| 67. | Rosiclare | 13.0% | 4.4%(+8.54)#67 | 4.3%(+8.73)#1,347 |
| 68. | Ashton | 12.8% | 4.4%(+8.32)#68 | 4.3%(+8.51)#1,376 |
| 69. | Wenona | 12.7% | 4.4%(+8.28)#69 | 4.3%(+8.48)#1,385 |
| 70. | West Peoria | 12.6% | 4.4%(+8.18)#70 | 4.3%(+8.38)#1,398 |
| 71. | East Carondelet | 12.5% | 4.4%(+8.05)#71 | 4.3%(+8.25)#1,422 |
| 72. | Browning | 12.5% | 4.4%(+8.05)#72 | 4.3%(+8.25)#1,433 |
| 73. | Highland | 12.3% | 4.4%(+7.85)#73 | 4.3%(+8.05)#1,459 |
| 74. | Cobden | 12.3% | 4.4%(+7.82)#74 | 4.3%(+8.02)#1,462 |
| 75. | Murrayville | 12.2% | 4.4%(+7.75)#75 | 4.3%(+7.94)#1,482 |
| 76. | Butler | 12.0% | 4.4%(+7.55)#76 | 4.3%(+7.75)#1,519 |
| 77. | Henderson | 12.0% | 4.4%(+7.55)#77 | 4.3%(+7.75)#1,521 |
| 78. | Long Point | 11.8% | 4.4%(+7.31)#78 | 4.3%(+7.51)#1,578 |
| 79. | East Dubuque | 11.6% | 4.4%(+7.13)#79 | 4.3%(+7.33)#1,612 |
| 80. | Aroma Park | 11.5% | 4.4%(+7.01)#80 | 4.3%(+7.21)#1,631 |
| 81. | Johnston City | 11.4% | 4.4%(+6.92)#81 | 4.3%(+7.12)#1,642 |
| 82. | Sparta | 11.2% | 4.4%(+6.77)#82 | 4.3%(+6.97)#1,672 |
| 83. | Monmouth | 11.1% | 4.4%(+6.69)#83 | 4.3%(+6.89)#1,683 |
| 84. | Marquette Heights | 11.1% | 4.4%(+6.69)#84 | 4.3%(+6.88)#1,685 |
| 85. | Scott Afb | 11.1% | 4.4%(+6.67)#85 | 4.3%(+6.87)#1,686 |
| 86. | Clayton | 11.1% | 4.4%(+6.66)#86 | 4.3%(+6.86)#1,698 |
| 87. | Bureau Junction | 11.1% | 4.4%(+6.66)#87 | 4.3%(+6.86)#1,713 |
| 88. | Hebron | 11.0% | 4.4%(+6.59)#88 | 4.3%(+6.79)#1,746 |
| 89. | Yates City | 11.0% | 4.4%(+6.51)#89 | 4.3%(+6.71)#1,761 |
| 90. | Mount Carroll | 10.8% | 4.4%(+6.33)#90 | 4.3%(+6.53)#1,806 |
| 91. | New Milford | 10.8% | 4.4%(+6.30)#91 | 4.3%(+6.50)#1,816 |
| 92. | Thornton | 10.7% | 4.4%(+6.29)#92 | 4.3%(+6.49)#1,818 |
| 93. | Cambria | 10.7% | 4.4%(+6.26)#93 | 4.3%(+6.46)#1,825 |
| 94. | Bethany | 10.6% | 4.4%(+6.16)#94 | 4.3%(+6.36)#1,868 |
| 95. | Hanover | 10.5% | 4.4%(+6.08)#95 | 4.3%(+6.27)#1,888 |
| 96. | New Salem | 10.5% | 4.4%(+6.08)#96 | 4.3%(+6.27)#1,897 |
| 97. | Reddick | 10.5% | 4.4%(+6.08)#97 | 4.3%(+6.27)#1,899 |
| 98. | Bluffs | 10.4% | 4.4%(+6.00)#98 | 4.3%(+6.20)#1,916 |
| 99. | Saunemin | 10.3% | 4.4%(+5.89)#99 | 4.3%(+6.09)#1,952 |
| 100. | Alton | 10.2% | 4.4%(+5.73)#100 | 4.3%(+5.92)#2,005 |
Common Questions
What are the Top 10 Cities with the Highest Percentage of Population with a Degree in Visual and Performing Arts in Illinois?
Top 10 Cities with the Highest Percentage of Population with a Degree in Visual and Performing Arts in Illinois are:
#1
100.0%
#2
75.0%
#3
65.8%
#4
57.1%
#5
52.9%
#6
51.8%
#7
50.0%
#8
50.0%
#9
45.5%
#10
42.5%
What city has the Highest Percentage of Population with a Degree in Visual and Performing Arts in Illinois?
Eddyville has the Highest Percentage of Population with a Degree in Visual and Performing Arts in Illinois with 100.0%.
What is the Percentage of Population with a Degree in Visual and Performing Arts in the State of Illinois?
Percentage of Population with a Degree in Visual and Performing Arts in Illinois is 4.4%.
What is the Percentage of Population with a Degree in Visual and Performing Arts in the United States?
Percentage of Population with a Degree in Visual and Performing Arts in the United States is 4.3%.