Cities with the Highest Percentage of Immigrants from South Eastern Asia in North Dakota
RELATED REPORTS & OPTIONS
South Eastern Asia
North Dakota
Compare Cities
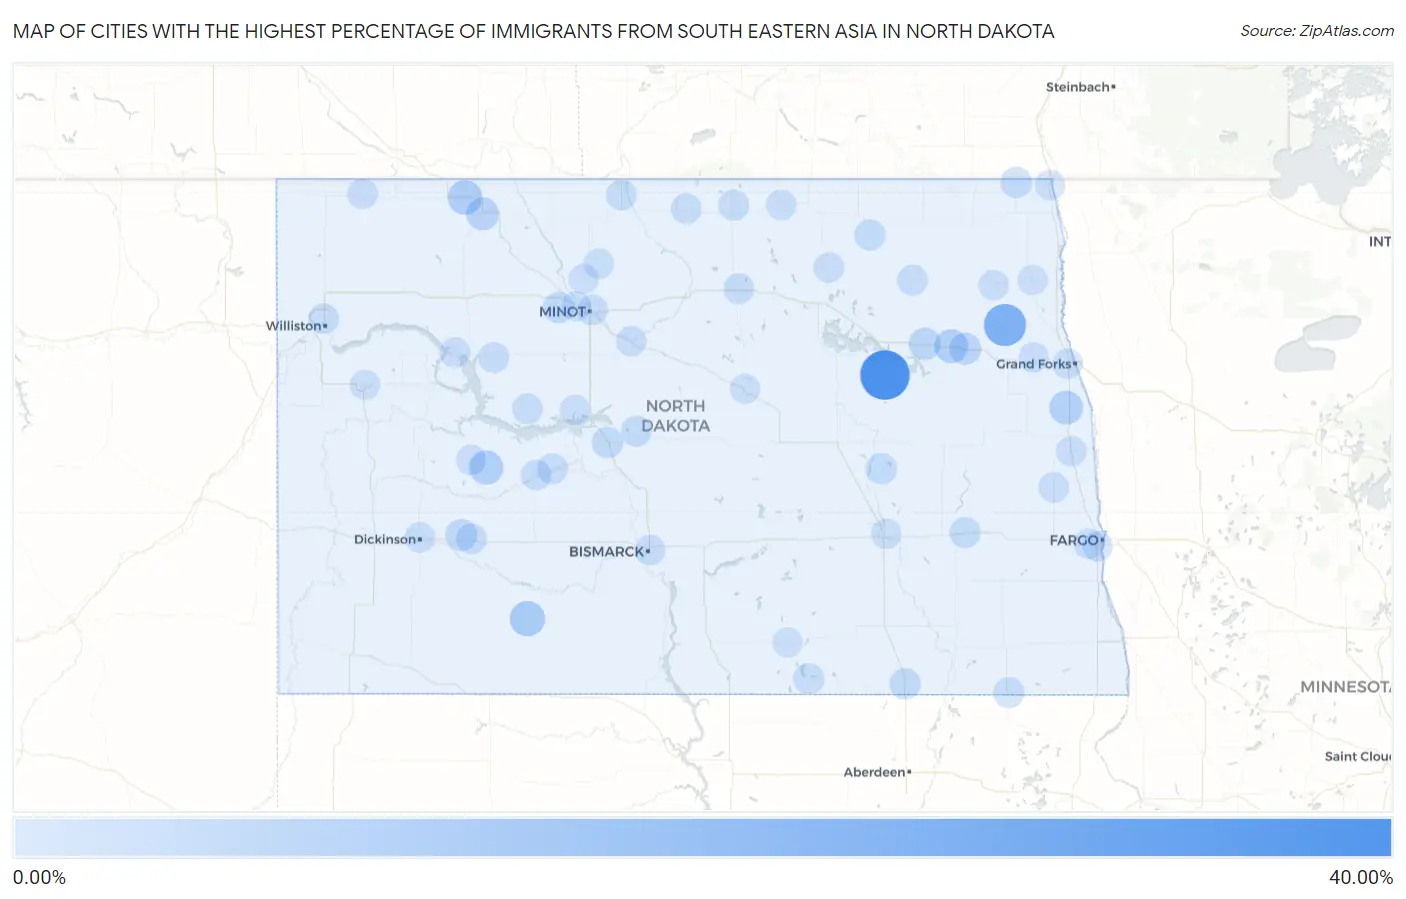
Map of Cities with the Highest Percentage of Immigrants from South Eastern Asia in North Dakota
0.00%
40.00%
Cities with the Highest Percentage of Immigrants from South Eastern Asia in North Dakota
| City | South Eastern Asia | vs State | vs National | |
| 1. | Warwick | 31.63% | 0.44%(+31.2)#-1 | 1.30%(+30.3)#0 |
| 2. | Inkster | 19.23% | 0.44%(+18.8)#0 | 1.30%(+17.9)#1 |
| 3. | Elgin | 8.01% | 0.44%(+7.57)#1 | 1.30%(+6.72)#2 |
| 4. | Flaxton | 6.82% | 0.44%(+6.37)#2 | 1.30%(+5.52)#3 |
| 5. | Dodge | 6.25% | 0.44%(+5.81)#3 | 1.30%(+4.95)#4 |
| 6. | Michigan City | 5.77% | 0.44%(+5.32)#4 | 1.30%(+4.47)#5 |
| 7. | Reynolds | 5.56% | 0.44%(+5.11)#5 | 1.30%(+4.26)#6 |
| 8. | Bowbells | 4.21% | 0.44%(+3.77)#6 | 1.30%(+2.91)#7 |
| 9. | Lakota | 3.36% | 0.44%(+2.91)#7 | 1.30%(+2.06)#8 |
| 10. | Petersburg | 3.05% | 0.44%(+2.61)#8 | 1.30%(+1.76)#9 |
| 11. | Taylor | 2.69% | 0.44%(+2.24)#9 | 1.30%(+1.39)#10 |
| 12. | Underwood | 2.19% | 0.44%(+1.74)#10 | 1.30%(+0.889)#11 |
| 13. | Des Lacs | 2.00% | 0.44%(+1.56)#11 | 1.30%(+0.704)#12 |
| 14. | Ellendale | 1.91% | 0.44%(+1.46)#12 | 1.30%(+0.609)#13 |
| 15. | Kensal | 1.81% | 0.44%(+1.36)#13 | 1.30%(+0.509)#14 |
| 16. | Neche | 1.79% | 0.44%(+1.35)#14 | 1.30%(+0.499)#15 |
| 17. | Munich | 1.48% | 0.44%(+1.04)#15 | 1.30%(+0.187)#16 |
| 18. | Turtle Lake | 1.39% | 0.44%(+0.947)#16 | 1.30%(+0.095)#17 |
| 19. | Valley City | 1.39% | 0.44%(+0.943)#17 | 1.30%(+0.091)#18 |
| 20. | East Dunseith | 1.31% | 0.44%(+0.862)#18 | 1.30%(+0.011)#19 |
| 21. | Ashley | 1.30% | 0.44%(+0.858)#19 | 1.30%(+0.007)#20 |
| 22. | Richardton | 1.17% | 0.44%(+0.727)#20 | 1.30%(-0.124)#21 |
| 23. | Havana | 1.14% | 0.44%(+0.692)#21 | 1.30%(-0.160)#22 |
| 24. | Parshall | 1.07% | 0.44%(+0.623)#22 | 1.30%(-0.228)#23 |
| 25. | Edmore | 1.01% | 0.44%(+0.569)#23 | 1.30%(-0.283)#24 |
| 26. | White Shield | 1.00% | 0.44%(+0.555)#24 | 1.30%(-0.296)#25 |
| 27. | Rugby | 0.98% | 0.44%(+0.535)#25 | 1.30%(-0.317)#26 |
| 28. | Bottineau | 0.95% | 0.44%(+0.506)#26 | 1.30%(-0.346)#27 |
| 29. | Hazen | 0.93% | 0.44%(+0.489)#27 | 1.30%(-0.362)#28 |
| 30. | Williston | 0.92% | 0.44%(+0.473)#28 | 1.30%(-0.378)#29 |
| 31. | Minot | 0.85% | 0.44%(+0.400)#29 | 1.30%(-0.451)#158 |
| 32. | Westhope | 0.83% | 0.44%(+0.388)#30 | 1.30%(-0.463)#159 |
| 33. | Beulah | 0.82% | 0.44%(+0.371)#31 | 1.30%(-0.480)#160 |
| 34. | Rolla | 0.76% | 0.44%(+0.311)#32 | 1.30%(-0.540)#161 |
| 35. | Cando | 0.74% | 0.44%(+0.294)#33 | 1.30%(-0.557)#162 |
| 36. | Hunter | 0.71% | 0.44%(+0.262)#34 | 1.30%(-0.590)#163 |
| 37. | West Fargo | 0.68% | 0.44%(+0.236)#35 | 1.30%(-0.616)#164 |
| 38. | Crosby | 0.63% | 0.44%(+0.189)#36 | 1.30%(-0.663)#165 |
| 39. | Halliday | 0.63% | 0.44%(+0.188)#37 | 1.30%(-0.663)#166 |
| 40. | Grand Forks Afb | 0.62% | 0.44%(+0.170)#38 | 1.30%(-0.681)#167 |
| 41. | Bismarck | 0.61% | 0.44%(+0.166)#39 | 1.30%(-0.686)#168 |
| 42. | New Town | 0.59% | 0.44%(+0.145)#40 | 1.30%(-0.707)#169 |
| 43. | Hillsboro | 0.54% | 0.44%(+0.099)#41 | 1.30%(-0.753)#170 |
| 44. | Fargo | 0.54% | 0.44%(+0.096)#42 | 1.30%(-0.756)#171 |
| 45. | Dickinson | 0.53% | 0.44%(+0.085)#43 | 1.30%(-0.767)#172 |
| 46. | Park River | 0.51% | 0.44%(+0.069)#44 | 1.30%(-0.782)#173 |
| 47. | Grand Forks | 0.49% | 0.44%(+0.047)#45 | 1.30%(-0.804)#174 |
| 48. | Velva | 0.48% | 0.44%(+0.031)#46 | 1.30%(-0.820)#175 |
| 49. | Glenburn | 0.41% | 0.44%(-0.037)#47 | 1.30%(-0.888)#176 |
| 50. | Garrison | 0.39% | 0.44%(-0.051)#48 | 1.30%(-0.903)#177 |
| 51. | Jamestown | 0.29% | 0.44%(-0.155)#49 | 1.30%(-1.01)#178 |
| 52. | Watford City | 0.25% | 0.44%(-0.191)#50 | 1.30%(-1.04)#179 |
| 53. | Minot Afb | 0.22% | 0.44%(-0.222)#51 | 1.30%(-1.07)#180 |
| 54. | Pembina | 0.18% | 0.44%(-0.264)#52 | 1.30%(-1.12)#181 |
| 55. | Burlington | 0.15% | 0.44%(-0.292)#53 | 1.30%(-1.14)#182 |
| 56. | Grafton | 0.14% | 0.44%(-0.301)#54 | 1.30%(-1.15)#183 |
| 57. | Harvey | 0.11% | 0.44%(-0.332)#55 | 1.30%(-1.18)#184 |
| 58. | Wishek | 0.11% | 0.44%(-0.340)#56 | 1.30%(-1.19)#185 |
Common Questions
What are the Top 10 Cities with the Highest Percentage of Immigrants from South Eastern Asia in North Dakota?
Top 10 Cities with the Highest Percentage of Immigrants from South Eastern Asia in North Dakota are:
#1
31.63%
#2
19.23%
#3
8.01%
#4
6.82%
#5
6.25%
#6
5.77%
#7
5.56%
#8
4.21%
#9
3.36%
#10
3.05%
What city has the Highest Percentage of Immigrants from South Eastern Asia in North Dakota?
Warwick has the Highest Percentage of Immigrants from South Eastern Asia in North Dakota with 31.63%.
What is the Percentage of Immigrants from South Eastern Asia in the State of North Dakota?
Percentage of Immigrants from South Eastern Asia in North Dakota is 0.44%.
What is the Percentage of Immigrants from South Eastern Asia in the United States?
Percentage of Immigrants from South Eastern Asia in the United States is 1.30%.