Cities with the Most Immigrants from Bolivia in Illinois
RELATED REPORTS & OPTIONS
Bolivia
Illinois
Compare Cities
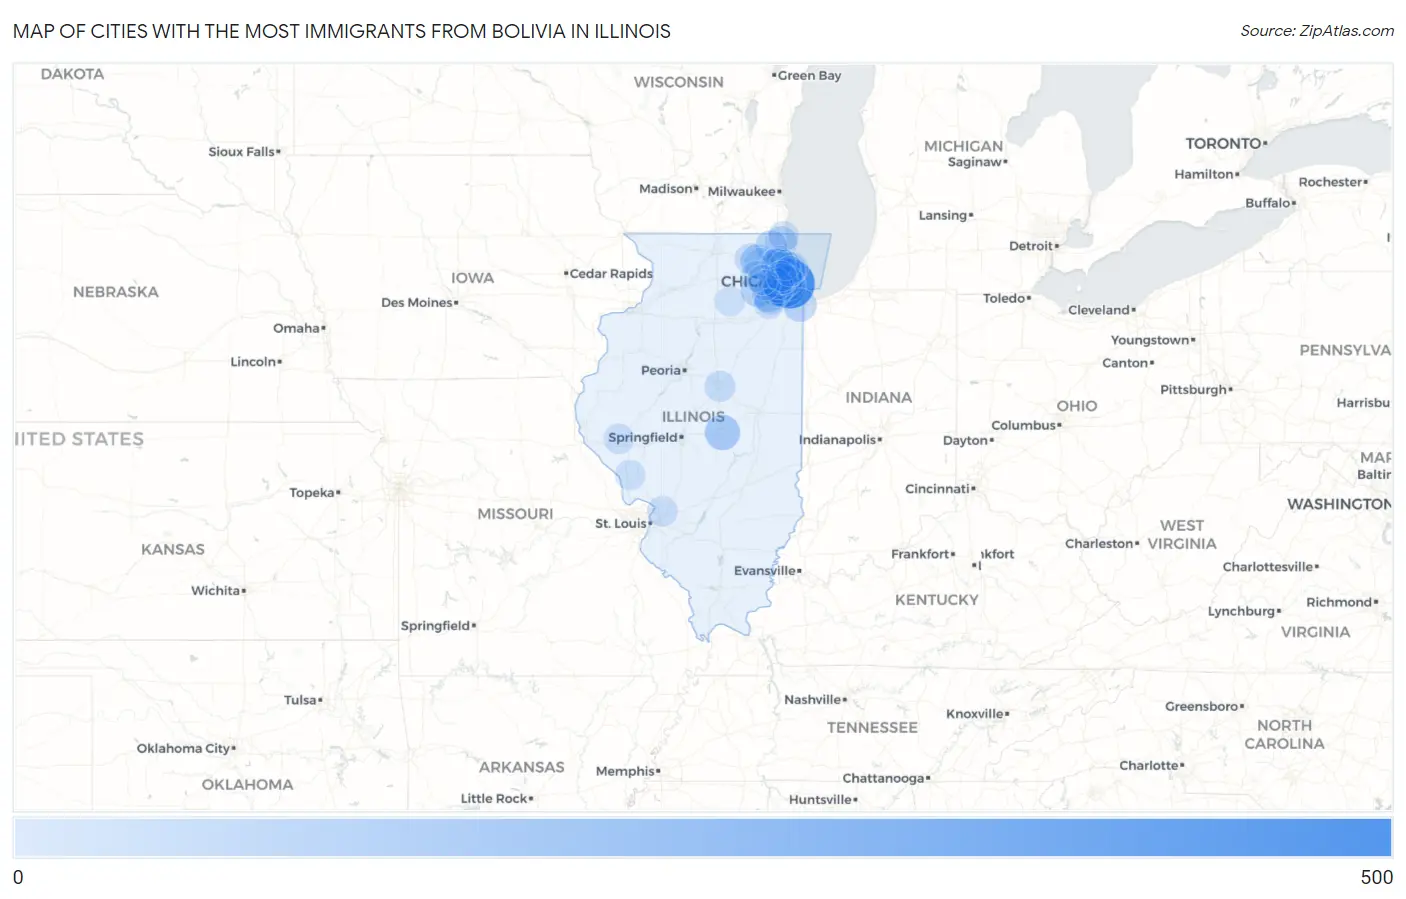
Map of Cities with the Most Immigrants from Bolivia in Illinois
0
500
Cities with the Most Immigrants from Bolivia in Illinois
| City | Bolivia | vs State | vs National | |
| 1. | Chicago | 456 | 1,913(23.84%)#1 | 80,173(0.57%)#20 |
| 2. | Lyons | 270 | 1,913(14.11%)#2 | 80,173(0.34%)#43 |
| 3. | Decatur | 118 | 1,913(6.17%)#3 | 80,173(0.15%)#124 |
| 4. | Berwyn | 95 | 1,913(4.97%)#4 | 80,173(0.12%)#158 |
| 5. | Mount Prospect | 87 | 1,913(4.55%)#5 | 80,173(0.11%)#167 |
| 6. | Carpentersville | 85 | 1,913(4.44%)#6 | 80,173(0.11%)#177 |
| 7. | Aurora | 79 | 1,913(4.13%)#7 | 80,173(0.10%)#196 |
| 8. | Bolingbrook | 76 | 1,913(3.97%)#8 | 80,173(0.09%)#201 |
| 9. | Lansing | 72 | 1,913(3.76%)#9 | 80,173(0.09%)#212 |
| 10. | Waukegan | 46 | 1,913(2.40%)#10 | 80,173(0.06%)#324 |
| 11. | Round Lake Park | 44 | 1,913(2.30%)#11 | 80,173(0.05%)#331 |
| 12. | La Grange Park | 38 | 1,913(1.99%)#12 | 80,173(0.05%)#370 |
| 13. | Elmhurst | 30 | 1,913(1.57%)#13 | 80,173(0.04%)#432 |
| 14. | Skokie | 27 | 1,913(1.41%)#14 | 80,173(0.03%)#459 |
| 15. | Romeoville | 27 | 1,913(1.41%)#15 | 80,173(0.03%)#460 |
| 16. | East Dundee | 27 | 1,913(1.41%)#16 | 80,173(0.03%)#468 |
| 17. | Evanston | 25 | 1,913(1.31%)#17 | 80,173(0.03%)#487 |
| 18. | Harwood Heights | 24 | 1,913(1.25%)#18 | 80,173(0.03%)#513 |
| 19. | Lombard | 22 | 1,913(1.15%)#19 | 80,173(0.03%)#540 |
| 20. | Prospect Heights | 22 | 1,913(1.15%)#20 | 80,173(0.03%)#544 |
| 21. | Bloomington | 20 | 1,913(1.05%)#21 | 80,173(0.02%)#567 |
| 22. | Oak Park | 19 | 1,913(0.99%)#22 | 80,173(0.02%)#586 |
| 23. | Darien | 19 | 1,913(0.99%)#23 | 80,173(0.02%)#593 |
| 24. | Huntley | 17 | 1,913(0.89%)#24 | 80,173(0.02%)#627 |
| 25. | Wheeling | 16 | 1,913(0.84%)#25 | 80,173(0.02%)#646 |
| 26. | St Charles | 13 | 1,913(0.68%)#26 | 80,173(0.02%)#713 |
| 27. | Hinsdale | 13 | 1,913(0.68%)#27 | 80,173(0.02%)#715 |
| 28. | Arlington Heights | 10 | 1,913(0.52%)#28 | 80,173(0.01%)#782 |
| 29. | Oak Brook | 10 | 1,913(0.52%)#29 | 80,173(0.01%)#810 |
| 30. | Melrose Park | 9 | 1,913(0.47%)#30 | 80,173(0.01%)#830 |
| 31. | Glenview | 7 | 1,913(0.37%)#31 | 80,173(0.01%)#888 |
| 32. | Edwardsville | 7 | 1,913(0.37%)#32 | 80,173(0.01%)#893 |
| 33. | Franklin Park | 7 | 1,913(0.37%)#33 | 80,173(0.01%)#902 |
| 34. | Warrenville | 7 | 1,913(0.37%)#34 | 80,173(0.01%)#904 |
| 35. | Zion | 6 | 1,913(0.31%)#35 | 80,173(0.01%)#921 |
| 36. | Crest Hill | 5 | 1,913(0.26%)#36 | 80,173(0.01%)#938 |
| 37. | Lincolnwood | 5 | 1,913(0.26%)#37 | 80,173(0.01%)#940 |
| 38. | Perry | 5 | 1,913(0.26%)#38 | 80,173(0.01%)#953 |
| 39. | Leland | 3 | 1,913(0.16%)#39 | 80,173(0.00%)#990 |
| 40. | West Chicago | 1 | 1,913(0.05%)#40 | 80,173(0.00%)#1,012 |
| 41. | Eldred | 1 | 1,913(0.05%)#41 | 80,173(0.00%)#1,020 |
Common Questions
What are the Top 10 Cities with the Most Immigrants from Bolivia in Illinois?
Top 10 Cities with the Most Immigrants from Bolivia in Illinois are:
#1
456
#2
270
#3
118
#4
95
#5
87
#6
85
#7
79
#8
76
#9
72
#10
46
What city has the Most Immigrants from Bolivia in Illinois?
Chicago has the Most Immigrants from Bolivia in Illinois with 456.
What is the Total Immigrants from Bolivia in the State of Illinois?
Total Immigrants from Bolivia in Illinois is 1,913.
What is the Total Immigrants from Bolivia in the United States?
Total Immigrants from Bolivia in the United States is 80,173.